. 2022 Jun;2(6):484-493.
doi: 10.1038/s43587-022-00220-0. Epub 2022 May 16.

The relationship between epigenetic age and the hallmarks of aging in human cells

Affiliations

The relationship between epigenetic age and the hallmarks of aging in human cells

Sylwia Kabacik et al. Nat Aging. 2022 Jun.

Abstract

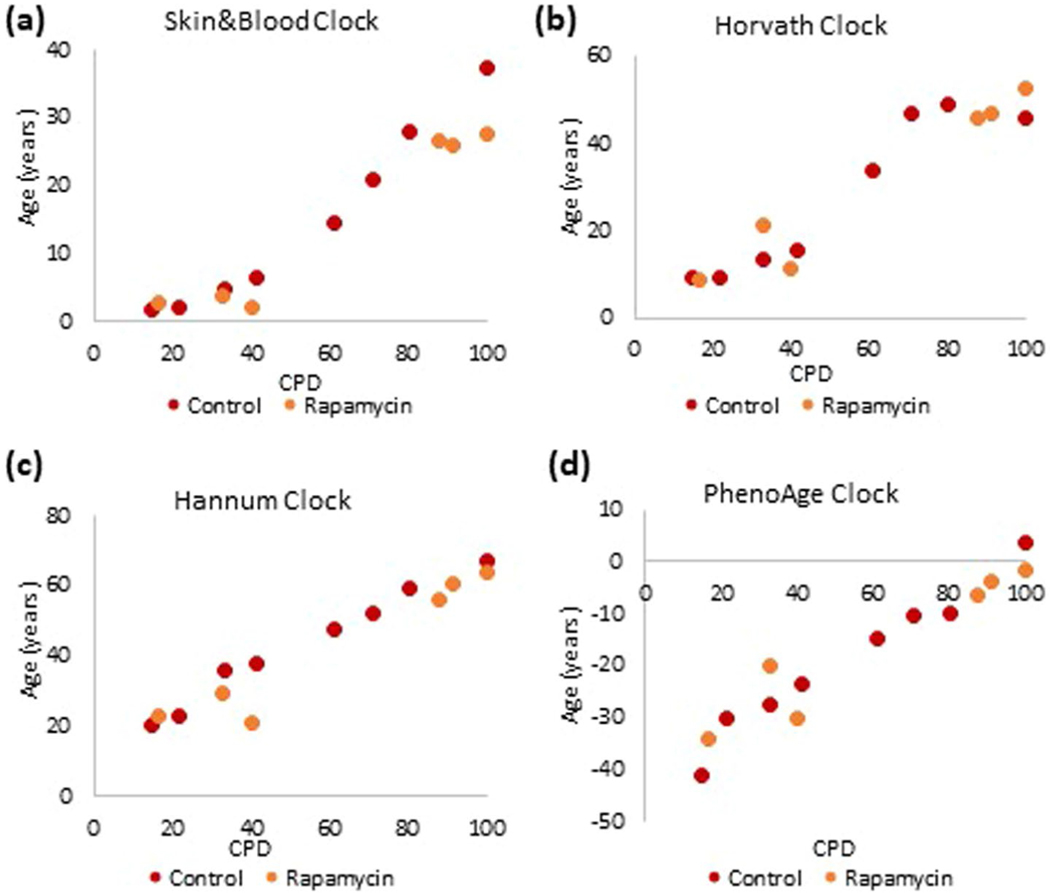
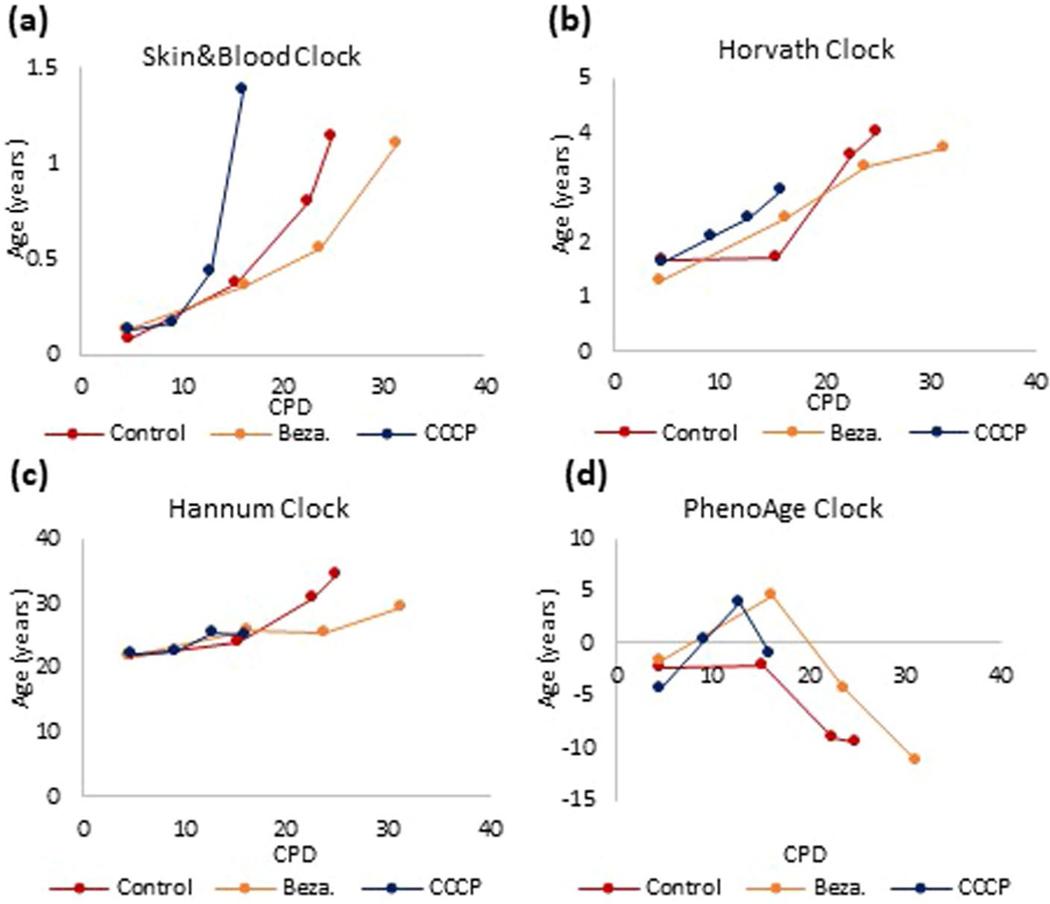
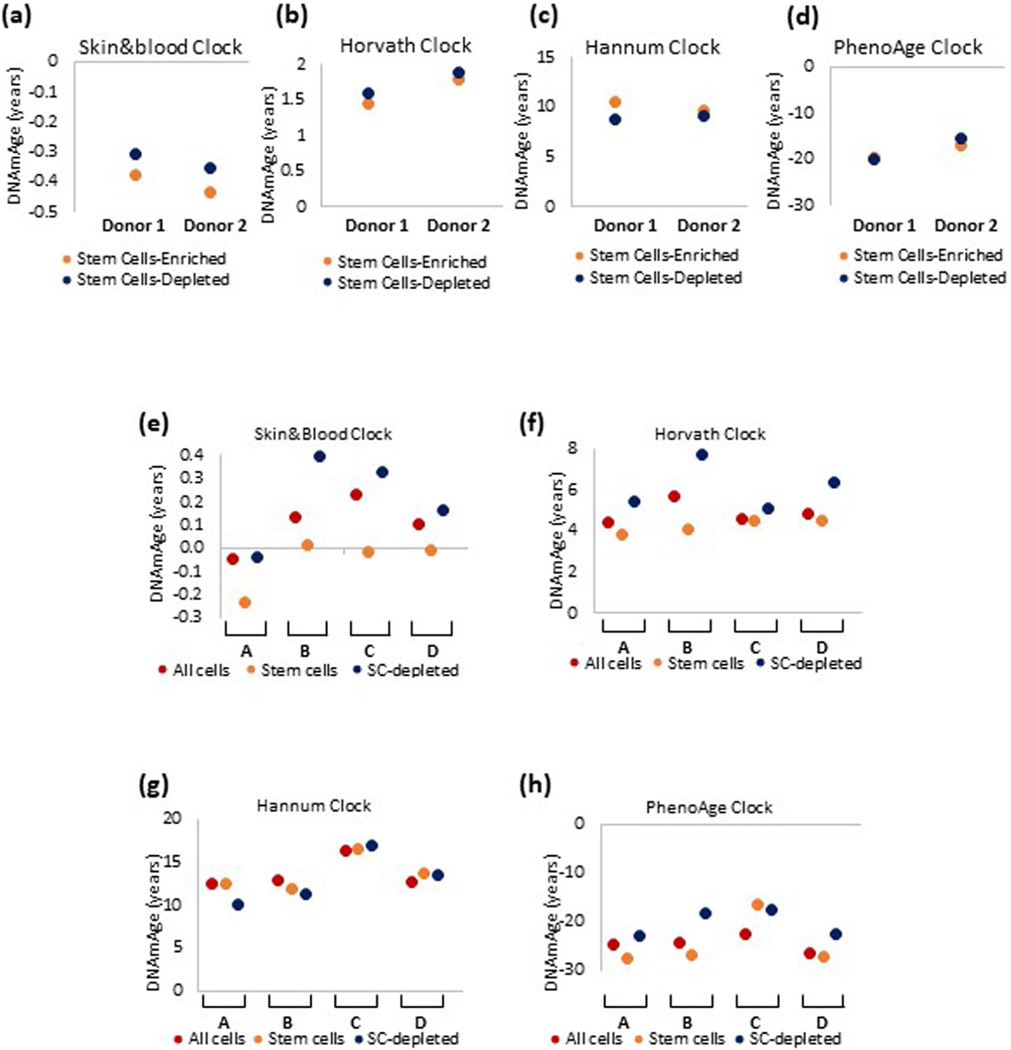
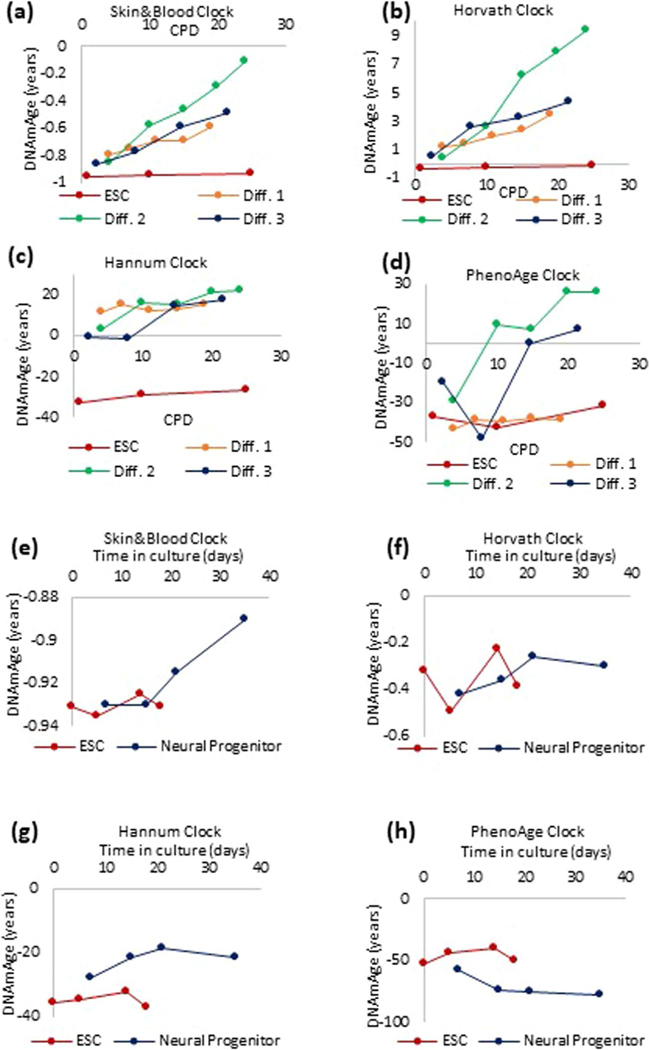
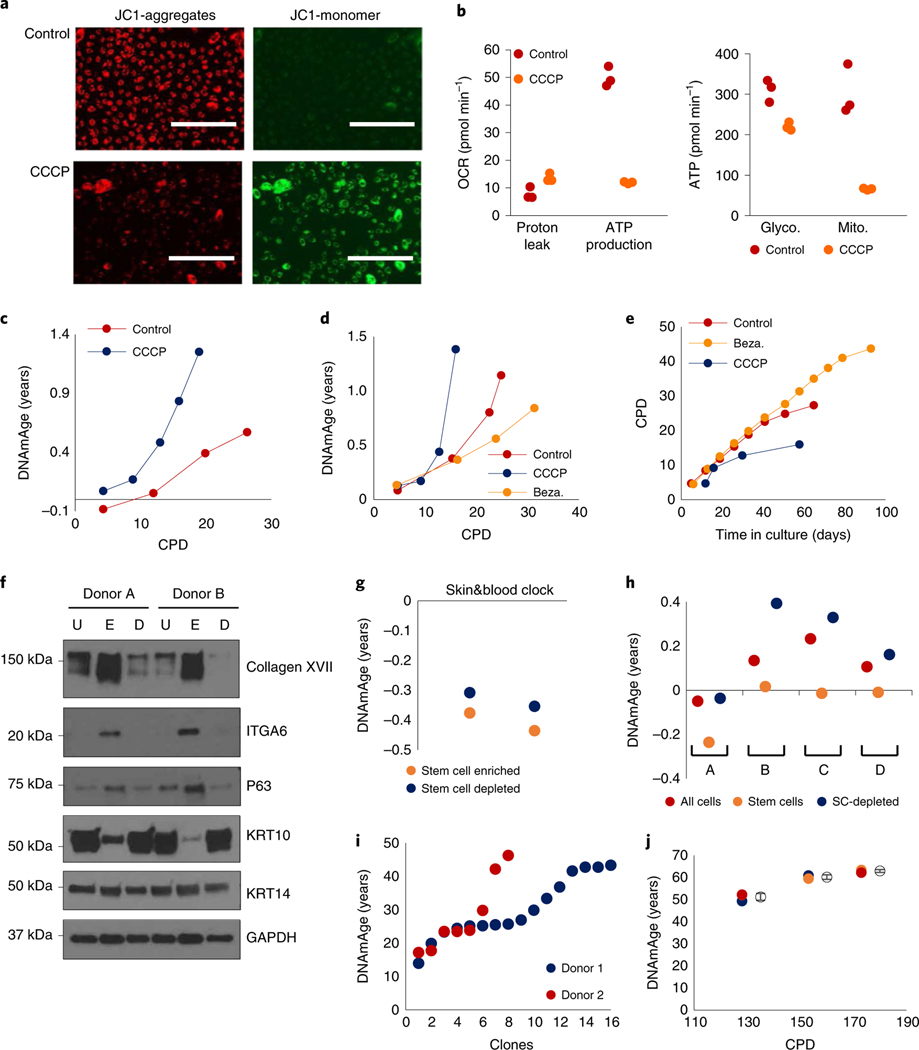
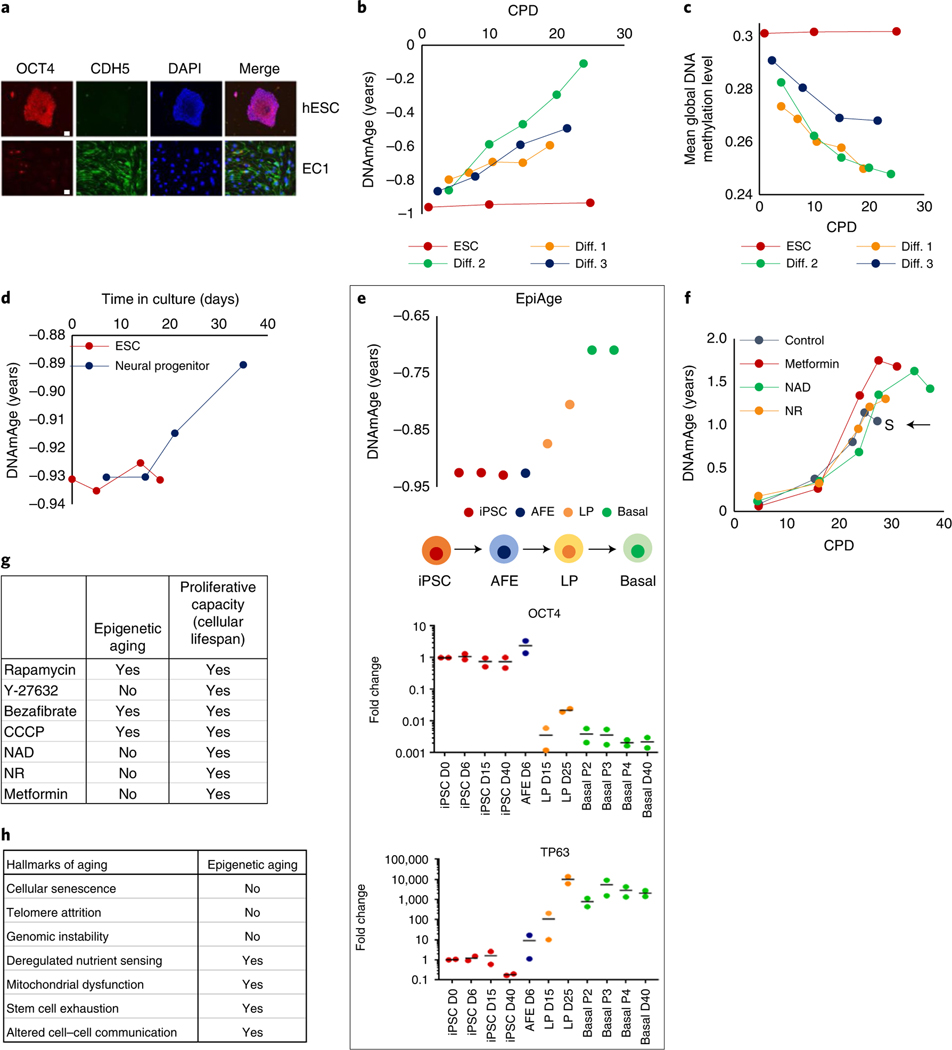
Epigenetic clocks are mathematically derived age estimators that are based on combinations of methylation values that change with age at specific CpGs in the genome. These clocks are widely used to measure the age of tissues and cells1,2. The discrepancy between epigenetic age (EpiAge), as estimated by these clocks, and chronological age is referred to as EpiAge acceleration. Epidemiological studies have linked EpiAge acceleration to a wide variety of pathologies, health states, lifestyle, mental state and environmental factors2, indicating that epigenetic clocks tap into critical biological processes that are involved in aging. Despite the importance of this inference, the mechanisms underpinning these clocks remained largely uncharacterized and unelucidated. Here, using primary human cells, we set out to investigate whether epigenetic aging is the manifestation of one or more of the aging hallmarks previously identified3. We show that although epigenetic aging is distinct from cellular senescence, telomere attrition and genomic instability, it is associated with nutrient sensing, mitochondrial activity and stem cell composition.


Conflict of interest statement

Competing interests S.H. is a cofounder of a nonprofit, the Epigenetic Clock Development Foundation, that serves to freely facilitate the use of these technology and methods. All other authors have no competing interests.

Figures

Extended Data Fig. 1 |
Extended Data Fig. 1 |. Comparison between the performances of four most-commonly employed epigenetic clocks on in vitro cultured human cells.
Measurement of EpiAge of primary keratinocytes from human neonatal foreskin that were cultured in vitro and monitored at different points in time. DNA methylation profiles of these cells were analyzed using the (a) Skin&blood clock, (b) Horvath clock, (c) Hannum clock and (d) PhenoAge clock. Extended_Data_Figure_Legend.docx.
Extended Data Fig. 2 |
Extended Data Fig. 2 |. effects of various inducers of cellular senescence on epigenetic aging.
Measurement of EpiAge with four epigenetic clocks on primary human fibroblasts isolated from neonatal foreskins of 14 donors. Fibroblasts were cultured until replicative senescence (red), induced to senesce by X-irradiation (green), induced to senesce by ectopic expression of activated ras oncogene (orange) or untreated (blue). Methylation profiles of these cells were analyzed using the (a) Skin&blood clock, (b) Horvath clock, (c) Hannum clock and (d) PhenoAge clock.
Extended Data Fig. 3 |
Extended Data Fig. 3 |. The impact of prevention of replicative senescence on epigenetic aging.
Measurement of EpiAge of human neonatal primary fibroblasts transduced with hTERT-expressing vectors or empty vector at various time point during their culture until senescence (S) of the control cells. DNA methylation profiles were analyzed by four different epigenetic clocks (a-d). Similar approach was employed with adult human coronary artery cells (e-h).
Extended Data Fig. 4 |
Extended Data Fig. 4 |. The impact of chronic ionizing radiation on epigenetic aging.
Primary human keratinocytes (a-d) and primary human fibroblasts (e-h) were subjected continuous gamma irradiation at 1 mGy/hr until replicative senescence. DNA methylation profiles of these cells and their respective unexposed controls that were cultured in parallel were analyzed by four different epigenetic clocks.
Extended Data Fig. 5 |
Extended Data Fig. 5 |. The impact of perturbing nutrient-sensing mechanism at different cellular age.
DNA methylation profiles of human umbilical vein endothelial cells cultured with rapamycin at early (E) or late (L) time points of culture (corresponding to young and old cells respectively) were subjected to EpiAge measurement using four different epigenetic clocks (a-d).
Extended Data Fig. 6 |
Extended Data Fig. 6 |. The impact of perturbing mitochondria function on epigenetic aging.
Mitochondrial activity of primary human keratinocytes was either compromised by treatment with CCCP or enhanced by culturing in Bezafibrate. DNA methylation profiles of these cells and their untreated controls were analyzed by four different epigenetic clocks (a-d).
Extended Data Fig. 7 |
Extended Data Fig. 7 |. epigenetic age of epidermal stem cells and non-stem cells.
Epigenetic age of stem cell-enriched and stem cell-depleted keratinocytes isolated from two different (Donor 1 and 2) neonatal foreskins, and measured by four epigenetic clocks (a-d). Epigenetic age of stem cell-enriched and stem cell-depleted keratinocytes isolated from foreskins of four neonate donors (A-D), that were put to proliferate in culture. Epigenetic age was measured using four different epigenetic clocks (e-h).
Extended Data Fig. 8 |
Extended Data Fig. 8 |. initiation of the ticking of the epigenetic clock.
Human embryonic stem cells (ESCs) were differentiated in vitro, into endothelial cells (Diff 1–3 are three independent EC lines derived) (a-d), or neural progenitor cells (e-h), and the EpiAge of these cells were measured using four different epigenetic clocks.
Extended Data Fig. 9 |
Extended Data Fig. 9 |. initiation of the epigenetic clock during iPSC differentiation.
Tracking of EpiAge of human induced pluripotent stem cells (iPSC) that were differentiated into human lung epithelial basal cells (Basal) via transition through anterior foregut cells (AFE) and lung progenitor cells (LP). The EpiAge of these cells were measured using the four different epigenetic clocks (a-d).
Extended Data Fig. 10 |
Extended Data Fig. 10 |. Distinct effects of various compound on lifespan and aging.
Epigenetic age of human neonatal keratinocytes treated continuously with nicotinamide adenine diphosphate (NAD), nicotinamide riboside (NR) or metformin. The arrow and letter ‘S’ denotes when untreated control cells became senescent. The DNA methylation profiles of these cells were analyzed by four different epigenetic clocks (a-d).
Fig. 1 |
Fig. 1 |. EpiAge is distinct from cellular senescence and telomere attrition.
a, Measurement of EpiAge (DNAmAge) of whole skin, keratinocytes and fibroblasts from 14 healthy human skin samples. Absence of samples between 1 and 40 years old reflects the scarcity of hospital admissions of this demographic group. b, Measurement of DNAmAge of 17 BCCs and corresponding adjacent healthy skin. c, EpiAge of in vitro-cultured neonatal human dermal keratinocytes (HDK) derived from foreskin. CPD, cumulative population doubling. Representative of more than three experiments. d, EpiAges of primary human dermal fibroblasts isolated from skin of 14 healthy neonatal donors and subjected to 20 Gy X-rays, transduced to express oncogenic ras or cultured until replicative senescence (Rep.Sen). e, DNA methylation-based estimation of telomere length (DNAmTL) of cells described in d. f, DNAmAge of neonatal primary human dermal fibroblasts transduced with empty vector (control) or hTERT-expressing vector (hTERT). The arrow and letter ‘S’ denote the point at which the untreated control cells became senescent. Representative of two experiments. g, EpiAge of adult HCAECs transduced with empty vector (control) or vector expressing hTERT. Representative of three experiments
Fig. 2 |
Fig. 2 |. EpiAge is not affected by genomic instability induced by radiation-induced DNA breaks.
a, Measurement of EpiAge of neonatal HDFs from 25 donors, with ages of unirradiated cells (control) and their corresponding 20 Gy-irradiated (X-ray) counterparts connected by vertical lines. b, Effects of continuous low-dose radiation (1 mGy/h) on the growth of neonatal HDKs. c, Effects of continuous radiation (1 mGy/h) on EpiAge of neonatal HDK described in b. d, Effects of continuous low-dose radiation (1 mGy/h) on the growth of neonatal HDFs. e, Effects of continuous radiation (1 mGy/h) on EpiAge of neonatal HDFs as described in d. For be, figures are representative of three experiments carried out at the same time with cells from different donors. f, Effects of chronic irradiation at 20 mGy/h on EpiAge of neonatal HDFs through three passages in culture in a single experiment. g, Measurement of EpiAge of three independent strains of MEFs with replications 1 and 2 (Rep.1 and Rep.2). Cells were either unirradiated (control) or irradiated at (50 mGy/h) for 24 h followed by 6 days of recovery without irradiation. Representative of a single experiment. h, Effects of rapamycin on EpiAge of hTERT-immortalized HUVECs at adult EpiAge. Rapamycin was administered at the point indicated by arrow (+ Rapamycin). Representative of two experiments, with the other experiment using keratinocytes.
Fig. 3 |
Fig. 3 |. Mitochondrial activity and tissue composition affects EpiAge.
a, Mitochondrial potential of untreated and CCCP-treated neonatal HDKs compared using JC-1, which aggregates in mitochondria with high potential (red) but remains green when unaggregated Scale bars, 200 μm. Representative of two experiments. b, Production of adenosine triphosphate (ATP) and mitochondrial proton leak of control and CCCP-treated HDKs were measured with Seahorse technology (left). Comparative ATP production from glycolysis or the Krebs cycle was also measured (right). Data represent triplicates of a single experiment, which was repeated twice. OCR, oxygen consumption rate. c, Determination of the effect of CCCP on cellular epigenetic aging. Representative of a single experiment. d, Effects of CCCP and bezafibrate (Beza.) on epigenetic aging of neonatal HDK (representative of two experiments). e, Lifespan of HDKs (representative of a single experiment). Representative figure of two experiments. f, Expression of various proteins in unprocessed epidermis (U), stem cell-enriched fraction (E) and stem cell-depleted fraction (D) from two neonatal donors. Representative of four blots. g, EpiAge of stem cell-enriched fraction (stem cells) and stem cell-depleted fraction (SC-depleted) in epidermis from two donors. Representative of a single experiment. h, EpiAges of in vitro-cultured unfractionated cells (all cells), stem cell-enriched fraction (stem cells) and stem cell-depleted fraction (SC-depleted) from four neonatal donors, A to D. Representative of a single experiment. i, EpiAge of individual clones derived from two independent HCAEC donors with an EpiAge of 23 years. j, EpiAge of HUVECs from three different CPDs was measured in triplicate. Empty circles represent mean EpiAge of the replicates, and error bars represent standard deviation. Representative of a single experiment
Fig. 4 |
Fig. 4 |. Epigenetic clock starts ticking when ESCs lose their pluripotency.
a, Immunofluorescence analyses of OCT4 (red), expressed exclusively by human ESCs (hESCs) and VE-cadherin (CDH5) in green, a marker of endothelial cells. EC1 cells were differentiated from hESCs to become endothelial cells. Red dots in EC1 are anti-CD31 beads used in endothelial cell purification, which were stained by secondary antibody. Representative of two experiments. Scale bars, 20 μm. b, EpiAge of three independent lines of endothelial cells (Diff.1–3) differentiated from hESCs. c, Mean methylation levels of the cells described in b. d, EpiAge following differentiation of hESCs into neural progenitor cells. Representative of a single experiment. e, Tracking of EpiAge of human iPSCs that were differentiated into human lung epithelial basal cells (basal) via transition through AFE and LP cells. RnA levels of OCT4 and TP63 of these cells were measured by qPCR. Representative of two experiments. D, day; P, passage. f, EpiAge of human neonatal keratinocytes treated continuously with nAD, nR or metformin. The arrow and letter ‘S’ denote when untreated control cells became senescent. Representative of two experiments. g, Comparison of the effects of tested compounds on epigenetic aging and cellular population lifespan. h, Summary of the relationship between the hallmarks of aging and epigenetic aging.

References

    1. Horvath S. DNA methylation age of human tissues and cell types. Genome Biol. 14, R115 (2013). - PMC - PubMed
    1. Horvath S. & Raj K. DNA methylation-based biomarkers and the epigenetic clock theory of aging. Nat. Rev. Genet 19, 371–384 (2018). - PubMed
    1. Lopez-Otin C, Blasco MA, Partridge L, Serrano M. & Kroemer G. The hallmarks of aging. Cell 153, 1194–1217 (2013). - PMC - PubMed
    1. Horvath S. et al. Epigenetic clock for skin and blood cells applied to Hutchinson Gilford progeria syndrome and ex vivo studies.Aging 10, 1758–1775 (2018). - PMC - PubMed
    1. Hayflick L. & Moorhead PS The serial cultivation of human diploid cell strains. Exp. Cell. Res 25, 585–621 (1961). - PubMed

Publication types