

Dynamic changes in radiological parameters, immune cells, selected miRNAs, and cytokine levels in peripheral blood of patients with severe COVID‑19
- PMID: 37034572
- PMCID: PMC10074022
- DOI: 10.3892/br.2023.1615
Dynamic changes in radiological parameters, immune cells, selected miRNAs, and cytokine levels in peripheral blood of patients with severe COVID‑19
Abstract
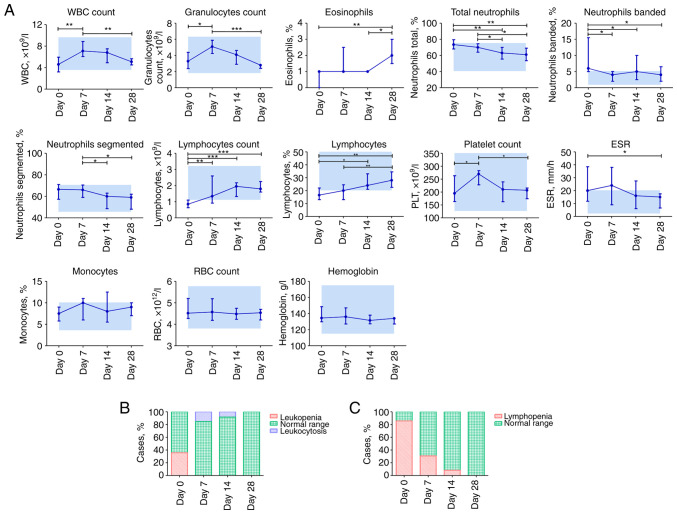
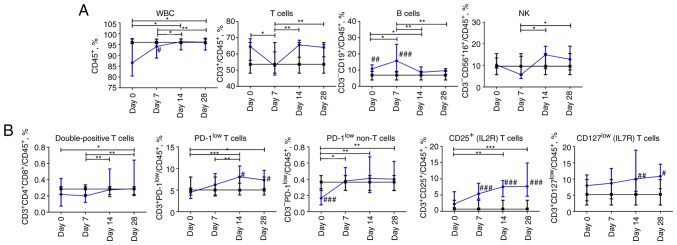
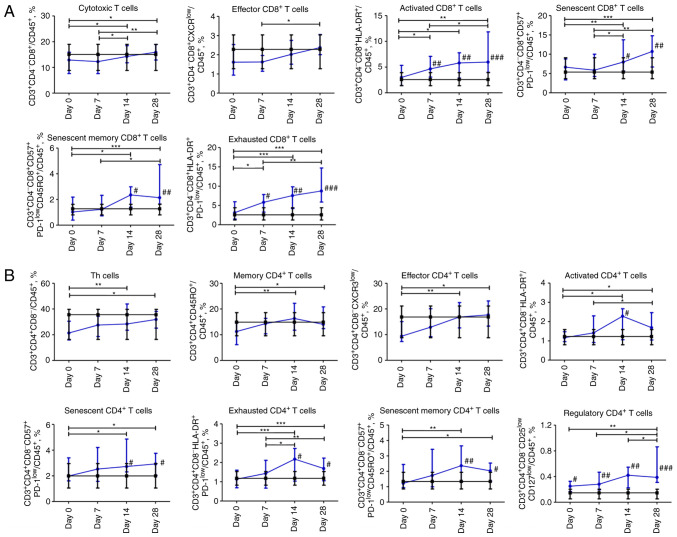
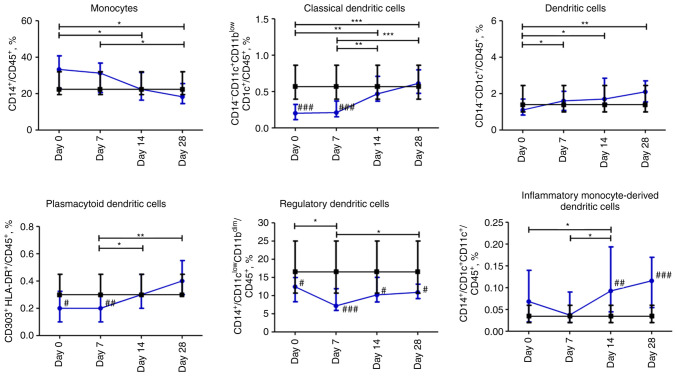
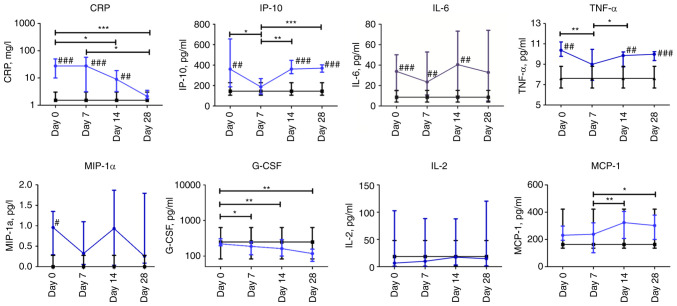
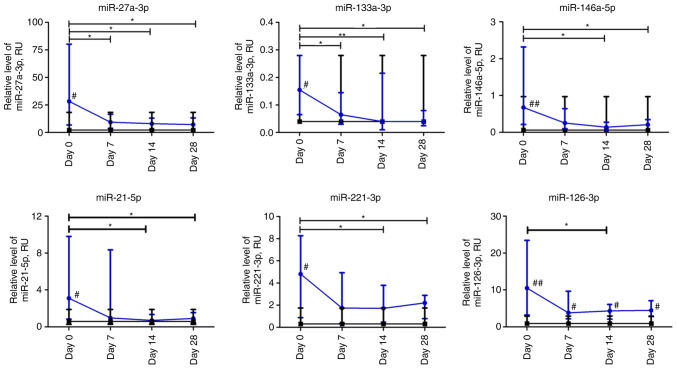
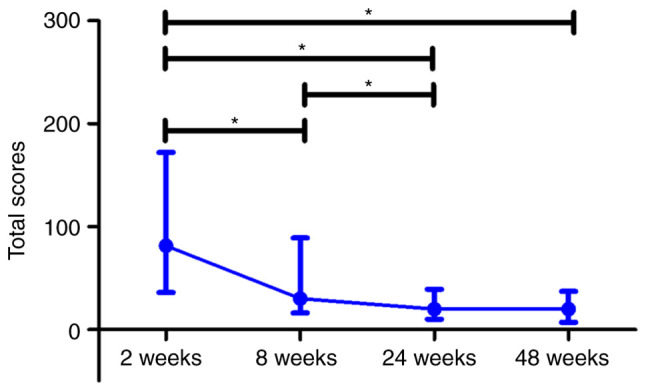
The present study aimed to investigate the dynamic changes in peripheral blood leucocyte subpopulations, cytokine and miRNA levels, and changes in computed tomography (CT) scores in patients with severe coronavirus disease 2019 (COVID-19) (n=14) and age-matched non-COVID-19 volunteers (n=17), which were included as a reference control group. All data were collected on the day of patient admission (day 0) and on the 7th, 14th and 28th days of follow-up while CT of the lungs was performed on weeks 2, 8, 24 and 48. On day 0, lymphopenia and leucopenia were detected in most patients with COVID-19, as well as an increase in the percentage of banded neutrophils, B cells, and CD4+ Treg cells, and a decrease in the content of PD-1low T cells, classical, plasmacytoid, and regulatory dendritic cells. On day 7, the percentage of T and natural killer cells decreased with a concurrent increase in B cells, but returned to the initial level after treatment discharge. The content of different T and dendritic cell subsets among CD45+ cells increased during two weeks and remained elevated, suggesting the activation of an adaptive immune response. The increase of PD-1-positive subpopulations of T and non-T cells and regulatory CD4 T cells in patients with COVID-19 during the observation period suggests the development of an inflammation control mechanism. The levels of interferon γ-induced protein 10 (IP-10), tumor necrosis factor-α (TNF-α) and interleukin (IL)-6 decreased on day 7, but increased again on days 14 and 28. C-reactive protein and granulocyte colony-stimulating factor (G-CSF) levels decreased gradually throughout the observation period. The relative expression levels of microRNA (miR)-21-5p, miR-221-3p, miR-27a-3p, miR-146a-5p, miR-133a-3p, and miR-126-3p were significantly higher at the beginning of hospitalization compared to non-COVID-19 volunteers. The plasma levels of all miRs, except for miR-126-3p, normalized within one week of treatment. At week 48, CT scores were most prominently correlated with the content of lymphocytes, senescent memory T cells, CD127+ T cells and CD57+ T cells, and increased concentrations of G-CSF, IP-10, and macrophage inflammatory protein-1α.
Keywords: CD4 T cells; CD8 T cells; COVID-19; chest CT; cytokine; dynamic changes; immune cell subpopulations; microRNA.
Copyright: © Bukreieva et al.
Conflict of interest statement
The authors declare that the research was conducted in the absence of any commercial or financial associations that could be construed as potential competing interests.
Figures
Similar articles
-
Treatment of Acute Respiratory Distress Syndrome Caused by COVID-19 with Human Umbilical Cord Mesenchymal Stem Cells.Int J Mol Sci. 2023 Feb 23;24(5):4435. doi: 10.3390/ijms24054435. Int J Mol Sci. 2023. PMID: 36901868 Free PMC article.
-
Disruption of CCR5 signaling to treat COVID-19-associated cytokine storm: Case series of four critically ill patients treated with leronlimab.J Transl Autoimmun. 2021;4:100083. doi: 10.1016/j.jtauto.2021.100083. Epub 2021 Jan 6. J Transl Autoimmun. 2021. PMID: 33521616 Free PMC article. Review.
-
Regulation of the MIR155 host gene in physiological and pathological processes.Gene. 2013 Dec 10;532(1):1-12. doi: 10.1016/j.gene.2012.12.009. Epub 2012 Dec 14. Gene. 2013. PMID: 23246696 Review.
-
Possible relation between expression of circulating microRNA and plasma cytokine levels in cases of pulmonary tuberculosis.J Infect Dev Ctries. 2022 Jul 28;16(7):1166-1173. doi: 10.3855/jidc.15831. J Infect Dev Ctries. 2022. PMID: 35905021
-
Lung exposure of titanium dioxide nanoparticles induces innate immune activation and long-lasting lymphocyte response in the Dark Agouti rat.J Immunotoxicol. 2011 Jun;8(2):111-21. doi: 10.3109/1547691X.2010.546382. Epub 2011 Feb 10. J Immunotoxicol. 2011. PMID: 21309687 Free PMC article.
References
-
- Rodriguez-Morales AJ, Cardona-Ospina JA, Gutiérrez-Ocampo E, Villamizar-Peña R, Holguin-Rivera Y, Escalera-Antezana JP, Alvarado-Arnez LE, Bonilla-Aldana DK, Franco-Paredes C, Henao-Martinez AF, et al. Clinical, laboratory and imaging features of COVID-19: A systematic review and meta-analysis. Travel Med Infect Dis. 2020;34(101623) doi: 10.1016/j.tmaid.2020.101623. - DOI - PMC - PubMed
LinkOut - more resources
Full Text Sources
Research Materials
Miscellaneous