[Preprint]. 2023 Mar 31:rs.3.rs-2724389.
doi: 10.21203/rs.3.rs-2724389/v1.

Transcription-replication interactions reveal principles of bacterial genome regulation

Affiliations

Transcription-replication interactions reveal principles of bacterial genome regulation

Andrew W Pountain et al. Res Sq. .

Update in

Abstract

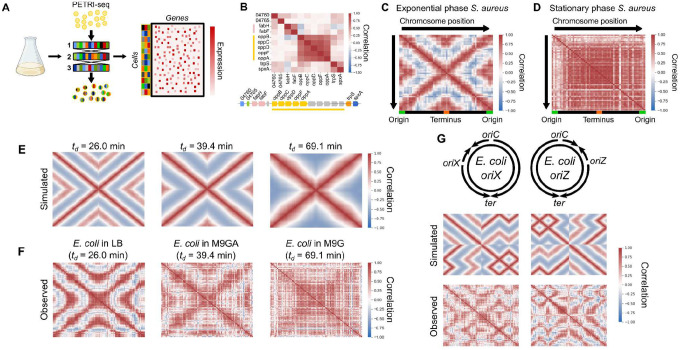
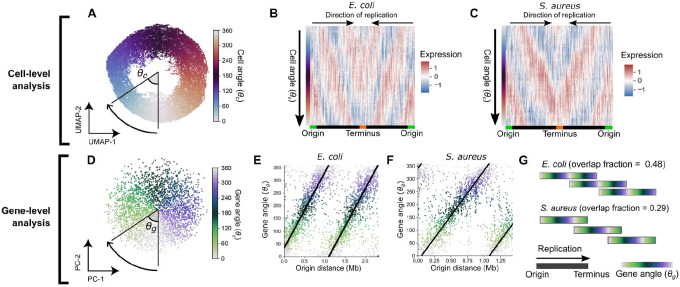
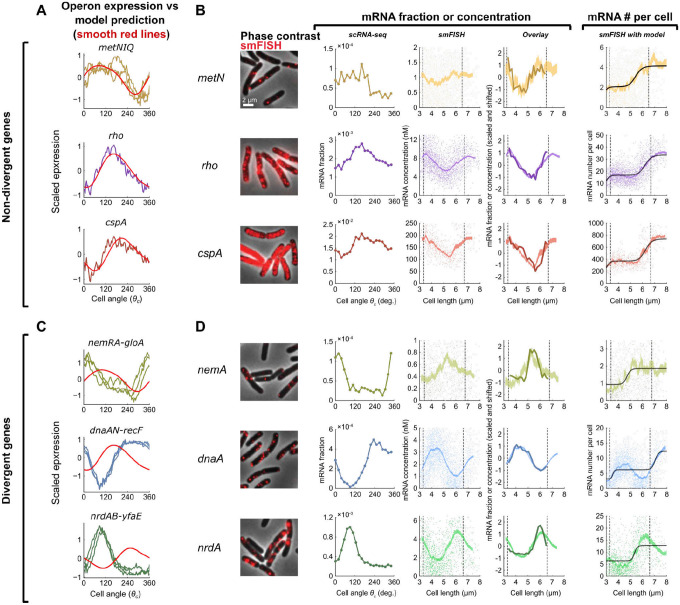
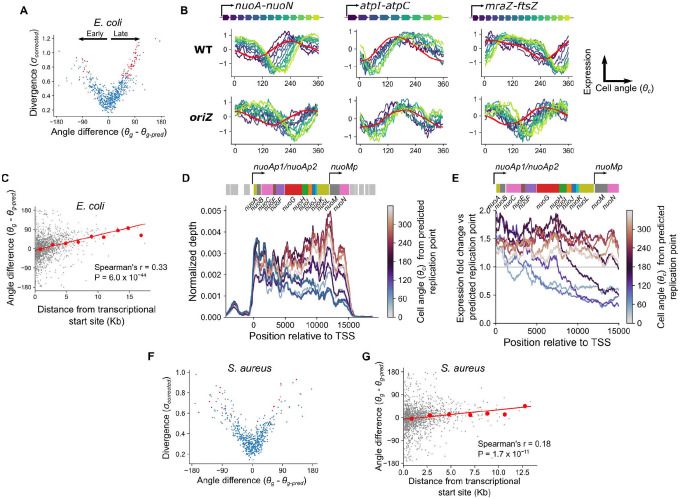
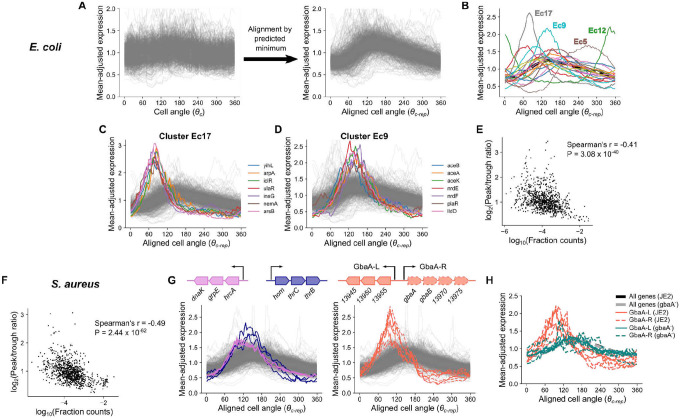
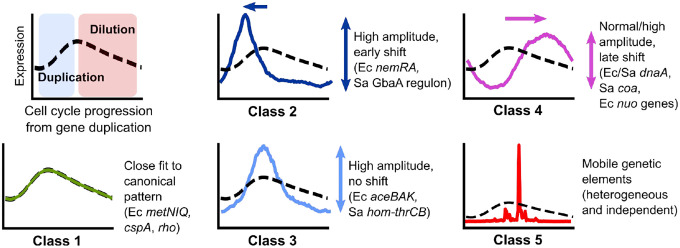
Organisms determine the transcription rates of thousands of genes through a few modes of regulation that recur across the genome1. These modes interact with a changing cellular environment to yield highly dynamic expression patterns2. In bacteria, the relationship between a gene's regulatory architecture and its expression is well understood for individual model gene circuits3,4. However, a broader perspective of these dynamics at the genome-scale is lacking, in part because bacterial transcriptomics have hitherto captured only a static snapshot of expression averaged across millions of cells5. As a result, the full diversity of gene expression dynamics and their relation to regulatory architecture remains unknown. Here we present a novel genome-wide classification of regulatory modes based on each gene's transcriptional response to its own replication, which we term the Transcription-Replication Interaction Profile (TRIP). We found that the response to the universal perturbation of chromosomal replication integrates biological regulatory factors with biophysical molecular events on the chromosome to reveal a gene's local regulatory context. While the TRIPs of many genes conform to a gene dosage-dependent pattern, others diverge in distinct ways, including altered timing or amplitude of expression, and this is shaped by factors such as intra-operon position, repression state, or presence on mobile genetic elements. Our transcriptome analysis also simultaneously captures global properties, such as the rates of replication and transcription, as well as the nestedness of replication patterns. This work challenges previous notions of the drivers of expression heterogeneity within a population of cells, and unearths a previously unseen world of gene transcription dynamics.


Conflict of interest statement

Competing interests: The authors declare no competing interests.

Figures

Figure 1:
Figure 1:. scRNA-seq reveals a global pattern of replication-associated gene covariance.
A) PETRI-seq workflow. Bacterial cells were fixed and permeabilized, then subjected to three rounds of cDNA barcoding to give transcripts of each cell a unique barcode combination. This method is highly scalable to multiple samples and tens of thousands of cells. B) Local operon structure is captured by gene-gene correlations (Spearman’s r). Operons are indicated by shared colors of genes. Gray genes indicate those removed by low-count filtering. Names of SAUSA300_RS04760 and SAUSA300_RS04765 are truncated. C & D) Global gene-gene correlations reflect chromosomal position in (C) exponential phase and (D) stationary phase S. aureus. Spearman correlations were calculated based on scVI-smoothed expression averaged in 50 kb bins by chromosome position. E) Simulated correlation patterns in unsynchronized E. coli populations at three different growth rates. F) Spearman correlations between scaled data averaged into 50 kb bins, as for (C) but for E. coli grown at three growth rates. G) Introducing ectopic origins of replication in E. coli leads to predictable perturbations in gene expression heterogeneity. Top: schematic of predicted replication patterns based on previous studies. Middle: Predicted correlation patterns based on the copy number simulation. Bottom: Real correlation patterns in oriX and oriZ mutant strains, as in (C). Heatmaps of correlations without chromosome position-dependent binning are shown in Fig. S2D.
Figure 2:
Figure 2:. Ordering expression by cell angle and gene angle provides a quantitative description of cell cycle gene expression.
A) UMAP of LB-grown E. coli with expression averaged in 100 kb bins by chromosome position. Cell angle θc is the angle between UMAP dimensions relative to the center. For UMAP without averaging, see Fig. S7A. B & C) Heatmap of scaled gene expression in E. coli (B) or S. aureus (C) averaged in 100 bins by θc. D) Derivation of gene angle θg in LB-grown E. coli. Principal component analysis was performed on the transpose of the matrix in (B), and θg was defined as the angle between principal components (PCs) 1 and 2. Genes form a wheel in UMAP (Fig. S7C). E & F) The relationship between θg and origin distance for E. coli grown in LB (E) and S. aureus grown in TSB (F). G) Predicted replication patterns in LB-grown E. coli (td = 26.0 ± 1.3 min) and S. aureus (td = 24.9 ± 0.6 min). Overlapping rounds of replication lead to shared θg in simultaneously-replicated chromosomal regions. Note that greater overlap in replication rounds is observed for E. coli than for S. aureus.
Figure 3:
Figure 3:. Genes show a spectrum of divergence from a dosage-driven consensus pattern.
A) Expression of genes in operons that conform to the consensus pattern across 100 bins averaged by θc. Expression is z-scores derived from scVI (jagged lines) or predicted as a replication effect (smooth, red lines). B) Comparison of scRNA-seq and smFISH data for genes within non-divergent operons. From left to right: 1) Microscopy images of E. coli cells labeled using smFISH against the indicated gene (cspA is visualized with alternative contrast; for negative control see Fig. S10A); 2) scRNA-seq expression shown as fraction of total cellular mRNA (expression is averaged in 100 bins by θc); 3) mRNA concentration, measured using smFISH, as a function of cell length. Single-cell data (scatter plot) was binned by cell length (shaded curve, moving average ± SEM, 10% sample size per bin). Dashed lines indicate the twofold length range where most cells reside, used to infer the mean values at birth and division; 4) Alignment of scaled data from smFISH and scRNA-seq measurements; 5) Absolute mRNA copy number, measured using smFISH, as a function of cell length. Single-cell data was processed as in column 3 (5% sample size per bin). Black line, fit to a sum of two Hill functions, corresponding to two gene replication rounds. C) Expression of divergent genes compared to model predictions (as in (A)). D) Comparison of scRNA-seq and smFISH as in (B) but for divergent genes. See Material and Methods for further details.
Figure 4:
Figure 4:. A gene’s position within its operon produces a characteristic delay in expression dynamics in E. coli but not S. aureus.
A) Plot of divergence from predictions against the difference between predicted and observed angles in E. coli, with divergent genes in red. Angle difference therefore represents whether a gene is expressed earlier or later than expected, as indicated by the black arrows. B) Cell cycle expression plots for operons showing “delayed” genes as in Fig. 3A & C but colored by position within the operon. Model-predicted expression is represented in red. Shown for WT and the oriZ mutant. C) Plot of maximum distance from a transcriptional start site against difference between predicted and observed angles in E. coli. Red line indicates the linear model fit and red points indicate averages of 2 kb bins. D) Normalized per-base read depth at the nuo operon locus for cells averaged in 10 bins by cell angle, θc. Traces are smoothed by a 1 kb centered rolling mean and colored by mean cell angle relative to the predicted timing of gene replication (see Materials & Methods). The nuo operon structure is indicated by the schematic above, with the surrounding genes in grey. E) Per-base read depth as shown in (D) for the nuo operon, but with expression shown as fold-change relative to expression at the predicted time of gene replication. F) Plot of divergence from predictions against the difference between predicted and observed angles, as in (A) but for S. aureus. G) Plot of maximum distance from a transcriptional start site against difference between predicted and observed angles, as in (B) but for S. aureus.
Figure 5:
Figure 5:. Repression is associated with higher amplitude in cell cycle gene expression.
A) Procedure to align expression profiles of different genes. Smoothed expression for each gene normalized by division by its mean (left) is standardized by rotating cell angle so the predicted replication time expression is at zero. We term this aligned cell angle progression metric θc-rep. See Materials & Methods. B) Average aligned expression profiles for 20 k-means clusters in E. coli. The dotted black line represents average expression across all reproducible genes. C & D) Plots of individual genes from clusters in (B). E & F) Comparison of average expression to the log-ratio of peak to trough expression in E. coli (E) and S. aureus (F). G) Aligned expression profiles for select operons in clusters Sa11 and Sa18, with operon structure shown. H) Aligned expression profiles for GbaA regulon genes in JE2 and a gbaA transposon mutant. Thick black and gray lines represent average expression across all reproducible genes.
Figure 6:
Figure 6:. Classes of Transcription-Replication Interaction Profiles of non-divergent and divergent genes.
Top left: Canonical TRIP driven by gene dosage. Other panels: Archetypal patterns of TRIPs that do not (Class 1) or do (Classes 2–5) diverge from this pattern. Genes in E. coli and S. aureus are represented as Ec and Sa, respectively.

References

    1. Bervoets I. & Charlier D. Diversity, versatility and complexity of bacterial gene regulation mechanisms: opportunities and drawbacks for applications in synthetic biology. FEMS Microbiol. Rev. 43, 304–339 (2019). - PMC - PubMed
    1. Sanchez A. & Golding I. Genetic determinants and cellular constraints in noisy gene expression. Science 342, 1188–1193 (2013). - PMC - PubMed
    1. Vilar J. M. G., Guet C. C. & Leibler S. Modeling network dynamics: the lac operon, a case study. J. Cell Biol. 161, 471–476 (2003). - PMC - PubMed
    1. Narula J., Devi S. N., Fujita M. & Igoshin O. A. Ultrasensitivity of the Bacillus subtilis sporulation decision. Proc. Natl. Acad. Sci. U. S. A. 109, E3513–22 (2012). - PMC - PubMed
    1. Homberger C., Hayward R. J., Barquist L. & Vogel J. Improved bacterial single-cell RNA-seq through automated MATQ-seq and Cas9-based removal of rRNA reads. Preprint at 10.1101/2022.11.28.518171. - DOI - PMC - PubMed

Publication types