[Preprint]. 2025 Jan 13:2023.03.27.534444.
doi: 10.1101/2023.03.27.534444.

Proteostasis and lysosomal repair deficits in transdifferentiated neurons of Alzheimer's disease

Affiliations

Proteostasis and lysosomal repair deficits in transdifferentiated neurons of Alzheimer's disease

Ching-Chieh Chou et al. bioRxiv. .

Update in

Abstract

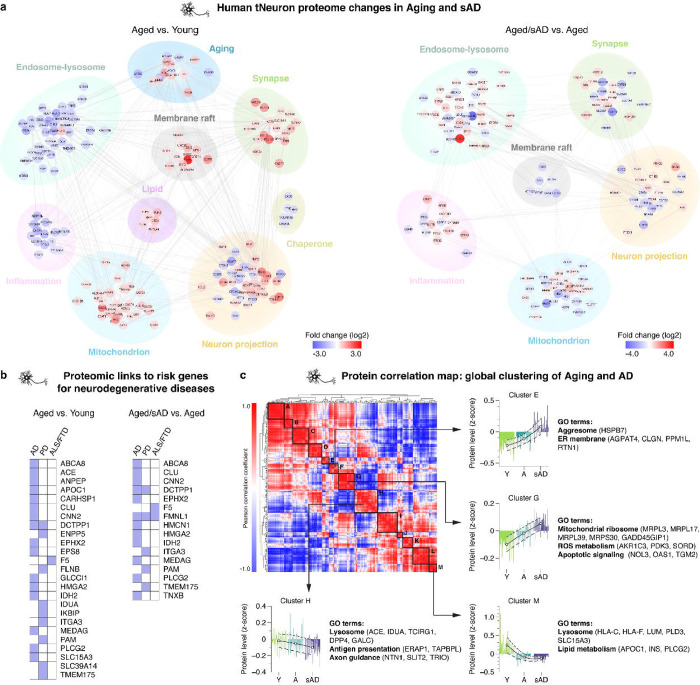
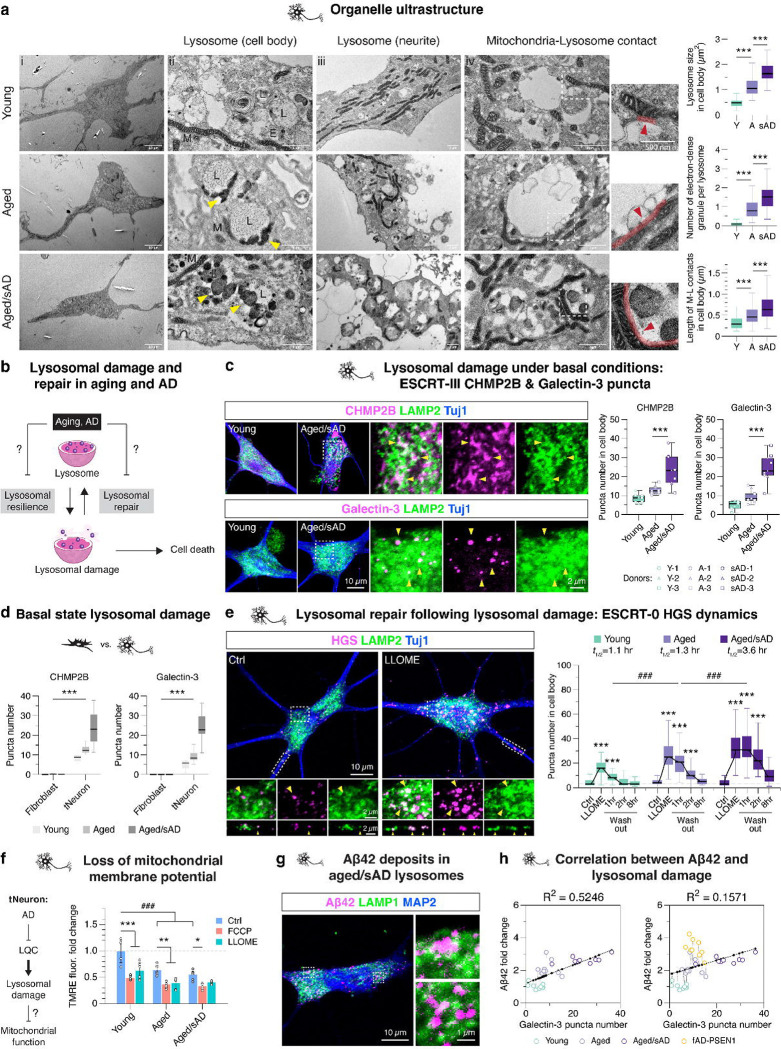
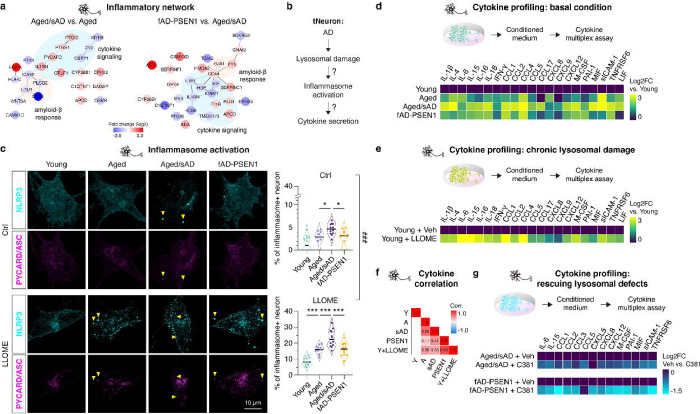
Aging is the most prominent risk factor for Alzheimer's disease (AD). However, the cellular mechanisms linking neuronal proteostasis decline to the characteristic aberrant protein deposits in AD brains remain elusive. Here, we develop transdifferentiated neurons (tNeurons) from human dermal fibroblasts as a neuronal model that retains aging hallmarks and exhibits AD-linked vulnerabilities. Remarkably, AD tNeurons accumulate proteotoxic deposits, including phospho-Tau and Aβ, resembling those in AD patient and APP mouse brains. Quantitative tNeuron proteomics identify aging and AD-linked deficits in proteostasis and organelle homeostasis, most notably in endosome-lysosomal components. Lysosomal deficits in aged tNeurons, including constitutive lysosomal damage and ESCRT-mediated lysosomal repair defects, are exacerbated in AD tNeurons and linked to inflammatory cytokine secretion and cell death. Supporting lysosomal deficits' centrality in AD, compounds ameliorating lysosomal function reduce Aβ deposits and cytokine secretion. Thus, the tNeuron model system reveals impaired lysosomal homeostasis as an early event of aging and AD.


Conflict of interest statement

Competing interests: R.V., J.L. and T.W.-C. are co-founders of Qinotto Inc. Other authors declare no competing interests.

Figures

Fig. 1
Fig. 1. Transdifferentiating human adult fibroblasts into neurons reveals signatures of aging and Alzheimer’s disease (AD).
(a) Human dermal fibroblasts are collected from donors of healthy young and aged, aged with sporadic AD (aged/sAD) and familial AD with PSEN1 mutations (fAD-PSEN1). Fibroblasts and the transdifferentiated neurons (tNeurons) are used for a variety of experiments and the findings are validated in post-mortem brain tissue and cerebrospinal fluid (CSF). (b) Levels of DNA damage measured by numbers of the nuclear foci of γ-H2AX immunofluorescence (IF) in human fibroblasts. n = 248 (young), 304 (aged) and 252 (aged/sAD) cells from three donors and three independent experiments. Scale bar: 50 μm. (c) Age- and AD-related epigenetic alterations measured by histone modifications H3K9me3 and H4K16ac IF in human fibroblasts. H3K9me3: n = 252 (young), 241 (aged) and 237 (aged/sAD) cells from four donors and three independent experiments; H4K16ac: n = 157 (young), 167 (aged) and 141 (aged/sAD) cells from four donors and three independent experiments. (d) Representative images of human fibroblasts immunostained for S100A4 and Vimentin, and tNeurons immunostained for Tuj1, GAP43, MAP2 and NeuN with DAPI counterstaining at post-induction day (PID) 35. Scale bar: 100 μm. (e) IF quantification of DNA damage in tNeurons revealed by γ-H2AX. n = 150 (young), 132 (aged) and 141 (aged/sAD) cells from three donors and three independent experiments. (f) IF quantification of H3K9me3 and H4K16ac changes in tNeurons. H3K9me3: n = 95 (young), 123 (aged) and 124 (aged/sAD) cells from three donors and three independent experiments; H4K16ac: n = 112 (young), 115 (aged) and 117 (aged/sAD) cells from three donors and three independent experiments. (g) Representative images of proteostasis- and disease-associated protein markers in tNeurons, including autophagy adaptor p62/SQSTM1, ubiquitin, Aβ42, hyper-phosphorylated tau (pTau) and TDP-43. Cyan dash line outlines tNeuron morphology determined by Tuj1 staining. White dash line represents the nuclear region (N). Scale bar: 20 μm. In panel c and f, the boxes show median and 1st and 3rd quartile and the whiskers extending 1.5 times the interquartile range from the boxes. Statistical analysis is performed using One-Way ANOVA followed by Bonferroni post-hoc analysis. **P < 0.01 and ***P < 0.001. Source numerical data are available in Source data.
Fig. 2
Fig. 2. Human tNeurons carry proteomic signatures of aging and AD.
(a) Differential expression of proteins detected in tNeurons from healthy young (n = 3) and aged (n = 3) individuals, and patients with aged/sAD (n = 6) at PID 40. The top pathways for aging and sAD proteomes are analyzed using gene ontology (GO) databases. Comparison is performed between tNeurons from aged and young donors, and between aged/sAD and aged donors. Colored circles represent the enrichment of identified proteins revealing by log2-fold change: increase in red and decrease in blue. (b) List of differentially expressed proteins associated with risk genes for age-related neurodegenerative diseases. AD: Alzheimer’s disease. PD: Parkinson’s disease. ALS/FTD: Amyotrophic lateral sclerosis/Frontotemporal dementia. (c) Clustering heatmap of Pearson correlation coefficients of total tNeuron protein expression. Cluster A to M show distinct protein expression patterns and the associated GO terms between young, age and aged/sAD. Each line represents the expression of individual protein defined by the relative protein abundance (z-score) across different groups. White circles represent the average z-score for each cluster. Dash lines represent ±SD.
Fig. 3
Fig. 3. Constitutive lysosomal damage and lysosomal repair deficits in AD tNeurons.
(a) Transmission electron microscopy (TEM) for analyzing organelle ultrastructure in human tNeurons. E: endosome; L: lysosome; M: mitochondria. Yellow arrowhead: electron-dense granules. Red arrowhead and line: mitochondria-lysosome contact site. Insert: higher magnification view of mitochondria-lysosome contact. Lysosome size: n = 59 (young), 69 (aged) and 69 (aged/sAD) lysosomes; electron-dense material abundance: n = 74 (young), 68 (aged) and 60 (aged/sAD) lysosomes; mitochondria-lysosome contacts: n = 174 (young), 262 (aged) and 246 (aged/sAD) contacts from two donors and two independent experiments. Scale bar (i): 20 μm. Scale bar (ii-iv): 1 μm. (b) Testing how aging and AD alters lysosomal damage responses, leading to cell death. (c) Representative images of tNeurons immunostained for LAMP2 (green), ESCRT-III CHMP2B and Galectin-3 (magenta) and Tuj1 (blue) at PID 35 at basal conditions (scale bar: 10 μm). IF quantification of numbers of CHMP2B and Galectin-3 puncta in the cell body of tNeurons. CHMP2B: n = 117 (young), 103 (aged) and 97 (aged/sAD) cells; Galectin-3: n = 111 (young), 108 (aged) and 95 (aged/sAD) cells from three donors and three independent experiments. Insert: higher magnification view of protein colocalization (scale bar: 2 μm). Arrowhead: CHMP2B and Galectin-3 colocalization with LAMP2. (d) Comparison of numbers of CHMP2B and Galectin-3 puncta between fibroblasts and tNeurons at basal conditions. Fibroblasts: CHMP2B: n = 102 (young), 105 (aged) and 99 (aged/sAD) cells; Galectin-3: n = 102 (young), 105 (aged) and 99 (aged/sAD) cells. tNeurons: CHMP2B: n = 117 (young), 103 (aged) and 97 (aged/sAD) cells; Galectin-3: n = 111 (young), 108 (aged) and 95 (aged/sAD) cells. All data are acquired from three donors and three independent experiments. (e) Representative images of AD tNeurons immunostained for LAMP2 (green), ESCRT-0 HGS protein (magenta) and Tuj1 (blue) at PID 36 (scale bar: 10 μm). Cells are treated with L-leucyl-L-leucine O-methyl ester (LLOME) at 0.25 mM for 30 min, and then washed out of LLOME for lysosomal repair. IF quantification of numbers of HGS puncta in the cell body. The half-life (t1/2) represents the time required for lysosomal repair. Young: n = 108 (Ctrl), 107 (LLOME), 111 (Washout 1 hr), 118 (Washout 2 hr) and 90 (Washout 8 hr) cells; Aged: n = 110 (Ctrl), 113 (LLOME), 114 (Washout 1 hr), 116 (Washout 2 hr) and 109 (Washout 8 hr) cells; Aged/sAD: n = 115 (Ctrl), 115 (LLOME), 117 (Washout 1 hr), 109 (Washout 2 hr) and 79 (Washout 8 hr) cells from three donors and three independent experiments. Insert: higher magnification view of HGS and LAMP2 in the cell body and neurites (scale bar: 2 μm). Arrowhead: HGS colocalization with LAMP2. (f) Testing if defective LQC mediates mitochondrial dysfunction in aging and AD. Quantification of mitochondrial membrane potential using TMRE staining after the treatment of DMSO Ctrl, 20 μM FCCP or 0.25 mM LLOME for 30 min. The values are revealed by a fold change relative to young tNeurons treated with DMSO. n = 6 (young), 6 (aged) and 6 (aged/sAD) independent replicates from three donors and two experiments. (g) IF analysis of colocalization of Aβ42 with LAMP1 in aged/sAD tNeurons (scale bar: 10 μm). Insert: higher magnification view of Aβ42 and LAMP1 (scale bar: 1 μm). (h) Analysis of correlation between intra-cellular Aβ42 levels and Galectin-3 puncta numbers in different groups of tNeurons. n = 9 independent replicates from three donors and three experiments. Black solid line represents the fitted linear correlation. Coefficient of Discrimination (R2) is calculated using Pearson’s correlation. In panel a, c, d, and e, the boxes show median and 1st and 3rd quartile and the whiskers extending 1.5 times the interquartile range from the boxes. In panel f, data are displayed as mean ± SD. Statistical analysis is performed using One-Way ANOVA (a, and c) or Two-Way ANOVA (d, e and f) followed by Bonferroni post-hoc analysis. *P < 0.05, **P < 0.01 and ***P < 0.001. ###P < 0.001. Source numerical data are available in Source data.
Fig. 4
Fig. 4. Lysosomal damage is linked to amyloid accumulation in post-mortem brain tissue.
(a) Schematic for describing an experimental pipeline to test if the disease phenotypes observed in AD tNeurons are also detected in brain tissue of AD patients and transgenic mice expressing mutant human APP with the Swedish (K670N/M671L) and London (V717I) mutations (APPLon/Swe) for modeling AD. HC: healthy control. (b) IF staining of CHMP2B, Aβ42 and LAMP1 in the neocortex of non-transgenic mice (NTg) and APPLon/Swe transgenic mice (scale bar: 10 μm). The brain tissue is co-stained with MAP2. Insert: higher magnification view of colocalization between CHMP2B, Aβ42, LAMP1 within individual neurons (scale bar: 10 μm). Arrowhead: intra-neuronal colocalization of CHPM2B and Aβ42 with LAMP1. (c) IF quantification of CHMP2B, Aβ(6E10) and LAMP2 in the cerebral cortex of HC and AD donors (scale bar: 20 μm). The brain tissue is co-stained with MAP2 and Hoechst. Insert: higher magnification view of CHMP2B and Aβ(6E10) colocalization with LAMP2 (scale bar: 10 μm). Arrowhead: CHMP2B-positive fibril structures.
Fig. 5
Fig. 5. Lysosomal damage mediates inflammatory responses in AD tNeurons.
(a) Interaction network for proteins involved in the inflammatory response pathway in tNeurons. The relative abundance indicated by log2-fold change (Log2FC): increase in red and decrease in blue. (b) Testing if lysosomal damage links to inflammasome activation and cytokine secretion in AD neurons. (c) Representative images of tNeurons immunostained for inflammasome markers NLRP3 (cyan) and PYCARD/ASC (magenta) with or without 0.25 mM LLOME treatment for 3 hr at PID 40. IF quantification of the percentage of tNeurons showing inflammasomes per image. n = 441 to 477 (young), 399 to 513 (aged) and 522 to 648 (aged/sAD) cells from four donors and three independent experiments. Data are displayed as violin plot indicating median. Arrowhead: colocalization of NLRP3 and PYCARD/ASC. Scale bar: 10 μm. (d) Inflammatory profiling of the conditioned medium from all groups of tNeurons at basal conditions at PID 40. Heatmap represents Log2FC in cytokine and chemokine levels relative to young tNeurons. n = 6 (young), 6 (aged), 12 (aged/sAD) and 4 (fAD-PSEN1) independent replicates from two experiments. (e) Inflammatory profile of the conditioned medium from young tNeurons treated with or without chronic lysosomal damage stress (0.1 mM LLOME starting at PID 33 for 7 days). Log2FC is relative to DMSO (vehicle). n = 6 (young + vehicle and 8 (young + LLOME) independent replicates from two experiments. (f) Heatmap and Pearson correlation analysis for identified cytokines and chemokines. (g) Inflammatory profiling of the conditioned medium from aged/sAD and fAD-PSEN1 tNeurons at PID 35 treated with or without 3.1 μM C381 for 7 days. Log2FC is relative to DMSO (vehicle). n = 4 (aged/sAD: vehicle, C381) and 4 (fAD-PSEN1: vehicle, C381) independent replicates from two experiments. Log2-fold change in mean fluorescence intensity (MFI) is used for comparison. Statistical analysis is performed using two-sided Student’s t-test (g) or One-Way ANOVA (d, and e) or Two-Way ANOVA (c) followed by Bonferroni post-hoc analysis. *P < 0.05 and ***P < 0.001. Source numerical data are available in Source data.
Fig. 6
Fig. 6. Pharmacological improvement of lysosomal resilience to damage ameliorates AD phenotypes in tNeurons.
(a) Testing if rescuing LQC provides neuroprotective effects in AD tNeurons. (b) Concurrent change of CHMP2B and Galectin-3 puncta number by 0.25 mM LLOME treatment for 30 min at PID 35 following the pre-treatment with DMSO Ctrl or 3.1 μM C381 for 7 days. Ctrl: n = 103 (aged), 95 (aged/sAD) and 104 (fAD-PSEN1); C381: n = 88 (aged), 95 (aged/sAD) and 91 (fAD-PSEN1) cells from three donors and three independent experiments. Each dot represents the number of detectable CHMP2B (x-axis) and Galectin-3 (y-axis) puncta in individual neuron. (c) Measurement of changes in Cathepsin-B activity caused by 0.25 mM LLOME treatment for 30 min at PID 35 following the pre-treatment with 3.1 μM C381 for 7 days. Young: n = 145 (Ctrl), 142 (LLOME) and 147 (LLOME+C381) cells; Aged: n = 157 (Ctrl), 156 (LLOME) and 122 (LLOME+C381) cells; Aged/sAD: n = 157 (Ctrl), 152 (LLOME) and 155 (LLOME+C381) cells; fAD-PSEN1: n = 142 (Ctrl), 142 (LLOME) and 141 (LLOME+C381) cells from three donors and three independent experiments. (d) Measurement of Caspase-3/7 activation after 0.5 mM LLOME treatment for 1 hr at PID 42. Pre-treatment of 3.1 μM C381 at PID 35 is continued for 7 days. Young: n = 162 (Ctrl), 142 (LLOME) and 105 (LLOME+C381) cells; Aged: n = 158 (Ctrl), 146 (LLOME) and 133 (LLOME+C381) cells; Aged/sAD: n = 148 (Ctrl), 167 (LLOME) and 142 (LLOME+C381) cells; fAD-PSEN1: n = 136 (Ctrl), 147 (LLOME) and 148 (LLOME+C381) cells from three donors and three independent experiments. (e) Schematic for small molecules that modulate lysosomal function and damage. Small molecules with beneficial effects labelled with blue color, whereas with detrimental effects labelled with black color. (f) Effects of small molecules (LLOME: 0.25 mM, BAPTA-AM: 2.5 μM, C381: 3.1 μM, Thioperamide: 5 μM and NCT-504: 2.5 μM for 2-day treatment) on intra-neuronal Aβ42 levels in aged, aged/sAD and fAD-PSEN1 tNeurons. Representative images of aged/sAD tNeurons immunostained for Aβ42 (magenta) and Tuj1 (green) at PID 35 (scale bar: 50 μm). IF quantification of fold-changes in Aβ42 levels during small molecule treatment relative to DMSO Ctrl. n = 104 to 122 (aged), 88 to 144 (aged/sAD) and 61 to 136 (fAD-PSEN1) cells from three donors and three independent experiments. Insert: higher magnification view of Aβ42 within individual neuron (scale bar: 10 μm). (g) We propose that in AD, either as a result of stochastic events or mutational burdens, lysosomal repair defects are exacerbated, leading to overwhelmed LQC machineries and sustained presence of damaged lysosomes. Restoring lysosomal homeostasis and damage ameliorate AD pathologies in neurons. In panel c, d, and f, the boxes show median and 1st and 3rd quartile and the whiskers extending 1.5 times the interquartile range from the boxes. Statistical analysis is performed using two-sided Student’s t-test (b) or One-Way ANOVA (c, d, and f) followed by Bonferroni post-hoc analysis. **P < 0.01 and ***P < 0.001. Source numerical data are available in Source data.

References

References (Main)

    1. Balch W.E., Morimoto R.I., Dillin A. & Kelly J.W. Adapting proteostasis for disease intervention. Science (New York, N.Y.) 319, 916–919 (2008). - PubMed
    1. Kaushik S. & Cuervo A.M. Proteostasis and aging. Nature medicine 21, 1406–1415 (2015). - PubMed
    1. Hughes A.L. & Gottschling D.E. An early age increase in vacuolar pH limits mitochondrial function and lifespan in yeast. Nature 492, 261–265 (2012). - PMC - PubMed
    1. Gottschling D.E. & Nyström T. The Upsides and Downsides of Organelle Interconnectivity. Cell 169, 24–34 (2017). - PMC - PubMed
    1. Lapierre L.R., Kumsta C., Sandri M., Ballabio A. & Hansen M. Transcriptional and epigenetic regulation of autophagy in aging. Autophagy 11, 867–880 (2015). - PMC - PubMed

References (Methods)

    1. Tanabe K. et al. Transdifferentiation of human adult peripheral blood T cells into neurons. Proceedings of the National Academy of Sciences of the United States of America (2018). - PMC - PubMed
    1. Rockenstein E., Mallory M., Mante M., Sisk A. & Masliaha E. Early formation of mature amyloid-beta protein deposits in a mutant APP transgenic model depends on levels of Abeta(1–42). Journal of neuroscience research 66, 573–582 (2001). - PubMed
    1. Nguyen A.T. et al. UBE2O remodels the proteome during terminal erythroid differentiation. Science (New York, N.Y.) 357 (2017). - PMC - PubMed
    1. Cao C. et al. Maternal Iron Deficiency Modulates Placental Transcriptome and Proteome in Mid-Gestation of Mouse Pregnancy. The Journal of nutrition 151, 1073–1083 (2021). - PMC - PubMed
    1. Liu X., Li J., Gygi S.P. & Paulo J.A. Profiling Yeast Deletion Strains Using Sample Multiplexing and Network-Based Analyses. Journal of proteome research 21, 1525–1536 (2022). - PMC - PubMed

Publication types

LinkOut - more resources