[Preprint]. 2023 Apr 1:2023.03.29.534769.
doi: 10.1101/2023.03.29.534769.

Distinct mesenchymal cell states mediate prostate cancer progression

Affiliations

Distinct mesenchymal cell states mediate prostate cancer progression

Hubert Pakula et al. bioRxiv. .

Update in

  • Distinct mesenchymal cell states mediate prostate cancer progression.
    Pakula H, Omar M, Carelli R, Pederzoli F, Fanelli GN, Pannellini T, Socciarelli F, Van Emmenis L, Rodrigues S, Fidalgo-Ribeiro C, Nuzzo PV, Brady NJ, Dinalankara W, Jere M, Valencia I, Saladino C, Stone J, Unkenholz C, Garner R, Alexanderani MK, Khani F, de Almeida FN, Abate-Shen C, Greenblatt MB, Rickman DS, Barbieri CE, Robinson BD, Marchionni L, Loda M. Pakula H, et al. Nat Commun. 2024 Jan 8;15(1):363. doi: 10.1038/s41467-023-44210-1. Nat Commun. 2024. PMID: 38191471 Free PMC article.

Abstract

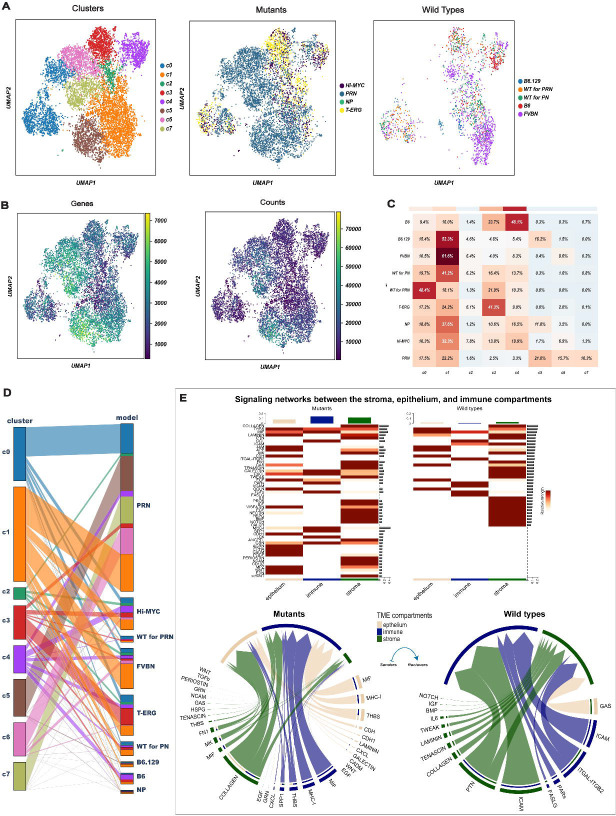
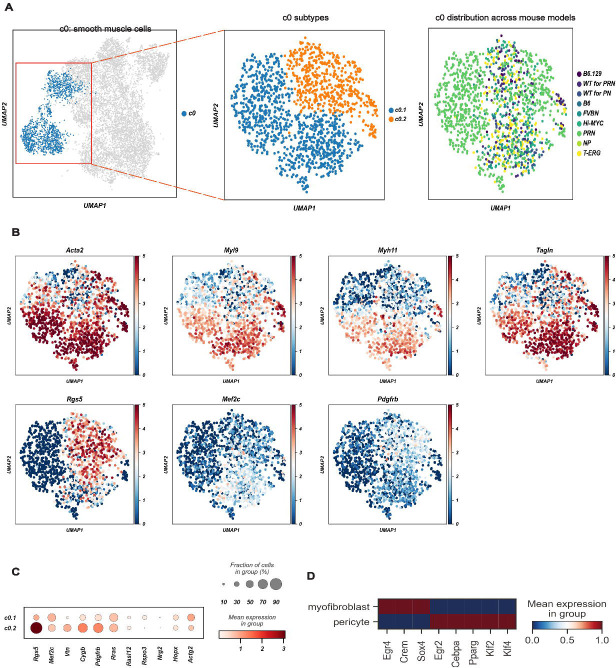
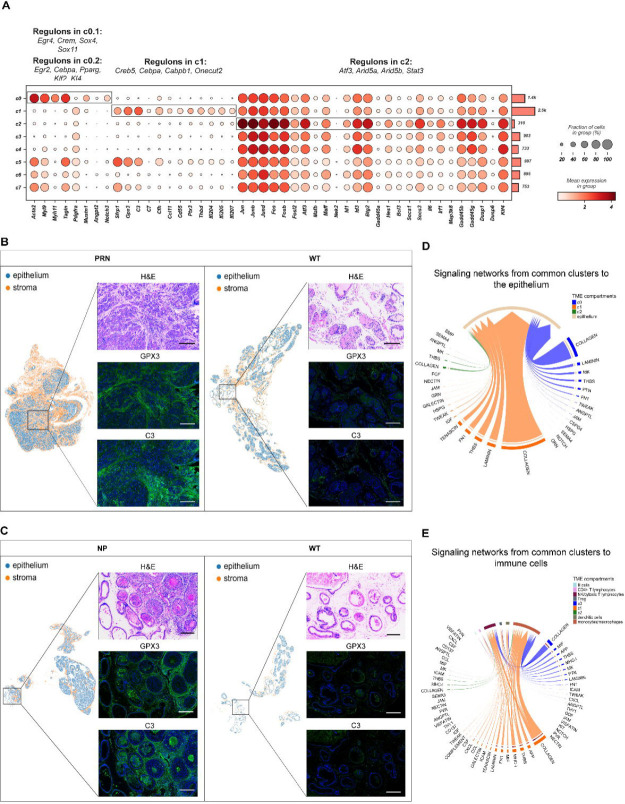
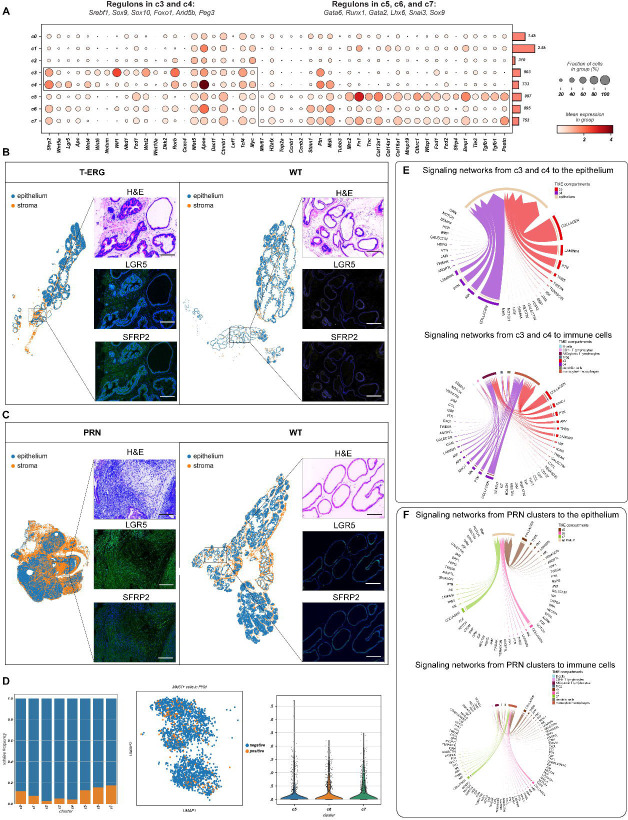
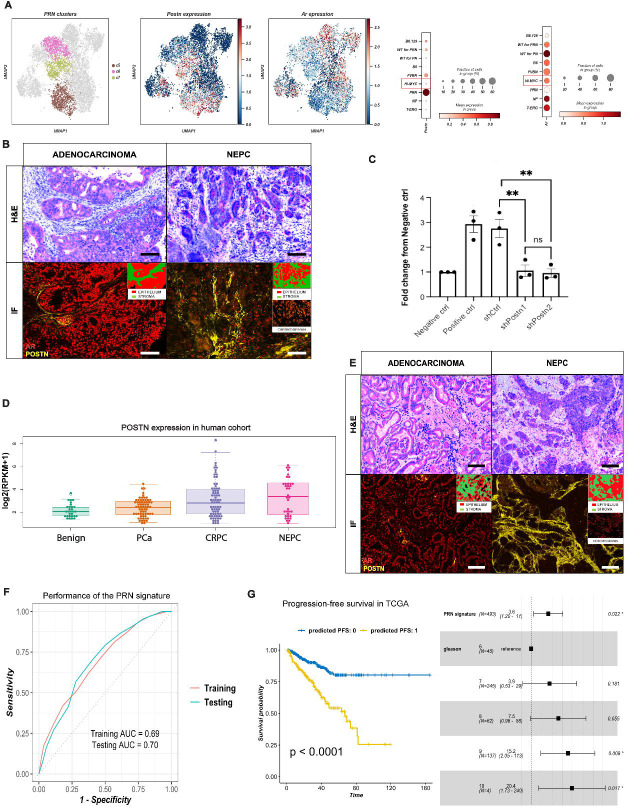
Alterations in tumor stroma influence prostate cancer progression and metastatic potential. However, the molecular underpinnings of this stromal-epithelial crosstalk are largely unknown. Here, we compare mesenchymal cells from four genetically engineered mouse models (GEMMs) of prostate cancer representing different stages of the disease to their wild-type (WT) counterparts by single-cell RNA sequencing (scRNA-seq) and, ultimately, to human tumors with comparable genotypes. We identified 8 transcriptionally and functionally distinct stromal populations responsible for common and GEMM-specific transcriptional programs. We show that stromal responses are conserved in mouse models and human prostate cancers with the same genomic alterations. We noted striking similarities between the transcriptional profiles of the stroma of murine models of advanced disease and those of of human prostate cancer bone metastases. These profiles were then used to build a robust gene signature that can predict metastatic progression in prostate cancer patients with localized disease and is also associated with progression-free survival independent of Gleason score. Taken together, this offers new evidence that stromal microenvironment mediates prostate cancer progression, further identifying tissue-based biomarkers and potential therapeutic targets of aggressive and metastatic disease.

Keywords: Wnt signaling; bone metastasis; cancer-associated fibroblasts; complement protein; genetically-engineered mouse models; innate and adaptive immunity; neuroendocrine tumor stroma; predictive and prognostic signatures; prostate cancer; single-cell RNA sequencing; tumor microenvironment.


Conflict of interest statement

Ethics declarations The authors declare no competing interests.

Figures

Figure 1.
Figure 1.. Identification of differentially enriched stromal cell clusters between WT and GEMMs.
(A) 8,574 mesenchymal cells visualized by Uniform manifold approximation and projection (UMAP) and colored according to partition assigned by graph-based clustering (left panel) and model of origin (mutant vs. wildtype; middle and right panels). (B) UMAP visualization of the mesenchymal clusters colored by the number of detected genes (left) and Unique Molecular Identifiers (UMIs) (right). (C) Heatmap showing the percentage of the different mesenchymal clusters in each mouse model. Three clusters (c0-c2) represent fibroblast states common to all genotypes, 5 clusters (c3-c7) are specific stromal responses to epithelial mutations. Stroma of two additional wildtype strains (B6 and B6.129) varies in the different backgrounds. (D) Parallel categories plot showing the proportions of mesenchymal clusters (left) across the different mouse models (right). (E) Signaling networks between the stroma, epithelium, and immune compartments. The heatmaps shows the significant outgoing patterns in the mutants (left) and wild types (right). The color bar represents the relative strength of a signaling pathway across cells. The top-colored bar plot shows the total signaling strength of each compartment by summarizing all signaling pathways displayed in the heatmap. The right grey bar plot shows the total signaling strength of a signaling pathway by summarizing all compartments displayed in the heatmap. The chord diagrams display the significant signaling networks between the stroma, epithelium, and immune compartments in mutants (left) and wild types (right). Each sector represents a different compartment, and the size of the inner bars represents the signal strength received by their targets. The heatmap is based on comparing the communication probabilities between mutants and wild types while in the chord diagrams, up- and down-regulated signaling ligand-receptor pairs were identified based on differential gene expression analysis between mutants and wild types. In all cases, we adjusted for the number of cells.
Figure 2.
Figure 2.. A common cluster of contractile mesenchymal cells encompasses myofibroblasts and pericytes.
(A) Canonical myogenic and smooth muscle genes characterize c0 as contractile mesenchymal cells (left panel), but 2 subpopulations (c0.1 and c0.2) may be further subclassified (middle panel). Relative contribution of the different GEMMs and WTs to c0 is shown in the right panel. (B) UMAP projection of c0 cells showing the expression of different myogenic and smooth muscle genes. Acta2, Myl9, Myh11 and Tangl mark myofibroblasts and pericytes, while Rgs5, Mef2c and Pdgfrb distinguish pericytes (c0.2). Color scale is proportional to the expression levels. (C) Dot plot of the expression of genes distinguishing myofibroblasts (c0.1) and pericytes (c0.2). (D) The mean expression of regulons distinguishing myofibroblasts (c0.1) from pericytes (c0.2).
Figure 3.
Figure 3.. A functional atlas of the mouse prostate cancer mesenchyme.
(A) Dot plot showing the mean expression of marker genes for common clusters c0-c2. Boxes indicate the clusters marked by each marker gene set. The total number of cells in each cluster is indicated by the bar plot on the right. Significantly enriched regulons identified by gene regulatory networks are denoted on top of each boxed cluster. (B-C) Representative images of C3 and GPX3 overexpression in tumor desmoplastic stroma in NP and PRN models (left panels) and matching WTs (right panels). Magnification for all images 200x. Scalebar: 300μm. (D-E) Chord diagrams of significant signaling pathways from the common clusters c0-c2 to the epithelium (D) and immune cells (E). Each sector represents a different cell population, and the size of the inner bars represents the signal strength received by their targets. Communication probsbilities were calculated after adjusting for the number of cells in each cluster.
Figure 4.
Figure 4.. GEMM-specific mesenchymal clusters define complex signaling pathways in the reactive stroma.
(A) Dot plot showing the mean expression of marker genes for model-specific clusters c3-c7. Boxes indicate the clusters marked by each marker gene set. The total number of cells in each cluster is indicated by the bar plot on the right. Significantly enriched regulons identified by gene regulatory networks are denoted on top of each boxed cluster. (B-C) Representative images of LGR5 and SFRP2 overexpression in tumor desmoplastic stroma in T-ERG and PRN models (left panels) and matching wildtypes (right panels). Magnification for all images 200x. Scalebar: 300μm. (D) Bar plots showing the relative frequency of Mki67+ mesenchymal cells across all clusters (left), UMAP projections of Mki67+ cells in PRN stroma (middle) and violin plots of the expression of Mki67 in PRN stroma (right). (E) Chord diagrams showing the significant signaling pathways from c3 and c4 to the epithelium and immune cells (upper and lower panels, respectively). (F) Chord diagrams showing the significant signaling pathways from the PRN associated clusters (c5-c7) to the epithelium and immune cells (upper and lower panels, respectively). Communication probsbilities were calculated after adjusting for the number of cells in each cluster.
Figure 5.
Figure 5.. Mesenchymal Periostin overexpression is associated with aggressive, neuroendocrine prostate cancer.
(A) UMAP projection of PRN clusters c5-c7 (left), Postn (middle) and Ar (right) expression in prostate mesenchyme; and dot plots showing the mean expression of Postn and Ar in the different mouse models (right). (B) Multiplexed staining for a panel of proteins including POSTN, AR, and Chromogranin in PRN model showing high POSTN and low AR expression in stroma adjacent to neuroendocrine prostate cancer (NEPC) foci (right panel), and weak to moderate AR expression around in the stroma surrounding adenocarcinoma foci (left panel). Magnification for all images 200x. Scalebar: 300μm. (C) Quantification of 22rv1 overexpressing MYCN and with Rb1 knock down migration in Boyden chamber transwell assay. (*** p-value<0.001, ****p-value<0.0001, 1-way ANOVA). (D) Boxplots of POSTN expression in WCM clinical cohort. PCa: prostate cancer, CRPC: castration-resistant prostate cancer, NEPC: neuroendocrine prostate cancer, RPKM: reads per kilobase million. (E) Multiplexed staining for a panel of proteins including POSTN (yellow), AR (red), and Chromogranin (orange) in human samples, showing high POSTN and weak to moderate AR expression around the stroma surrounding adenocarcinoma foci (left panel), and high POSTN and low AR expression in stroma adjacent to NEPC foci (right panel) Magnification for all images 150x, scalebar: 300μm. NEPC: neuroendocrine prostate cancer. (F) Receiver Operating Characteristics (ROC) curve showing the performance of the PRN signature at predicting metastasis in the training (n=930) and testing (n=309) data. The signature was trained and tested on bulk expression profiles of primary tumor samples derived from prostate cancer patients. AUC: Area Under the ROC Curve. (G) Progression-free survival (PFS) in the TCGA prostate adenocarcinoma cohort (n=439). On the left, Kaplan-Meier survival plot showing the difference in PFS between patients predicted as ‘0’ and ‘1’ using the PRN signature. The x-axis shows the survival time in months. P: p-value using the logrank test. On the right, forest plot for multivariate Cox proportional hazards model showing the hazard ratio and 95% confidence interval for the PRN signature and Gleason grade. (*p-value <0.05).
Figure 6.
Figure 6.. Analysis of human scRNA-seq data suggests the relevance of prostate mesenchyme in human PCa pathobiology.
(A) Parallel categories plot showing the relationship between the mesenchymal clusters and ERG status (left). UMAP projection of the 8 mesenchymal clusters in the human scRNA-seq data (center) and AR expression in the human mesenchymal clusters (right). (B) Dot plot showing the mean expression of marker genes for common clusters c0-c2 in the human scRNA-seq data. (C) UMAP of the selected cell types from the bone metastasis scRNA-seq data derived from Kfoury et al., 2021 (left) and their associated annotation using the 8-mesenchymal cluster definition (middle). The expression of BGN across the 8 mesenchymal clusters is shown on the right. (D) Violin plots showing the mean expression of POSTN and proliferative marker MKI67 across the mesenchymal clusters in the Kfoury et al. scRNA-seq cohort.

References

    1. Rebello RJ, et al. Prostate cancer. Nature Reviews Disease Primers 7, 9 (2021). - PubMed
    1. Robinson D, et al. Integrative clinical genomics of advanced prostate cancer. Cell 161, 1215–1228 (2015). - PMC - PubMed
    1. Shoag J, Barbieri CE. Clinical variability and molecular heterogeneity in prostate cancer. Asian J Androl 18, 543–548 (2016). - PMC - PubMed
    1. Pederzoli F, et al. Targetable gene fusions and aberrations in genitourinary oncology. Nat Rev Urol 17, 613–625 (2020). - PubMed
    1. Dakhova O, et al. Global gene expression analysis of reactive stroma in prostate cancer. Clin Cancer Res 15, 3979–3989 (2009). - PMC - PubMed

Publication types