[Preprint]. 2023 Mar 28:2023.03.27.534442.
doi: 10.1101/2023.03.27.534442.

Phospho-seq: Integrated, multi-modal profiling of intracellular protein dynamics in single cells

Affiliations

Phospho-seq: Integrated, multi-modal profiling of intracellular protein dynamics in single cells

John D Blair et al. bioRxiv. .

Update in

Abstract

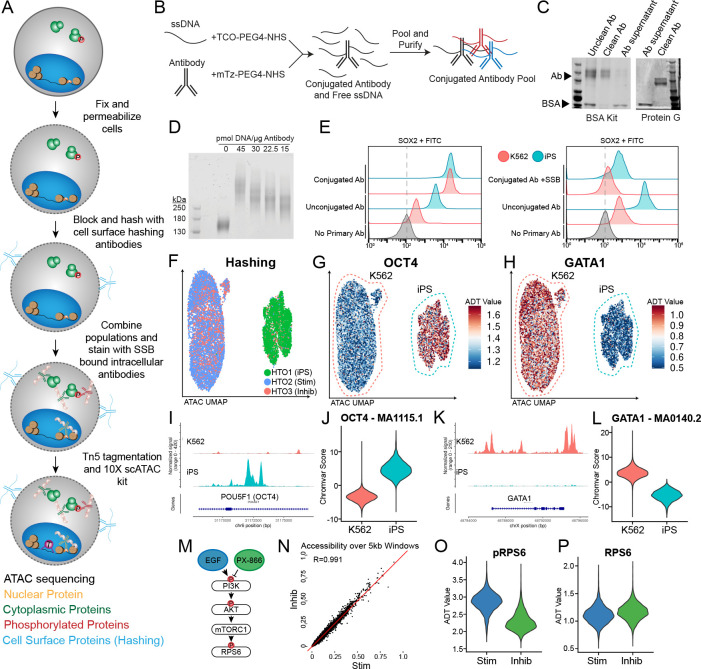
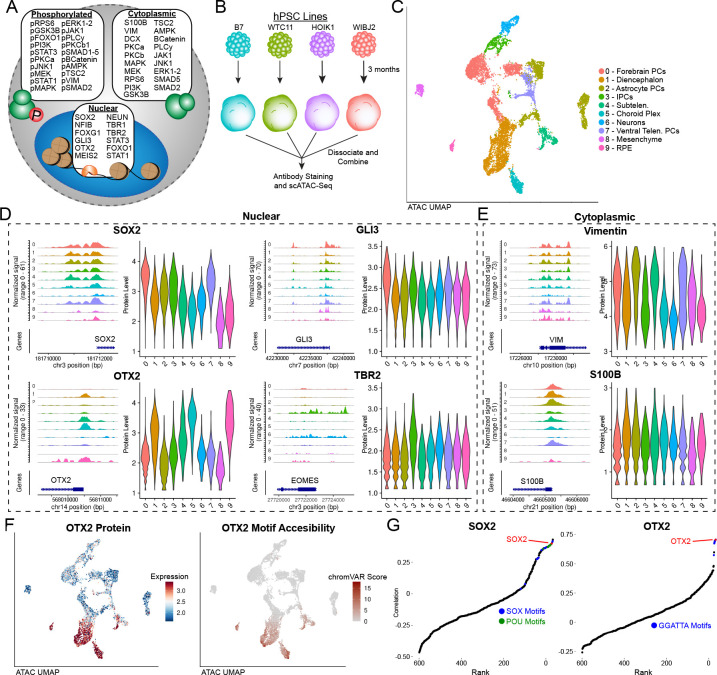
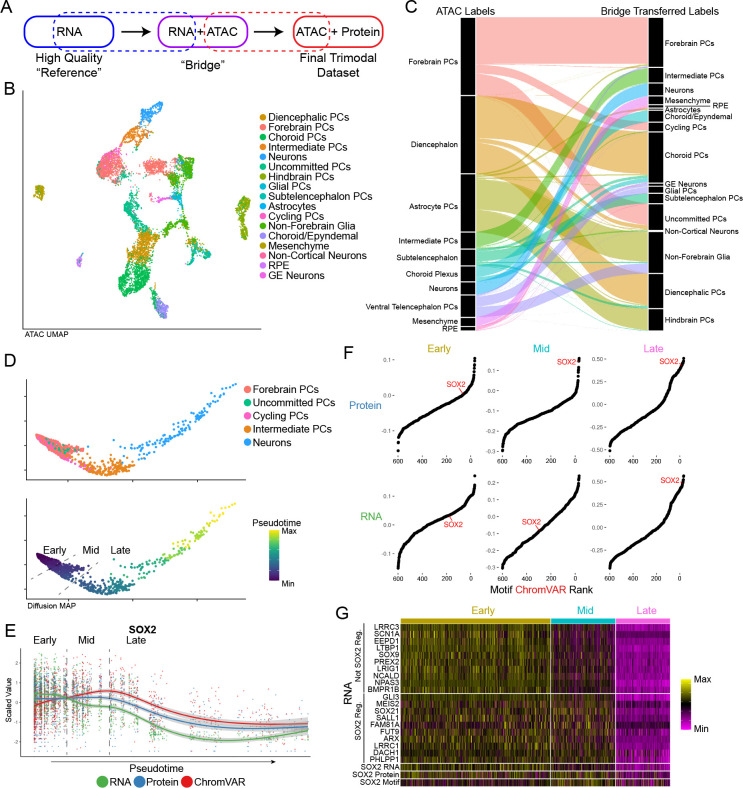
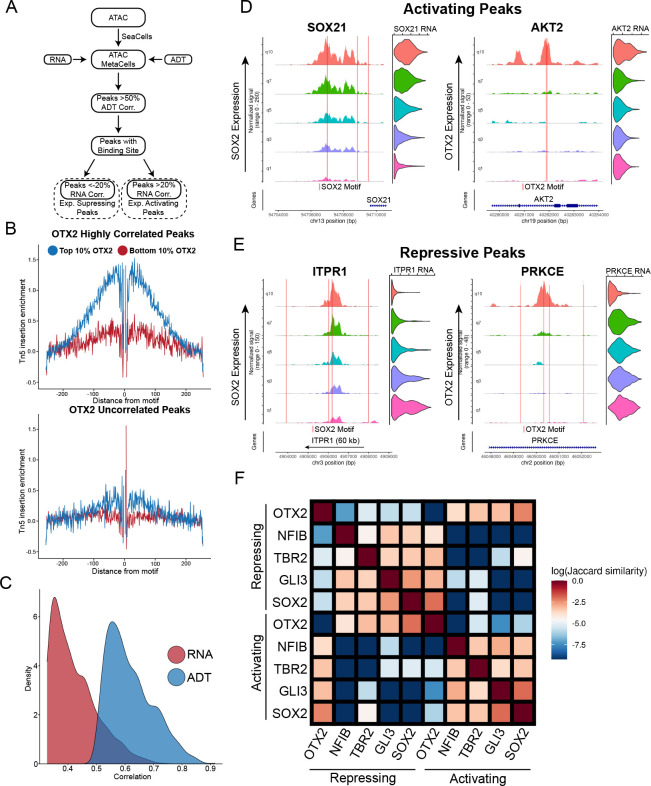
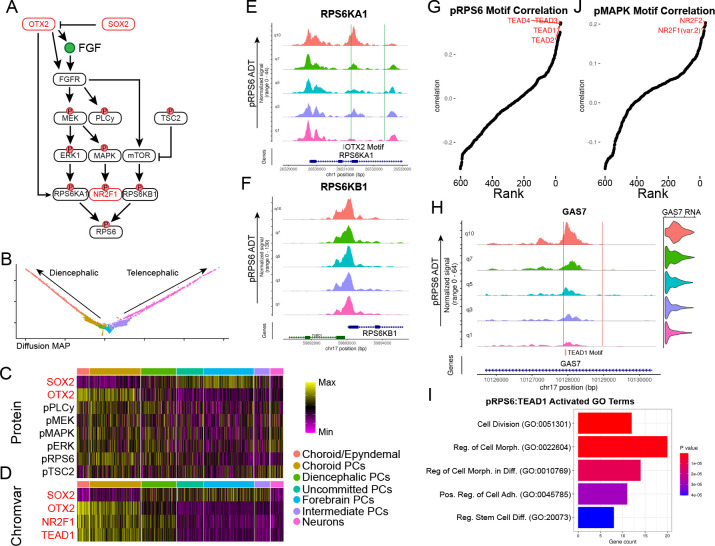
Cell signaling plays a critical role in regulating cellular behavior and fate. While multimodal single-cell sequencing technologies are rapidly advancing, scalable and flexible profiling of cell signaling states alongside other molecular modalities remains challenging. Here we present Phospho-seq, an integrated approach that aims to quantify phosphorylated intracellular and intranuclear proteins, and to connect their activity with cis-regulatory elements and transcriptional targets. We utilize a simplified benchtop antibody conjugation method to create large custom antibody panels for simultaneous protein and scATAC-seq profiling on whole cells, and integrate this information with scRNA-seq datasets via bridge integration. We apply our workflow to cell lines, induced pluripotent stem cells, and 3-month-old brain organoids to demonstrate its broad applicability. We demonstrate that Phospho-seq can define cellular states and trajectories, reconstruct gene regulatory relationships, and characterize the causes and consequences of heterogeneous cell signaling in neurodevelopment.


Conflict of interest statement

Competing interests: In the past three years, R.S. has worked as a consultant for Bristol-Myers Squibb, Regeneron, and Kallyope and served as an SAB member for ImmunAI, Resolve Biosciences, Nanostring, and the NYC Pandemic Response Lab. The other authors declare no competing interests.

Figures

Figure 1:
Figure 1:. Phospho-seq procedure and pilot experiment.
a) Schematic of Phospho-seq workflow. b) Schematic of antibody conjugation procedure. c) Protein gel results of two antibody purification methods using the Abcam BSA Removal Kit (left panel) and Promega Magne Protein G beads (right panel). d) Protein gel of mTz-PEG4-NHS labeled antibodies incubated with different quantities of TCO-PEG4-NHS labeled ssDNA tags. e) Flow cytometry plots of K562 and iPS cells stained with unconjugated and conjugated SOX2 antibodies (left panel) and unconjugated and conjugated + single-stranded DNA binding protein SOX2 antibodies (right panel) with unstained controls. f) UMAP representation from scATAC-Seq of K562 and iPS cells colored by demultiplexed HTOs assigned to each cell. g) UMAP representation of K562 and iPS cells colored by normalized ADT values for OCT4. h) UMAP representation of K562 and iPS cells colored by normalized ADT values for GATA1. i) Coverage plot of chromatin accessibility of K562 and iPS cells at the POU5F1 (OCT4) genomic locus. j) Violin plot of chromVAR scores for the OCT4 TF binding motif (MA1115.1) in K562 and iPS cells. k) Coverage plot of chromatin accessibility of K562 and iPS cells at the GATA1 genomic locus. l) Violin plot of chromVAR scores for the GATA1 TF binding motif (MA0140.2) in K562 and iPS cells m) Schematic of PI3K/AKT/mTORC1 pathway activation and repression paradigm used in this experiment. n) Scatter plot of pseudobulked chromatin accessibility data in 5 kb windows across the genome comparing inhibited K562 cells with stimulated K562 cells. Red line indicates perfect correlation between the two conditions. o) Violin plot of normalized pRPS6 values in stimulated (Stim) and inhibited (Inhib) K562 cells. p) Violin plot of normalized RPS6 values in stimulated (Stim) and inhibited (Inhib) K562 cells.
Figure 2:
Figure 2:. Phospho-seq on brain organoids.
a) Schematic of antibody panel used in brain organoid Phospho-seq experiment and the cellular compartment of the target protein. b) Schematic of brain organoid differentiation. c) UMAP representation of cells and cell type assignments based on the ATAC-seq modality in Phospho-seq. d) Coverage and violin plots of the gene promoters and protein levels respectively of four nuclear proteins included in the Phospho-seq panel (SOX2,GLI3,OTX2 and TBR2), color and order are same as in (c). e) Coverage and violin plots of the gene promoters and protein levels respectively of two cytoplasmic proteins included in the Phospho-seq panel (Vimentin and S100B), color and order are same as in (c). f) UMAP representation of cells colored by normalized ADT values for OTX2 (left panel), UMAP representation of cells colored by chromVAR scores for OTX2 motif accessibility. g) Rank-correlation plots for transcription factor motifs vs. SOX2 (left panel) and OTX2 (right panel) with the TF motif of interest indicated in red.
Figure 3:
Figure 3:. Bridge integration.
a) Schematic of bridge integration. b) UMAP representation of cells based on ATAC-seq modality with cell type assignments from bridge integration. c) Alluvial plot demonstrating cell label transfer when using bridge integration. d) Diffusion map of cells differentiating from Forebrain PCs to Neurons colored by cell type (top panel) and pseudotime as determined by monocle (bottom panel). Dashed lines indicate pseudotime cut-offs determined by SOX2 expression and activity. e) Scatter plot showing scaled values of SOX2 RNA, protein and motif chromVAR score across pseudotime as determined in (d). Dashed lines indicate the same SOX2-based pseudotime cut-offs as in (d). f) Rank-correlation plots of the correlation of transcription factor motif accessibility vs. SOX2 Protein (top panel) and SOX2 RNA (bottom panel) for each of the pseudotime cut-off group. g) Heatmap of a subset of genes not regulated by SOX2 and regulated by SOX2 across pseudotime bins.
Figure 4:
Figure 4:. Transcription factor-specific cis-regulatory element discovery.
a) Schematic of approach to use metacelling to discover cis-regulatory elements associated with individual proteins. b) Tn5 cut-site footprinting between cells with high OTX2 expression and low OTX2 expression in peaks that are highly correlated with OTX2 (top panel) and uncorrelated with OTX2 (bottom panel). c) Density of the correlations of top 1000 SOX2 correlated peaks when using SOX2 RNA from the multiome vs. SOX2 ADT. d) Examples of inferred transcription activating peaks associated with indicated proximal gene expression for SOX2 (left panel) and OTX2 (right panel). Coverage plots and violin plots are ordered by quantile ADT expression for each protein. Red lines indicated the location of a binding motif for each respective protein. e) Examples of inferred transcription repressing peaks associated with indicated proximal gene expression for SOX2 (left panel) and OTX2 (right panel). Coverage plots and violin plots are ordered by quantile ADT expression for each protein. f) Jaccard similarity matrix of inferred activating and repressing peaks from each of the TFs highlighted
Figure 5:
Figure 5:. Differential signaling pathway activity across development.
a) Schematic of SOX2 and OTX2 regulation of MAPK/ERK signaling. b) Diffusion MAP plot of diencephalic and telencephalic differentiation trajectories. Cell type colors correspond to legend in (c). c) Heatmap of ADT expression of proteins and phospho-proteins associated with MAPK/ERK and mTOR signaling. d) Heatmap of chromVAR scores for TF motifs enriched in diencephalic differentiation. e) Coverage plot of RPS6KA1 split into quantiles of pRPS6 levels across telencephalic and diencephalic differentiation trajectories with OTX2 binding motifs indicated. f) Coverage plot of RPS6KB1 split into quantiles of pRPS6 levels across telencephalic and diencephalic differentiation trajectories. g) Rank-correlation plot showing correlation between pRPS6 levels and motif accessibility across the whole Phospho-seq dataset. The top hits are indicated in red. h) Coverage and violin plots of GAS7 split by quantiles of pRPS6 levels across the whole dataset with TEAD1 motifs indicated by red lines. i) Bar plot of the top 5 most significant gene ontology categories associated with the top TEAD1 activated peak-gene links that are associated with pRPS6. j) Rank-correlation plot showing correlation between pMAPK levels and motif accessibility across the whole Phospho-seq dataset.

References

    1. Valls P. O. & Esposito A. Signalling dynamics, cell decisions, and homeostatic control in health and disease. Curr. Opin. Cell Biol. 75, 102066 (2022). - PMC - PubMed
    1. Badeaux A. I. & Shi Y. Emerging roles for chromatin as a signal integration and storage platform. Nat. Rev. Mol. Cell Biol. 14, 211–224 (2013). - PubMed
    1. Karin M. & Smeal T. Control of transcription factors by signal transduction pathways: the beginning of the end. Trends Biochem. Sci. 17, 418–422 (1992). - PubMed
    1. Thoreen C. C. et al. A unifying model for mTORC1-mediated regulation of mRNA translation. Nature 485, 109–113 (2012). - PMC - PubMed
    1. Lee M. J. & Yaffe M. B. Protein Regulation in Signal Transduction. Cold Spring Harb. Perspect. Biol. 8, (2016). - PMC - PubMed

Publication types