[Preprint]. 2023 Mar 29:2023.03.28.534564.
doi: 10.1101/2023.03.28.534564.

Implantation of engineered adipocytes that outcompete tumors for resources suppresses cancer progression

Affiliations

Implantation of engineered adipocytes that outcompete tumors for resources suppresses cancer progression

Hai P Nguyen et al. bioRxiv. .

Abstract

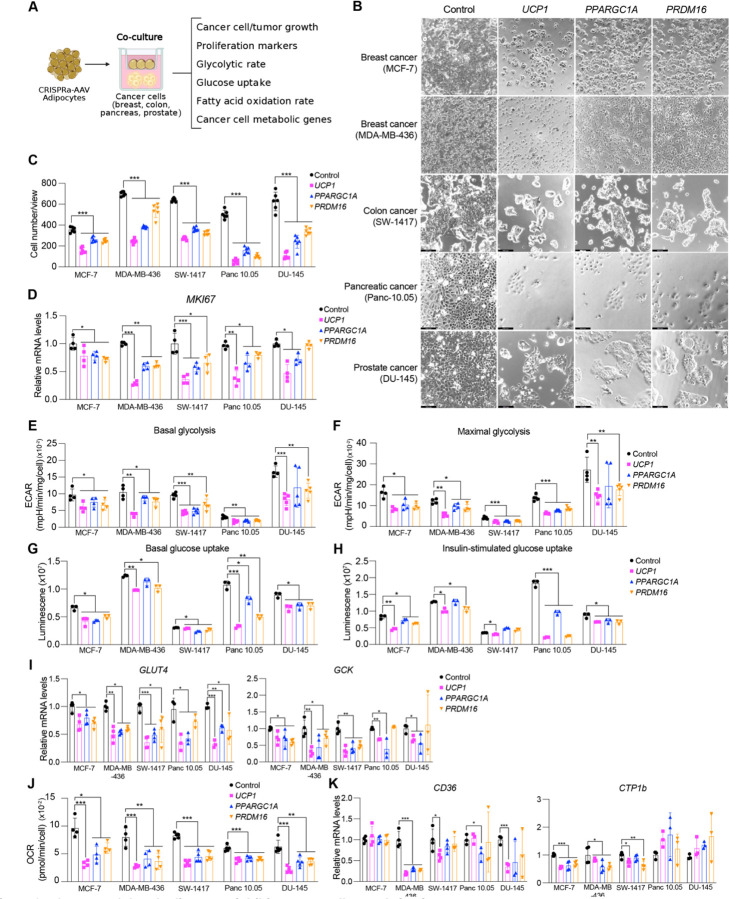
Tumors acquire an increased ability to obtain and metabolize nutrients. Here, we engineered and implanted adipocytes to outcompete tumors for nutrients and show that they can substantially reduce cancer progression. Growing cells or xenografts from several cancers (breast, colon, pancreas, prostate) alongside engineered human adipocytes or adipose organoids significantly suppresses cancer progression and reduces hypoxia and angiogenesis. Transplanting modulated adipocyte organoids in pancreatic or breast cancer mouse models nearby or distal from the tumor significantly suppresses its growth. To further showcase therapeutic potential, we demonstrate that co-culturing tumor organoids derived from human breast cancers with engineered patient-derived adipocytes significantly reduces cancer growth. Combined, our results introduce a novel cancer therapeutic approach, termed adipose modulation transplantation (AMT), that can be utilized for a broad range of cancers.


Conflict of interest statement

Competing interests NA is a cofounder and on the scientific advisory board of Regel Therapeutics and Neomer Diagnostics. NA receives funding from BioMarin Pharmaceutical Incorporate. HPN and NA have filed a patent application covering embodiments and concepts disclosed in the manuscript.

Figures

Fig. 1.
Fig. 1.. CRISPRa browning activation in human white adipocytes.
(A) qRT-PCR of UCP1, PPARGC1A, and PRDM16 in human white adipocytes transduced with CRISPRa targeting UCP1, PPARGC1A, and PRDM16. Data are represented as mean ± S.D *≤0.05. (B) qRT-PCR of TFAM, DIO2, CPT1b, and NRF1 in CRISPRa-modulated adipocytes. Data are represented as mean ± S.D *≤0.05, ***≤0.001. (C) Oxygen consumption rate (OCR) of CRISPRa-modulated adipocytes measured by the seahorse assay. Uncoupled OCR was measured under oligomycin treatment, while maximal OCR was measured under FCCP. (D) Glucose uptake of CRISPRa-modulated adipocytes with or without insulin. Data are represented as mean ± S.D *≤0.05, **≤0.01, ***≤0.001. (E) OCR of CRISPRa-modulated cells was measured by the seahorse assay in BSA- or BSA-Palmitate- medium. Data are represented as mean ± S.D *≤0.05, ***≤0.001. (F) Exogenous fatty acid oxidation of CRISPRa-modulated adipocytes was calculated by the difference of area under the curve of OCR between BSA- and BSA-Palmitate- media upon FCCP treatment. Data are represented as mean ± S.D *≤0.05, **≤0.01.
Fig. 2.
Fig. 2.. CRISPRa-modulated adipocytes inhibit cancer cell growth in vitro.
(A) Schematic of the co-culturing model of cancer cells and CRISPRa-treated adipocytes using transwell plates and their subsequent phenotyping. (B) Representative images of cancer cells, including breast (MCF7, MDA-MD-436), colon (SW-1417), pancreatic (Panc 10.05), and prostate cancer (DU-145) that were co-cultured with CRISPRa upregulating UCP1, PPARGC1a, and PRDM16 or control (dCas9-VP64 only) adipocytes. (C) Cancer cell numbers per view of image (4 images/replicates per condition). Data are represented as mean ± S.D ***≤0.001. (D) qRT-PCR of the proliferation marker gene, MKI67, for cancer cells co-cultured with CRISPRa-modulated adipocytes. Data are represented as mean ± S.D *≤0.05, **≤0.01, ***≤0.001. (E) Basal glycolysis measured by calculating area under the curve of extracellular acidification rate upon glucose treatment. Data are represented as mean ± S.D *≤0.05, **≤0.01, ***≤0.001. (F) Maximal glycolysis measured by calculating area under the curve of extracellular acidification rate upon oligomycin treatment. Data are represented as mean ± S.D *≤0.05, **≤0.01, ***≤0.001. (G-H) Glucose uptake of cancer cells co-cultured with CRISPRa-modulated adipocytes without (G) or with (H) insulin. Data are represented as mean ± S.D *≤0.05, **≤0.01, ***≤0.001. (I) qRT-PCR of glucose transporter, GLUT4, and glycolytic enzyme, GCK in cancer cells. Data are represented as mean ± S.D *≤0.05, **≤0.01, ***≤0.001. (J) Exogenous fatty acid oxidation of cancer cells calculated by the difference of area under the curve of OCR between BSA- and BSA-Palmitate- media upon FCCP treatment. Data are represented as mean ± S.D **≤0.01, ***≤0.001. (K) qRT-PCR of fatty acid transporter, CD36, and fatty acid regulatory transporter, CPT1b in cancer cells that were co-cultured with CRISPRa-treated adipocytes. Data are represented as mean ± S.D *≤0.05, ***≤0.001.
Fig. 3.
Fig. 3.. Co-transplantation of xenografts with UCP1-CRISPRa modulated human adipose organoids suppresses tumor growth.
(A) Schematic of the co-transplantation model for xenografts and UCP1-CRISPRa treated human adipose organoids in immune-deficient SCID mice and their subsequent phenotyping. (B) Representative images of xenograft tumors from various cancer cells lines, including breast (MCF7 and MDA-MD-436), pancreatic (Panc 10.05), and prostate cancer (DU-145) that were co-transplanted with UCP1-CRISPRa human adipose organoids or control (dCas9-VP64 only) adipose organoids (n=8 mice per treatment). (C) Volume of xenograft tumors that were co-transplanted with UCP1-CRISPRa human adipose organoids compared to control (dCas9-VP64 only) (n=6–8 mice). Data are represented as mean ± S.D ***≤0.001. (D-F) Immunofluorescence staining and quantification of Ki67 (D), CA9 (E), and CD31 (F) in cryosections of xenograft tumors (n= 4 sections per treatment). Data are represented as mean ± S.D ***≤0.001.
Fig. 4.
Fig. 4.. Implantation of Ucp1-CRISPRa adipose organoids in pancreatic and breast cancer genetic mouse models suppresses cancer development.
(A) Schematic of the transplantation model for Ucp1-CRISPRa treated mouse adipose organoids in KPC pancreatic cancer mice and their subsequent phenotyping. (B) Representative images of the pancreas implanted with Ucp1-CRISPRa or control (dCas9-VP64 only) mouse adipose organoids (n=5–6 mice per treatment). (C) Weight of the pancreas transplanted with Ucp1-CRISPRa modulated mouse adipose organoids compared to control (dCas9-VP64 only) (n=5–6 mice). Data are represented as mean ± S.D **≤0.01. (D) qRT-PCR of proliferation marker gene, MKI67, metabolic genes, including Glut2, Gck, Cd36, and Ctp1b, from pancreatic tumors co-transplanted with Ucp1-CRISPRa modulated adipocytes. Data are represented as mean ± S.D *≤0.05, **≤0.01. (E) Immunofluorescence quantification of Ki67, CA9, and CD31 in cryosections of tumors (n= 4 sections per treatment). Data are represented as mean ± S.D *≤0.05, **≤0.01. (F) Schematic of the transplantation model for Ucp1-CRISPRa treated mouse adipose organoids in the mammary gland or on the back of MMTV-PyMT breast cancer mice and their subsequent phenotyping. (G) Representative images of the breast tumor that were implanted with Ucp1-CRISPRa or control (dCas9-VP64 only) adipose organoids in the mammary gland or on the back of the mice (Dorsal) (n=4–5 mice per treatment). (H) Volume of the tumors transplanted with Ucp1-CRISPRa adipose organoids compared to control (dCas9-VP64 only) (n=4–5 mice). Data are represented as mean ± S.D *≤0.05, **≤0.01. (I) qRT-PCR of proliferation marker gene, MKI67, metabolic genes, including GLUT4, GCK, CD36, and CPT1b, from breast tumors co-transplanted with Ucp1-CRISPRa modulated adipocytes. Data are represented as mean ± S.D *≤0.05, **≤0.01, ***≤0.001. (J-L) Immunofluorescence staining and quantification of Ki67 (J), CA9 (K), and CD31 (L) in tumor cryosections (n= 4 sections per treatment). Data are represented as mean ± S.D **≤0.01, ***≤0.001.
Fig. 5.
Fig. 5.. Cancer organoids co-cultured with UCP1-CRISPRa adipocytes, both from dissected breast tissue, lead to tumor suppression.
(A) Schematic of the co-culturing model of UCP1-CRISPRa modulated human mammary adipocytes and breast cancer organoids from dissected breast tumors. (B) Representative images of breast tumor organoids from five dissected breast tumors that were co-cultured with UCP1-CRISPRa adipocytes or control (dCas9-VP64 only) adipocytes. (C) Breast cancer organoid size and numbers. Data are represented as mean ± S.D *≤0.05, **≤0.01, ***≤0.001. (D) qRT-PCR of proliferation marker gene, MKI67. Data are represented as mean ± S.D *≤0.05, **≤0.01. (E) qRT-PCR of metabolic genes, including GLUT4, GCK, CD36, and CPT1b of breast cancer organoids that were co-cultured with CRISPRa-modulated adipocytes. Data are represented as mean ± S.D *≤0.05, **≤0.01, ***≤0.001.

References

    1. Lin X., Xiao Z., Chen T., Liang S.H., and Guo H., Glucose Metabolism on Tumor Plasticity, Diagnosis, and Treatment. Front Oncol. 10, p. 317 (2020). - PMC - PubMed
    1. Hay N., Reprogramming glucose metabolism in cancer: can it be exploited for cancer therapy? Nat Rev Cancer. 16(10), p. 635–49 (2016). - PMC - PubMed
    1. Liberti M.V. and Locasale J.W., The Warburg Effect: How Does it Benefit Cancer Cells? Trends Biochem Sci. 41(3), p. 211–218 (2016). - PMC - PubMed
    1. Nagarajan S.R., Butler L.M., and Hoy A.J., The diversity and breadth of cancer cell fatty acid metabolism. Cancer Metab. 9(1), p. 2 (2021). - PMC - PubMed
    1. Palm W. and Thompson C.B., Nutrient acquisition strategies of mammalian cells. Nature. 546(7657), p. 234–242 (2017). - PMC - PubMed

Publication types