[Preprint]. 2023 Mar 29:2023.03.28.534295.
doi: 10.1101/2023.03.28.534295.

Cultured Mesenchymal Cells from Nasal Turbinate as a Cellular Model of the Neurodevelopmental Component of Schizophrenia Etiology

Affiliations

Cultured Mesenchymal Cells from Nasal Turbinate as a Cellular Model of the Neurodevelopmental Component of Schizophrenia Etiology

Victoria Sook Keng Tung et al. bioRxiv. .

Update in

Abstract

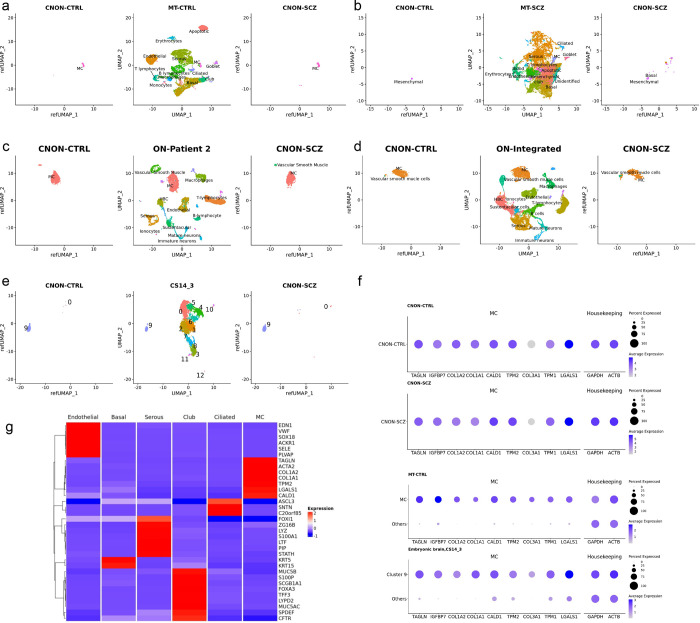
Study of the neurodevelopmental molecular mechanisms of schizophrenia requires the development of adequate biological models such as patient-derived cells and their derivatives. We previously used cell lines with neural progenitor properties (CNON) derived from superior or middle turbinates of patients with schizophrenia and control groups to study gene expression specific to schizophrenia. In this study, we compared single cell-RNA seq data from two CNON cell lines, one derived from an individual with schizophrenia (SCZ) and the other from a control group, with two biopsy samples from the middle turbinate (MT), also from an individual with SCZ and a control. In addition, we compared our data with previously published data from olfactory neuroepithelium (1). Our data demonstrated that CNON originated from a single cell type which is present both in middle turbinate and olfactory neuroepithelium. CNON express multiple markers of mesenchymal cells. In order to define relatedness of CNON to the developing human brain, we also compared CNON datasets with scRNA-seq data of embryonic brain (2) and found that the expression profile of CNON very closely matched one of the cell types in the embryonic brain. Finally, we evaluated differences between SCZ and control samples to assess usability and potential benefits of using single cell RNA-seq of CNON to study etiology of schizophrenia.

Keywords: mesenchymal cells; middle turbinate; neural progenitors; scRNA-seq; schizophrenia.


Conflict of interest statement

Conflict of Interest The authors declare that the research was conducted in the absence of any commercial or financial relationships that could be construed as a potential conflict of interest.

Figures

Figure 1.
Figure 1.
Single cell reference mapping and gene expression comparison of CNON datasets ((CNON-CTRL and CNON-SCZ) to human middle turbinate (MT-CTRL &MT-SCZ) and embryonic brain at Carnegie stage 14 (CS14_3) datasets. (A) Central panel shows UMAP dimensionality reduction plot of 21,565 human middle turbinate cells (MT-CTRL) with 13 cell types annotated. Left panel: UMAP dimensionality reduction plot of 12,234 CNON cells (CNON-CTRL). Right panel: UMAP dimensionality reduction plot of 3303 CNON cells (CNON-SCZ). All cells from both CNON-CTRL and CNON-SCZ map to the MC cluster location in MT-CTRL (B) Central panel shows UMAP dimensionality reduction plot of 28,140 human middle turbinate cells (MT-CTRL) with 13 cell types annotated. Left panel: UMAP dimensionality reduction plot of 12,234 CNON cells (CNON-CTRL), all of them mapped to MC cluster. Right panel: UMAP dimensionality reduction plot of 3303 CNON cells (CNON-SCZ). 3,268 of them map to the MC cluster location in MT-CTRL, while 35 cells mapped to Basal cluster. (C) Single cell reference mapping of CNON datasets to olfactory neuroepithelium, Patient 2. Central panel shows UMAP dimensionality reduction plot of cells from olfactory neuroepithelium of Patient 2 (1) with 13 cell types annotated. Left panel: UMAP dimensionality reduction plot of 11,425 CNON cells (CNON-CTRL); all cells mapped to Mesenchymal cell type. Right panel: UMAP dimensionality reduction plot of 2547 CNON cells (CNON-SCZ). The majority of cells (2420 CNON-SCZ cells) map to Mesenchymal cell type and 127 CNON-SCZ cells to Vascular Smooth Muscle cell clusters. (D) Single cell reference mapping of CNON datasets to olfactory neuroepithelium (integration of 4 patient samples data). Central panel shows UMAP dimensionality reduction plot of cells from olfactory neuroepithelium, integrated data from 4 patients (1) with 13 cell types annotated. Left panel: UMAP dimensionality reduction plot of 10,979 CNON cells (CNON-CTRL); 10901 cells mapped to Mesenchymal cell type, while 78 cells mapped to Vascular Smooth Muscle cells cluster. Right panel: UMAP dimensionality reduction plot of 2075 CNON cells (CNON-SCZ). The majority of cells (1,868 CNON-SCZ cells) map to Mesenchymal cell type and 207 CNON-SCZ cells to Vascular Smooth Muscle cells clusters. (E) Single Cell Reference Mapping of CNON datasets to embryonic brain (CS14_3). Central panel: UMAP dimensionality reduction plot of CS14_3 with 13 clusters. Left panel: UMAP dimensionality reduction plot of 12,234 CNON cells (CNON-CTRL); 12,233 cells mapped to to Cluster 9, 1 cell maps to cluster 0. Right panel: UMAP dimensionality reduction plot of 3303 CNON cells (CNON-SCZ). 3297cells map to cluster 9 and 6 cells map to cluster 0. (F) Average gene expression of selected cell markers in CNON. A gene considered MC marker gene if it is expressed in the MC cluster higher than in all other clusters with (a) statistical significance, (b) logFoldChange >2, and (c) expressed in at least 50% of cells of MC. MC markers: TAGLN, COL1A2, COL1A1, CALD1, TPM2, COL3A1, TPM1, and LGALS1; Housekeeping markers: GAPDH and ACTB; Neural stem cell marker: ITGB1 are shown in CNON-CTRL, CNON-SCZ, MT-CTRL, and Embryonic brain (sample CS14_3). The size of the dot represents the percentage of cells expressing the gene, and the colors represent the average expression level of each gene.
Figure 2.
Figure 2.
Microscopic images of CNON cell (A) outgrowing from biopsy piece in Matrigel, (B) growing in 2D culture, and (C) growing in Matrigel after culturing in 2D for several passages.

Similar articles

References

    1. Durante MA, Kurtenbach S, Sargi ZB, Harbour JW, Choi R, Kurtenbach S, et al. Single-cell analysis of olfactory neurogenesis and differentiation in adult humans. Nat Neurosci [Internet]. 2020;23(3):323–6. Available from: 10.1038/s41593-020-0587-9 - DOI - PMC - PubMed
    1. Eze UC, Bhaduri A, Haeussler M, Nowakowski TJ, Kriegstein AR. Single-cell atlas of early human brain development highlights heterogeneity of human neuroepithelial cells and early radial glia. Nat Neurosci. 2021;24(4):584–94. - PMC - PubMed
    1. Murray RM, Bhavsar V, Tripoli G, Howes O. 30 Years on: How the Neurodevelopmental Hypothesis of Schizophrenia Morphed into the Developmental Risk Factor Model of Psychosis. Schizophr Bull. 2017;43(6):1190–6. - PMC - PubMed
    1. Som PM, Naidich TP. Illustrated Review of the Embryology and Development of the Facial Region, Part 1: Early Face and Lateral Nasal Cavities. AJNR Am J Neuroradiol. 2013;34:2233–2240. - PMC - PubMed
    1. Kaltschmidt B, Kaltschmidt C, Widera D. Adult Craniofacial Stem Cells: Sources and Relation to the Neural Crest. Stem Cell Rev Reports. 2012;8(3):658–71. - PubMed

Publication types