[Preprint]. 2023 Mar 30:2023.03.29.534727.
doi: 10.1101/2023.03.29.534727.

Integrated single cell analysis shows chronic alcohol drinking disrupts monocyte differentiation in the bone marrow niche

Affiliations

Integrated single cell analysis shows chronic alcohol drinking disrupts monocyte differentiation in the bone marrow niche

Sloan A Lewis et al. bioRxiv. .

Update in

Abstract

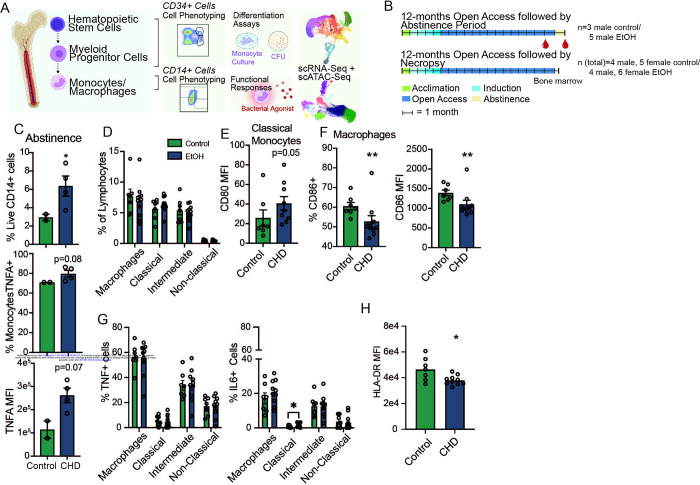
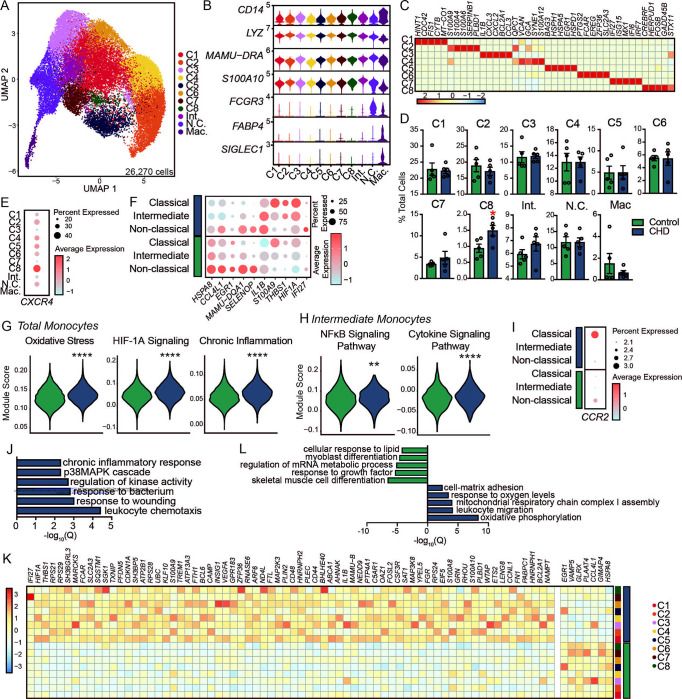
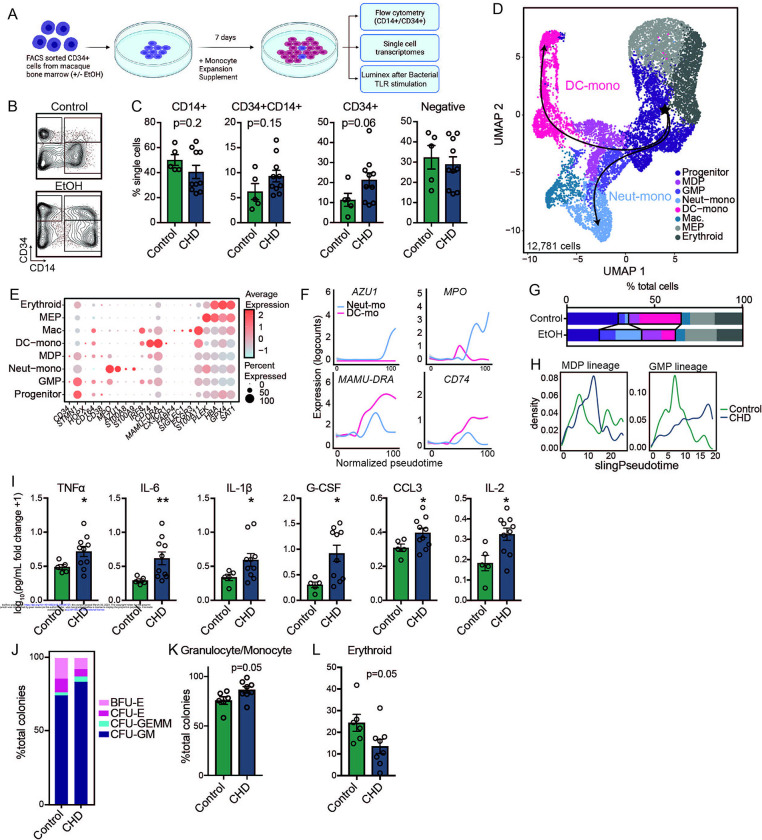
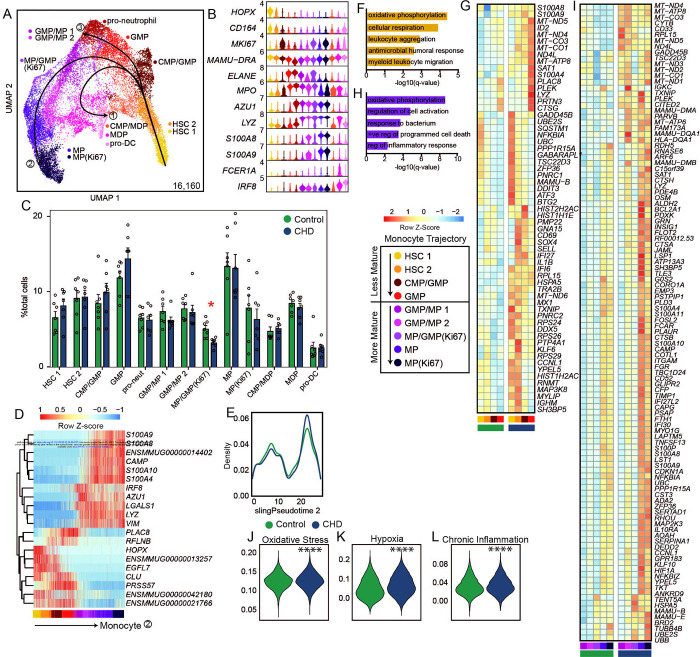
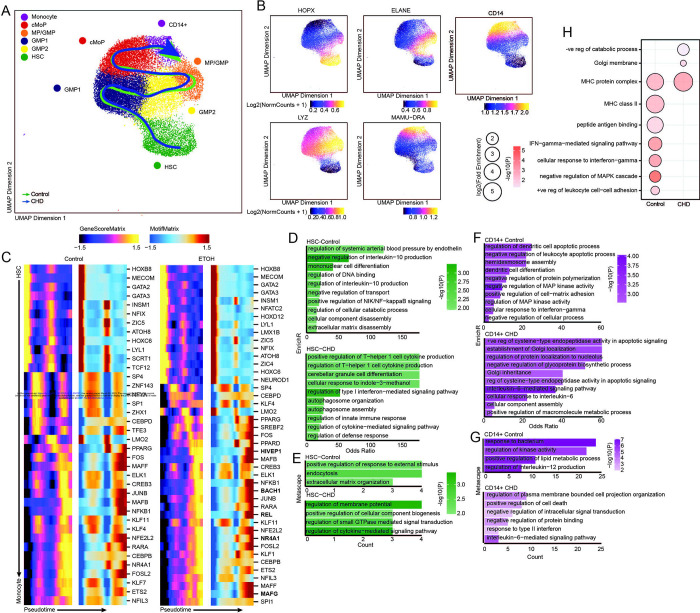
Chronic alcohol drinking rewires circulating monocytes and tissue-resident macrophages towards heightened inflammatory states with compromised anti-microbial defenses. As these effects remain consistent in short-lived monocytes after a 1-month abstinence period it is unclear whether these changes are restricted to the periphery or mediated through alterations in the progenitor niche. To test this hypothesis, we profiled monocytes/macrophages and hematopoietic stem cell progenitors (HSCP) of the bone marrow compartment from rhesus macaques after 12 months of ethanol consumption using a combination of functional assays and single cell genomics. Bone marrow-resident monocytes/macrophages from ethanol-consuming animals exhibited heightened inflammation. Differentiation of HSCP in vitro revealed skewing towards monocytes expressing neutrophil-like markers with heightened inflammatory responses to bacterial agonists. Single cell transcriptional analysis of HSCPs showed reduced proliferation but increased inflammatory markers in mature myeloid progenitors. We observed transcriptional signatures associated with increased oxidative and cellular stress as well as oxidative phosphorylation in immature and mature myeloid progenitors. Single cell analysis of the chromatin landscape showed altered drivers of differentiation in monocytes and progenitors. Collectively, these data indicate that chronic ethanol drinking results in remodeling of the transcriptional and epigenetic landscapes of the bone marrow compartment leading to altered functions in the periphery.


Conflict of interest statement

Competing interests

No competing interests reported.

Conflict-of-interest

The authors have declared that no conflict of interest exists.

Figures

Figure 1:
Figure 1:. Inflammatory blood monocyte phenotype with CHD extends through abstinence
A) Experimental design for study partially created on Biorender.com. B) CHD timeline (+/− abstinence) and blood/bone marrow collection for macaque cohorts. C) Flow cytometry phenotyping and intracellular cytokine staining (ICS) after 16-hour LPS stimulation were performed on total PBMC after 1-month abstinence. Bar plots showing % live CD14+ (top), % TNFα + monocytes (middle), and TNFα MFI from monocytes. ICS measurements were corrected for the unstimulated condition. D) Percentages of classical, intermediate, and non-classical monocytes, and CD169+ macrophages from live cells. E) Bar plot of CD80 MFI on classical monocytes. F) Bar plots of the percentage of CD86+ (left) and CD86 MFI (right) on macrophages. G) Total bone marrow cells were stimulated with a bacterial TLR cocktail (Pam3CSK4, LPS, and FSL-1) and the percentage of TNFα+ (left) and IL-6+ (right) were measured in each monocyte and macrophage population and corrected for the unstimulated condition. H) HLA-DR MFI was measured in macrophages after bacterial agonist stimulation by flow cytometry and corrected for the unstimulated condition. Statistical significance was tested by t-test with Welch’s correction where *=p<0.05, **=p<0.01.
Figure 2:
Figure 2:. Shift in the single cell transcriptional profiles of CD14+ cells from the bone marrow of macaques with CHD
A) UMAP clustering of 26,270 cells. B) Stacked violin plot showing expression of genes identified using Seurat’s FindAllMarkers function. C) Heatmap showing averaged marker gene expression of highly expressed genes from each classical monocyte cluster. D) Bar plots showing percentage of total cells contributing to each monocyte cluster. E) Dot plot showing expression of CXCR4 across each cluster where the size of the dot represents percent of cells expressing the gene and the color represents an averaged expression value. F) Dot plot showing expression of up- and down-regulated DEG with CHD common to all three monocyte subsets where the size of the dot represents percent of cells expressing the gene and the color represents an averaged expression value. G) Violin plots representing module score expression for oxidative stress, HIF-1α signaling, and chronic inflammation pathways in total monocytes. H) Violin plots representing module score expression for NFκB and cytokine signaling pathways in intermediate monocytes. Statistical significance was tested using Mann-Whitney test. I) Dot plot showing expression of CCR2 across each monocyte subset split by CHD and control where the size of the dot represents percent of cells expressing the gene and the color represents an averaged expression value. J) Bar plot representing −log10(q-value) functional enrichment scores for genes upregulated in classical monocyte clusters with CHD. K) Heatmap showing averaged gene expression of DEG from each classical monocyte cluster split by CHD and control groups. L) Bar plot representing −log10(q-value) functional enrichment scores for genes up- and downregulated in the macrophage cluster with CHD.
Figure 3:
Figure 3:. CHD alters CD34+ progenitor cell differentiation to monocytes
A) Experimental design for this figure created on Biorender.com. Sorted CD34+ cells from control and CHD macaque bone marrow were cultured in monocyte differentiation media supplement for 7 days. B) Example flow gating showing CD34+ versus CD14+ cells. C) Bar plots showing quantification of the culture output by flow cytometry. D) The same cultures were pooled from each group and subjected to 10X scRNA-Seq. UMAP projection of 12,781 cells overlayed with Slingshot pseudotime lineage lines. E) Dot plot showing expression of genes identified using Seurat’s FindAllMarkers function across each cluster where the size of the dot represents percent of cells expressing the gene and the color represents an averaged expression value. F) Log expression of AZU1, MPO, MAMU-DRA, CD74 plotted for each cell across the indicated scaled Slingshot pseudotime trajectory (trendline shown). G) Bar plots showing representative percentages of each cluster across control and CHD groups. H) Cell density plots for Control and CHD groups across each trajectory lineage determined by Slingshot. I) Cultures were stimulated for 6 hours with a bacterial TLR cocktail (Pam3CSK4, LPS, and FSL-1). Bar plots showing the log10(fold change +1) concentration of each of the indicated analytes measured by Luminex. J) Stacked bar plot showing percentages of CFU-GM, CFU-GEMM, CFU-E, and BFU-E colonies. (K-L) Bar plots showing the percentage of Granulocyte/Monocyte and Erythroid colonies from total colonies across control and CHD groups.
Figure 4:
Figure 4:. CHD CD34+ bone marrow myeloid progenitor single cell transcriptional profiles
A) Myeloid lineage UMAP (16,160 cells) with Slingshot lineage projection lines. B) Stacked violin plot of marker gene expression. C) Cluster percentages between CHD and control groups. Compared by two-way ANOVA with multiple comparisons. D) Heatmap of genes explaining the monocyte lineage trajectory. E) Cell density plot for Control and CHD groups across the monocyte trajectory lineage determined by Slingshot. F,H) Functional enrichment terms from less (F) and more (H) mature clusters. G,I) Averaged gene expression of upregulated DEG from less (G) and more (I) mature clusters split by CHD and control groups. J-L) Violin plots for indicated module scores across groups. Statistical analysis was performed by Mann-Whitney. Unless indicated, statistical significance was tested by t-test with Welch’s correction. *=p<0.05, ****=p<0.0001.
Figure 5:
Figure 5:. CD14+ and CD34+ bone marrow cell scATAC-Seq
A) UMAP projection of myeloid lineage cells based on gene accessibility with pseudotime lineage lines for control and CHD groups. B) Feature plots of marker genes from the gene score matrix. C) Integrative analysis of TF gene scores and motif accessibility across the monocyte lineage pseudotime in control and CHD cells. Genes listed on CHD heatmap are observed only with CHD. D-G) Functional enrichment from EnrichR (D,F) and Metascape (E,G) databases for differentially accessible regions more open in the indicated group for HSC (D-E) and pro-monocyte (F-G) clusters. Color indicates the −log10(P) value and length indicates the Odds Ratio from EnrichR (D,F) or the number of genes mapping to the term from metascape (E,G). (H) Functional enrichment determined by GO Biological Process within GREAT database for differentially accessible regions more open control (left) and CHD (right) groups for the pro-monocyte cluster. Color indicates the −log10(P) value and length indicates the log2(Fold Enrichment).

Similar articles

References

    1. (WHO) WHO. 2018.
    1. O’Keefe JH, et al. Alcohol and cardiovascular health: the dose makes the poison...or the remedy. Mayo Clin Proc. 2014;89(3):382–93. - PubMed
    1. Mukamal KJ, and Rimm EB. Alcohol’s effects on the risk for coronary heart disease. Alcohol Res Health. 2001;25(4):255–61. - PMC - PubMed
    1. Fedirko V, et al. Alcohol drinking and colorectal cancer risk: an overall and dose-response meta-analysis of published studies. Ann Oncol. 2011;22(9):1958–72. - PubMed
    1. Baan R, et al. Carcinogenicity of alcoholic beverages. Lancet Oncol. 2007;8(4):292–3. - PubMed

Publication types