[Preprint]. 2023 Mar 6:2023.03.06.531121.
doi: 10.1101/2023.03.06.531121.

A high-resolution transcriptomic and spatial atlas of cell types in the whole mouse brain

Zizhen Yao  1 Cindy T J van Velthoven  1 Michael Kunst  1 Meng Zhang  2 Delissa McMillen  1 Changkyu Lee  1 Won Jung  2 Jeff Goldy  1 Aliya Abdelhak  1 Pamela Baker  1 Eliza Barkan  1 Darren Bertagnolli  1 Jazmin Campos  1 Daniel Carey  1 Tamara Casper  1 Anish Bhaswanth Chakka  1 Rushil Chakrabarty  1 Sakshi Chavan  1 Min Chen  3 Michael Clark  1 Jennie Close  1 Kirsten Crichton  1 Scott Daniel  1 Tim Dolbeare  1 Lauren Ellingwood  1 James Gee  3 Alexandra Glandon  1 Jessica Gloe  1 Joshua Gould  4 James Gray  1 Nathan Guilford  1 Junitta Guzman  1 Daniel Hirschstein  1 Windy Ho  1 Kelly Jin  1 Matthew Kroll  1 Kanan Lathia  1 Arielle Leon  1 Brian Long  1 Zoe Maltzer  1 Naomi Martin  1 Rachel McCue  1 Emma Meyerdierks  1 Thuc Nghi Nguyen  1 Trangthanh Pham  1 Christine Rimorin  1 Augustin Ruiz  1 Nadiya Shapovalova  1 Cliff Slaughterbeck  1 Josef Sulc  1 Michael Tieu  1 Amy Torkelson  1 Herman Tung  1 Nasmil Valera Cuevas  1 Katherine Wadhwani  1 Katelyn Ward  1 Boaz Levi  1 Colin Farrell  1 Carol L Thompson  1 Shoaib Mufti  1 Chelsea M Pagan  1 Lauren Kruse  1 Nick Dee  1 Susan M Sunkin  1 Luke Esposito  1 Michael J Hawrylycz  1 Jack Waters  1 Lydia Ng  1 Kimberly A Smith  1 Bosiljka Tasic  1 Xiaowei Zhuang  2 Hongkui Zeng  1
Affiliations

A high-resolution transcriptomic and spatial atlas of cell types in the whole mouse brain

Zizhen Yao et al. bioRxiv. .

Update in

  • A high-resolution transcriptomic and spatial atlas of cell types in the whole mouse brain.
    Yao Z, van Velthoven CTJ, Kunst M, Zhang M, McMillen D, Lee C, Jung W, Goldy J, Abdelhak A, Aitken M, Baker K, Baker P, Barkan E, Bertagnolli D, Bhandiwad A, Bielstein C, Bishwakarma P, Campos J, Carey D, Casper T, Chakka AB, Chakrabarty R, Chavan S, Chen M, Clark M, Close J, Crichton K, Daniel S, DiValentin P, Dolbeare T, Ellingwood L, Fiabane E, Fliss T, Gee J, Gerstenberger J, Glandon A, Gloe J, Gould J, Gray J, Guilford N, Guzman J, Hirschstein D, Ho W, Hooper M, Huang M, Hupp M, Jin K, Kroll M, Lathia K, Leon A, Li S, Long B, Madigan Z, Malloy J, Malone J, Maltzer Z, Martin N, McCue R, McGinty R, Mei N, Melchor J, Meyerdierks E, Mollenkopf T, Moonsman S, Nguyen TN, Otto S, Pham T, Rimorin C, Ruiz A, Sanchez R, Sawyer L, Shapovalova N, Shepard N, Slaughterbeck C, Sulc J, Tieu M, Torkelson A, Tung H, Valera Cuevas N, Vance S, Wadhwani K, Ward K, Levi B, Farrell C, Young R, Staats B, Wang MM, Thompson CL, Mufti S, Pagan CM, Kruse L, Dee N, Sunkin SM, Esposito L, Hawrylycz MJ, Waters J, Ng L, Smith K, Tasic B, Zhuang X, Zeng H. Yao Z, et al. Nature. 2023 Dec;624(7991):317-332. doi: 10.1038/s41586-023-06812-z. Epub 2023 Dec 13. Nature. 2023. PMID: 38092916 Free PMC article.

Abstract

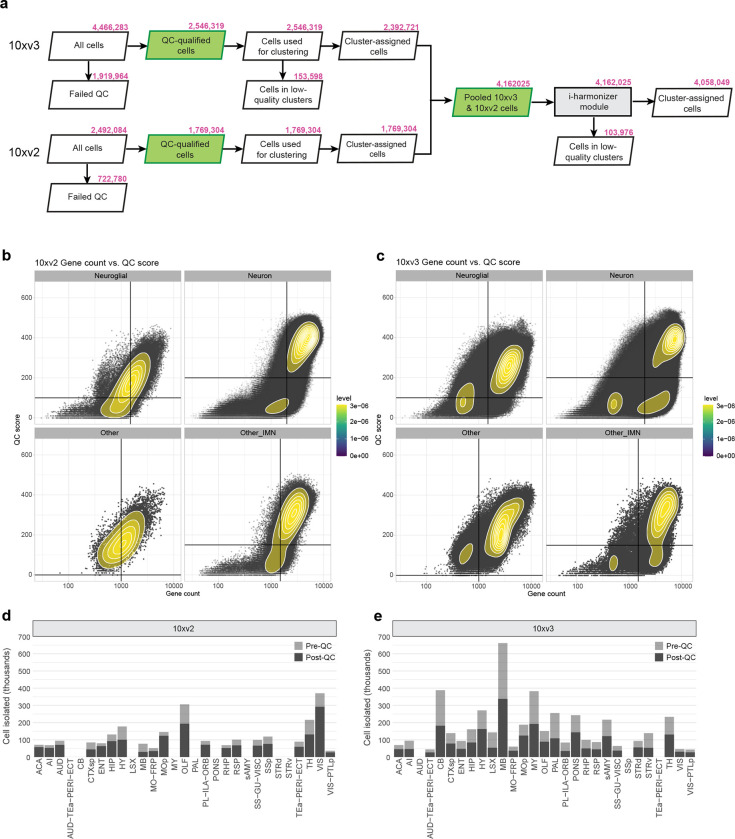
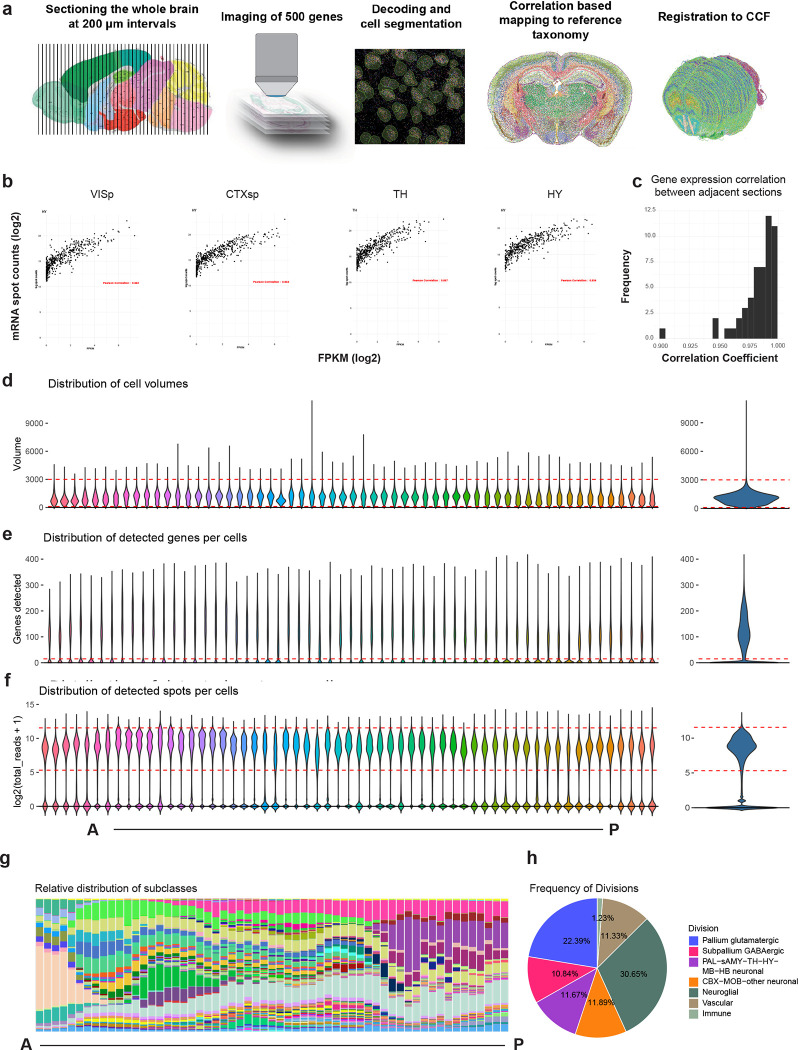
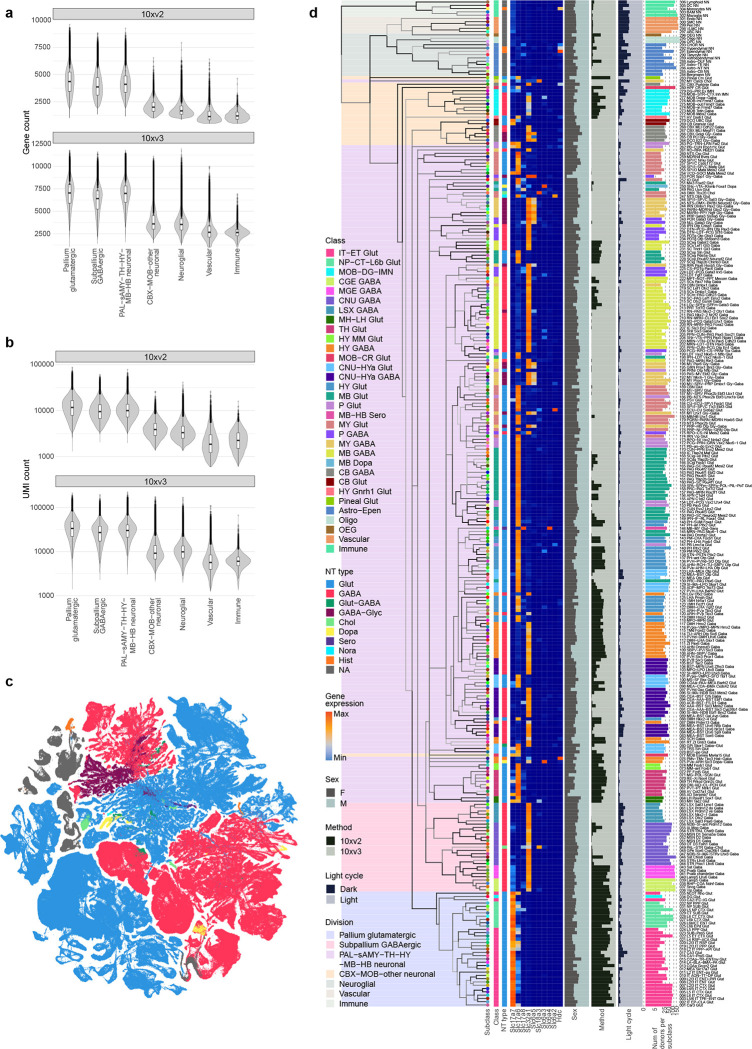
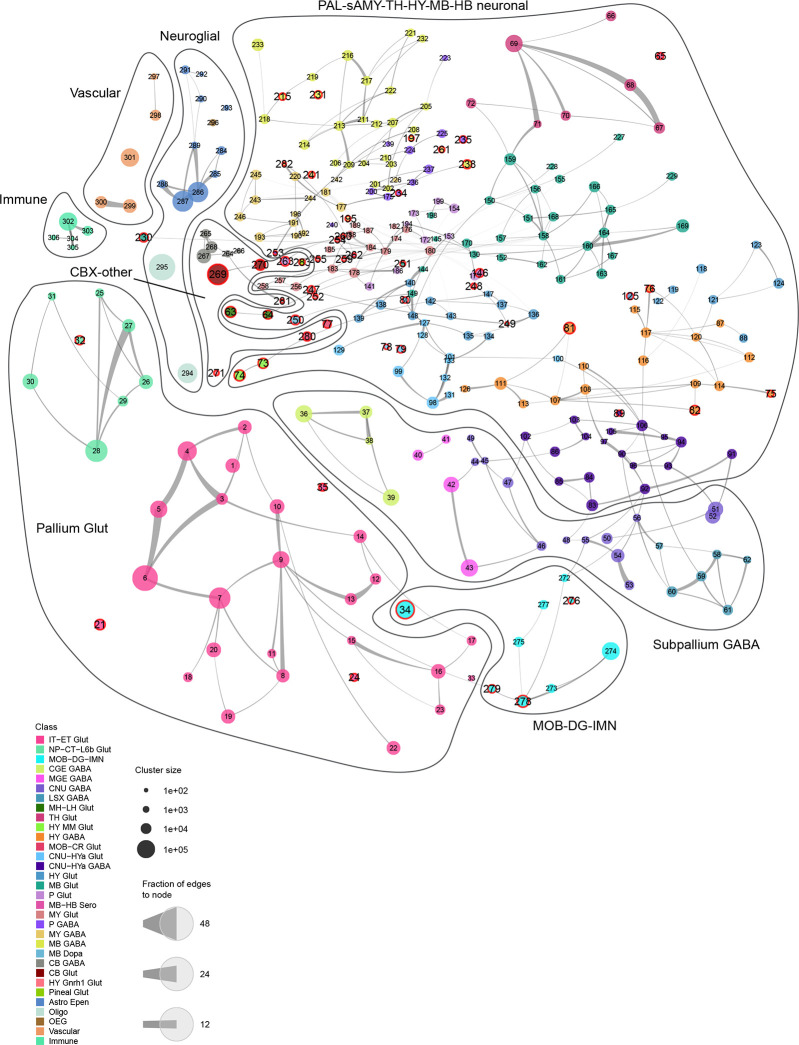
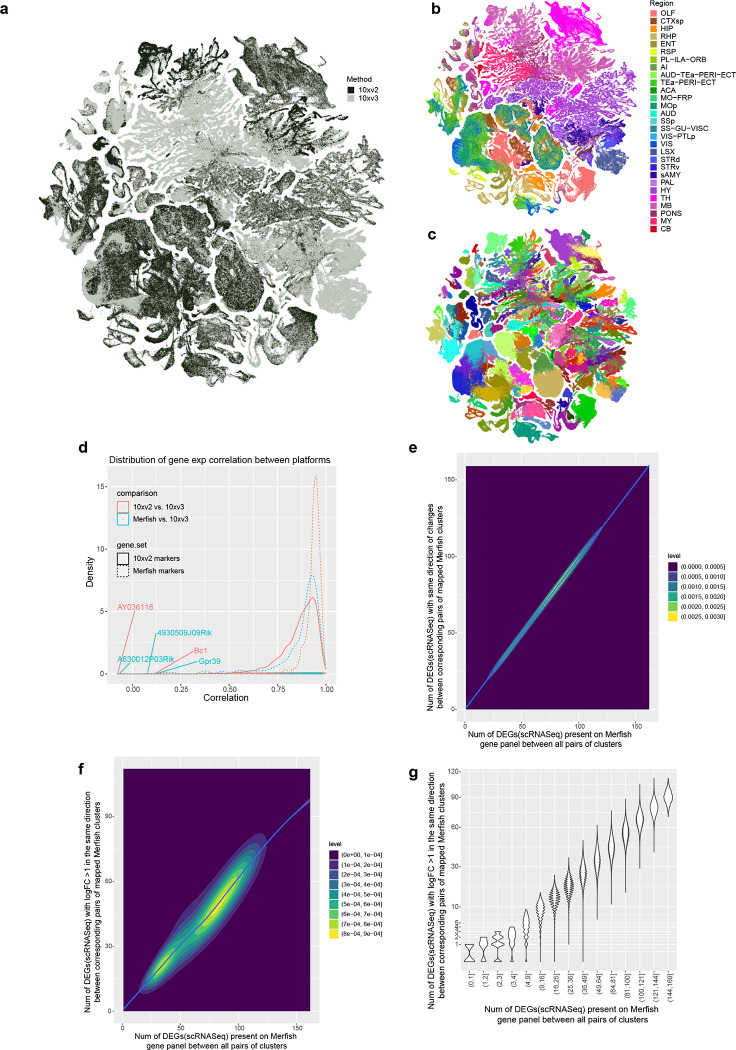
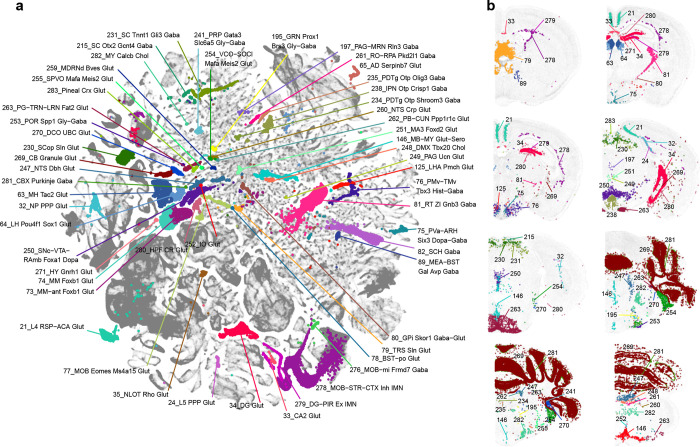
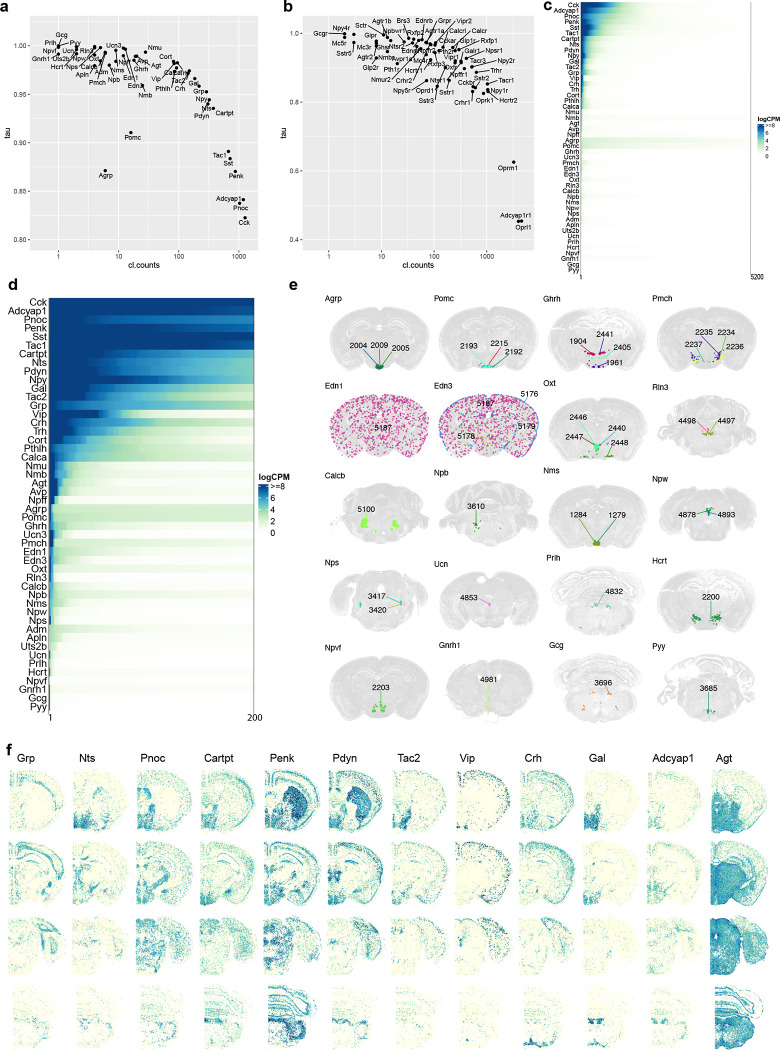
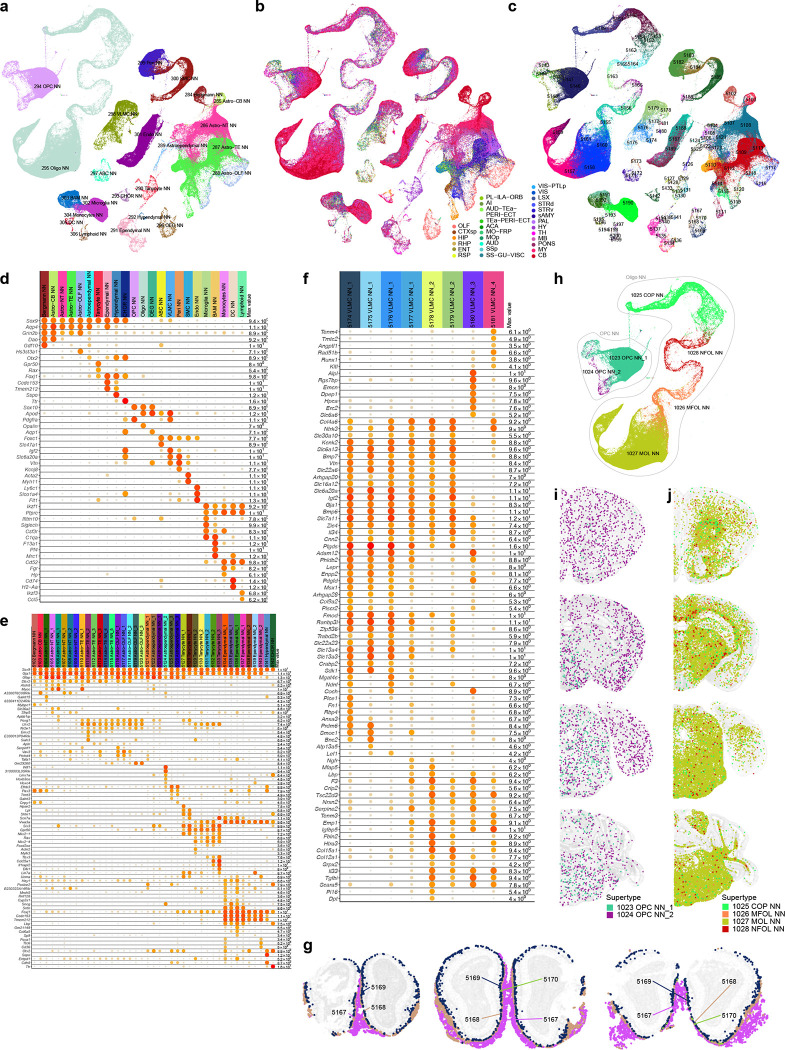
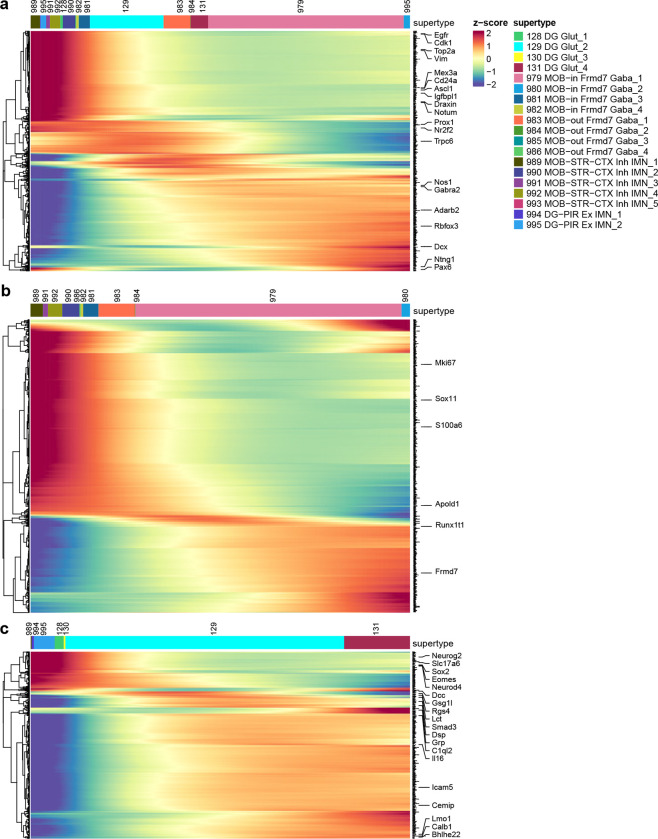
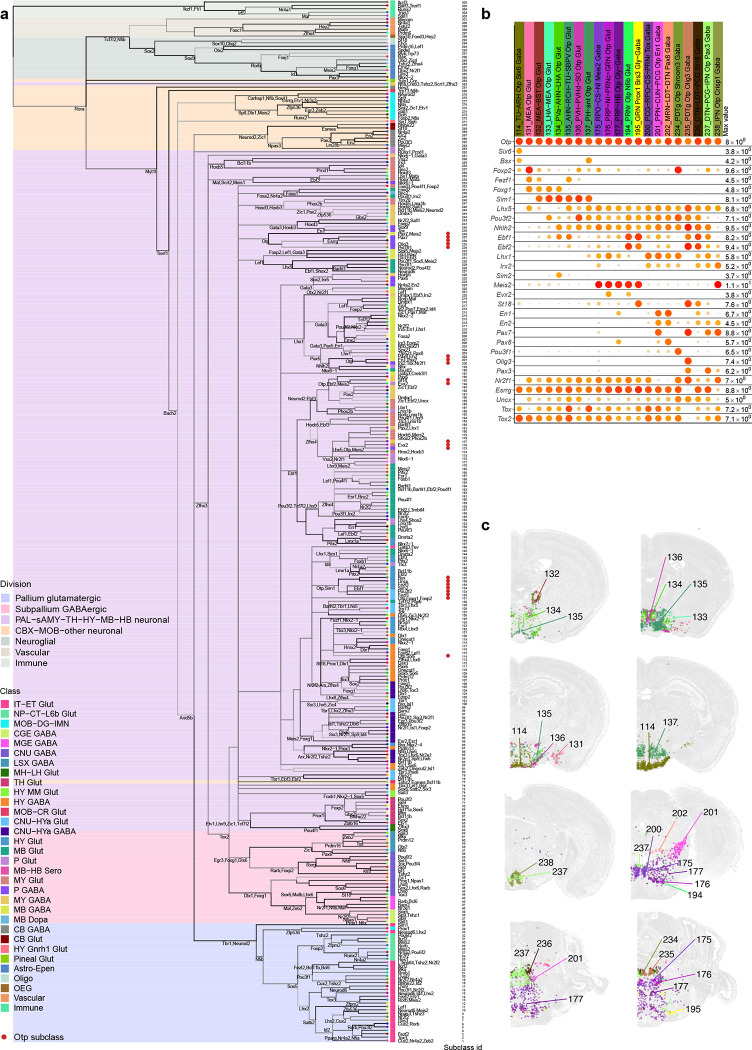
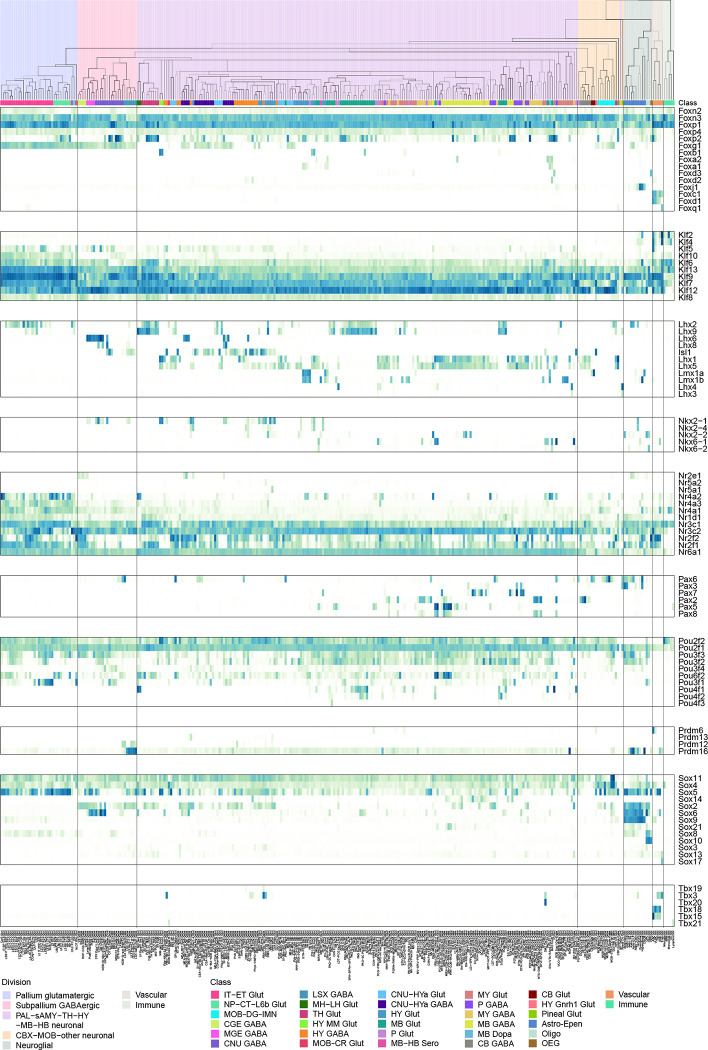
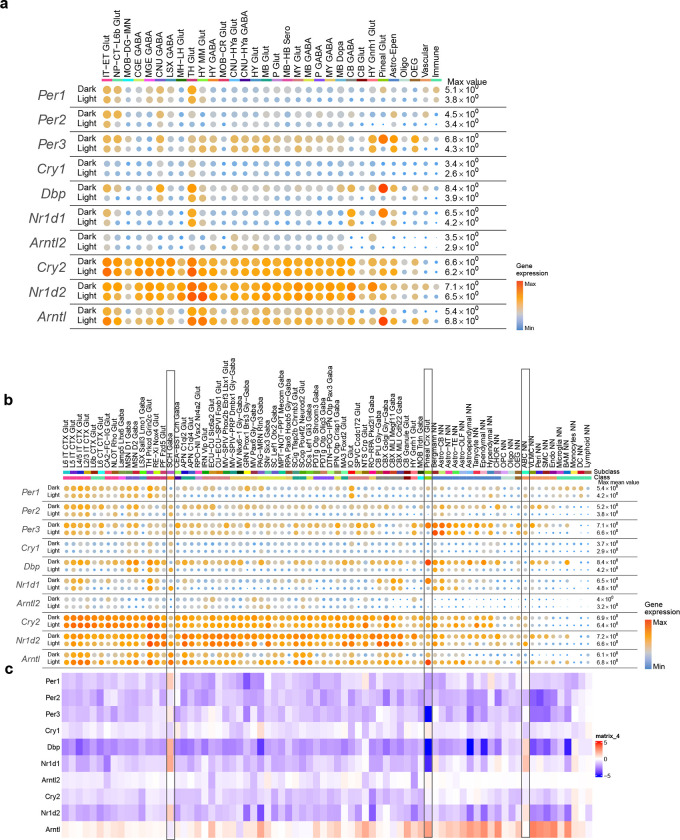
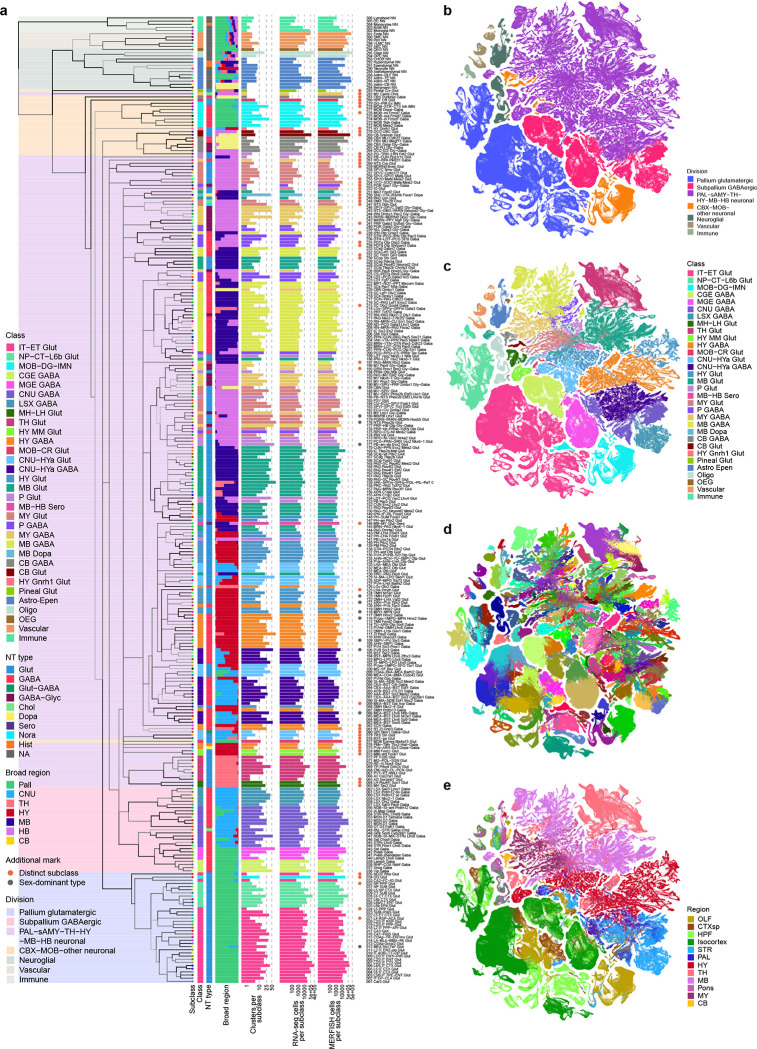
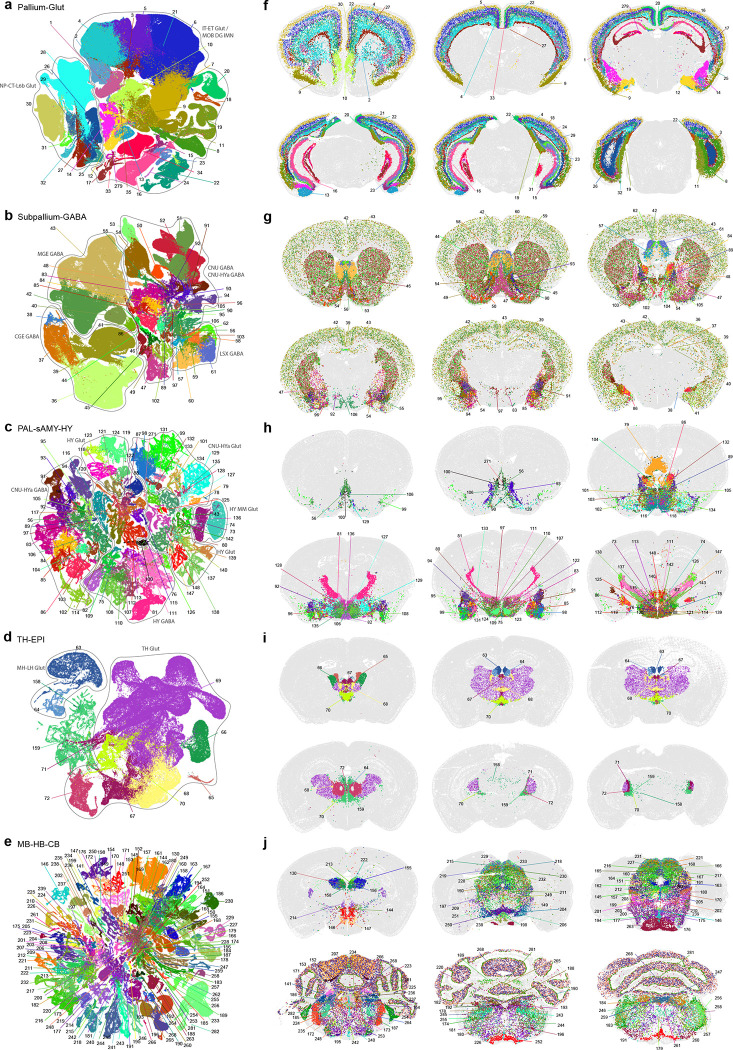
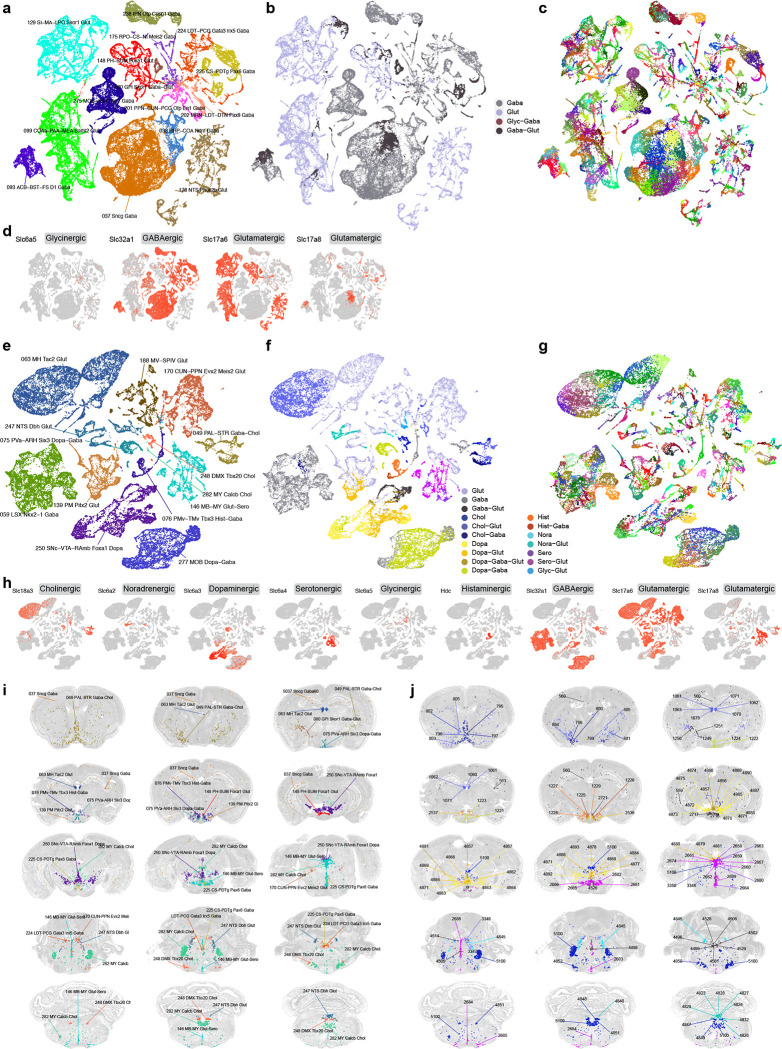
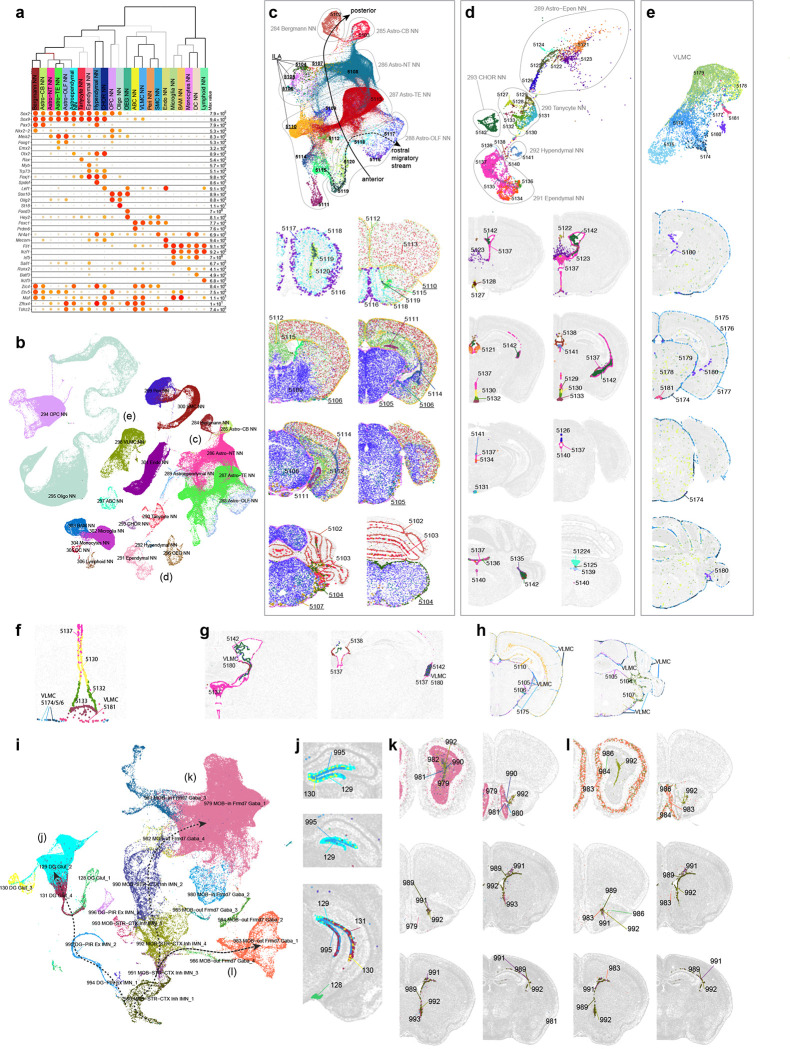
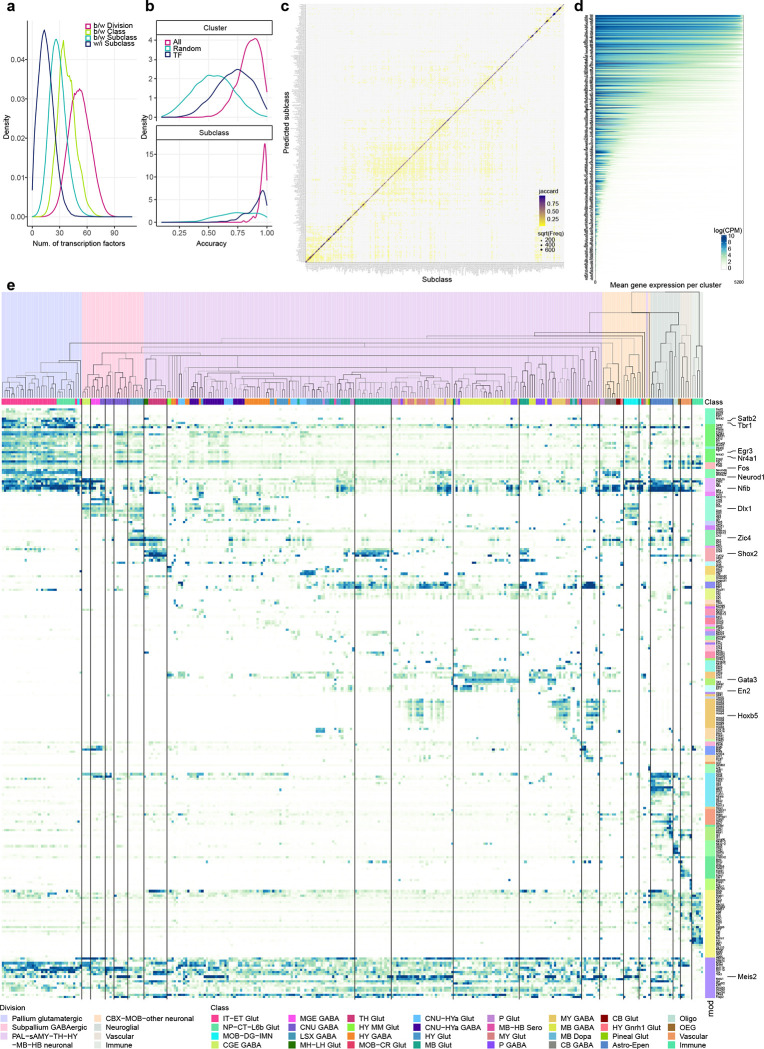
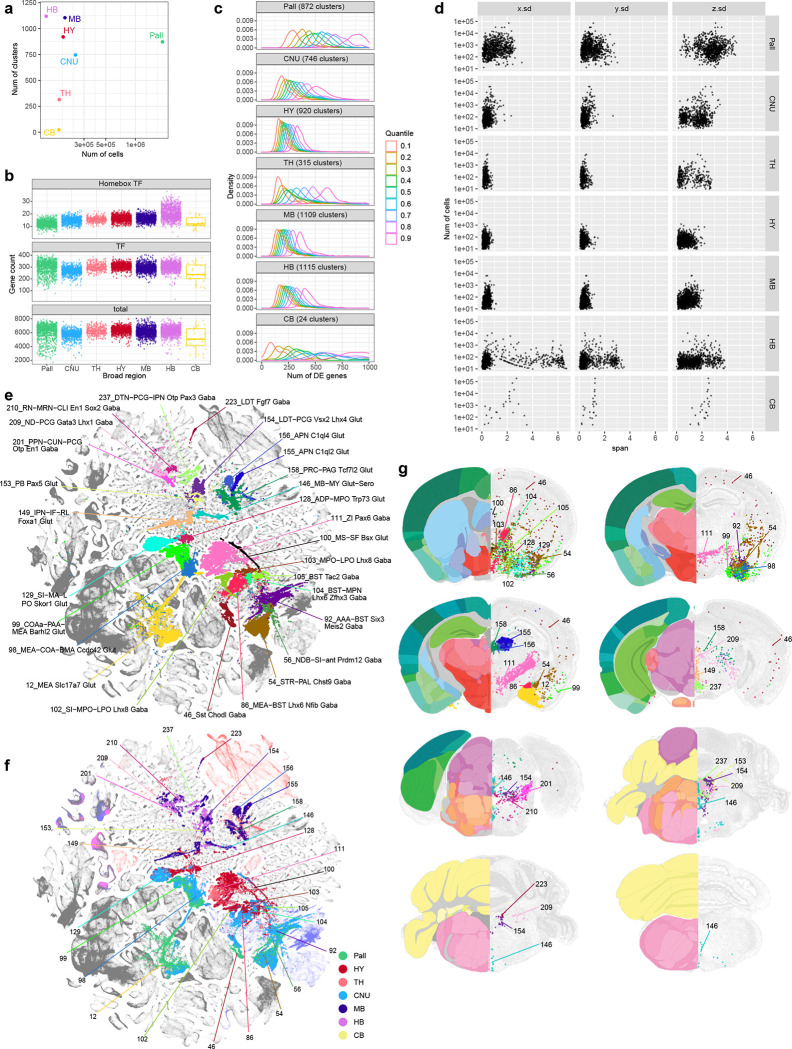
The mammalian brain is composed of millions to billions of cells that are organized into numerous cell types with specific spatial distribution patterns and structural and functional properties. An essential step towards understanding brain function is to obtain a parts list, i.e., a catalog of cell types, of the brain. Here, we report a comprehensive and high-resolution transcriptomic and spatial cell type atlas for the whole adult mouse brain. The cell type atlas was created based on the combination of two single-cell-level, whole-brain-scale datasets: a single-cell RNA-sequencing (scRNA-seq) dataset of ~7 million cells profiled, and a spatially resolved transcriptomic dataset of ~4.3 million cells using MERFISH. The atlas is hierarchically organized into five nested levels of classification: 7 divisions, 32 classes, 306 subclasses, 1,045 supertypes and 5,200 clusters. We systematically analyzed the neuronal, non-neuronal, and immature neuronal cell types across the brain and identified a high degree of correspondence between transcriptomic identity and spatial specificity for each cell type. The results reveal unique features of cell type organization in different brain regions, in particular, a dichotomy between the dorsal and ventral parts of the brain: the dorsal part contains relatively fewer yet highly divergent neuronal types, whereas the ventral part contains more numerous neuronal types that are more closely related to each other. We also systematically characterized cell-type specific expression of neurotransmitters, neuropeptides, and transcription factors. The study uncovered extraordinary diversity and heterogeneity in neurotransmitter and neuropeptide expression and co-expression patterns in different cell types across the brain, suggesting they mediate a myriad of modes of intercellular communications. Finally, we found that transcription factors are major determinants of cell type classification in the adult mouse brain and identified a combinatorial transcription factor code that defines cell types across all parts of the brain. The whole-mouse-brain transcriptomic and spatial cell type atlas establishes a benchmark reference atlas and a foundational resource for deep and integrative investigations of cell type and circuit function, development, and evolution of the mammalian brain.


Conflict of interest statement

Competing Interests X.Z. is a co-founder and consultant of Vizgen.

Figures

Extended Data Figure 1.
Extended Data Figure 1.. scRNA-seq data analysis workflow.
(a) Number of cells at each step in the scRNA-seq data analysis pipeline. The identification of doublets and low-quality clusters is described in more detail in Methods. The 10xv2 and 10xv3 data were first QC-ed and analyzed separately. After initial clustering the datasets were combined and QC-ed again before and after joint clustering. (b-c) Gene count and qc score thresholds used for each of the four major cell populations (neuroglial cells, neurons, immature neurons and granule cells, and other) on the 10xv2 (b) and 10xv3 (c) datasets. (d-e) Number of cells isolated from dissection ROI’s (pre-QC) and number of cells passing QC (post-QC) for 10xv2 (d) and 10xv3 (e) datasets. We didn’t profile LSX, STR, sAMY, PAL, Pons, MY, and CB by 10xv2. Some regions were collected using different dissections between 10xv2 and 10xv3, but all regions were covered by 10xv3.
Extended Data Figure 2.
Extended Data Figure 2.. MERFISH data generation, data processing and summary of results.
(a) Workflow for generating and processing MERFISH data. (b) Correlation of gene detection between MERFISH and bulk RNA-sequencing for four different brain regions. (c) Histogram displaying the distribution of gene detection correlation between adjacent MERFISH sections. (d-f) Violin plots displaying distribution of cell volumes (d), gene detection (e), and mRNA molecule detection (f) for individual sections ordered from anterior to posterior (left panel) or cumulative distribution for the whole brain (right panel). Red dashed lines indicate cutoff for filtering. (g) Cumulative histogram showing the relative contribution of each subclass to each section ordered from anterior to posterior. (h) Pie chart showing the proportion of cells in each major division across the whole brain.
Extended Data Figure 3.
Extended Data Figure 3.. Transcriptomic cell type taxonomy of the whole mouse brain with additional metadata information.
(a-b) Number of genes (a) or number of UMI’s (b) detected per cell in 10xv2 (top) or 10xv3 (bottom) datasets for each major cell division. The data shown is post-QC. (c) UMAP representation of all cell types colored by neurotransmitter (NT) type. NT type color code is the same as shown in (d). (d) The transcriptomic taxonomy tree of 306 subclasses organized in a dendrogram (same as Figure 1a). The color blocks divide the dendrogram into major cell divisions. From left to right, the bar plots represent cell class assignment, NT type assignment, heatmap showing expression of major neurotransmitter marker genes, sex distribution, platform distribution, light-dark distribution of profiled cells, and number of donors that contributed to each subclass.
Extended Data Figure 4.
Extended Data Figure 4.. Constellation plot of the global relatedness between subclasses.
Each subclass is represented by a disk, labeled by the subclass ID and positioned at the subclass centroid in UMAP coordinates shown in Figure 1d. The size of the disk corresponds to the number of cells within each subclass, and the edge weights correspond to the fraction of shared neighbors (see Methods) between subclasses. Each subclass is colored by the class it belongs to. Curved line bubbles drawn around subclasses outline the major divisions. Distinct subclasses are highlighted by the red rings around the disks.
Extended Data Figure 5.
Extended Data Figure 5.. Validation of data integration across 10xv2, 10xv3, and MERFISH datasets.
(a-c) UMAP representation of all cell types colored by profiling platform (a), region (b), and subclass (c). Other than the regions only profiled by 10xv3 (LSX, STR, sAMY, PAL, Pons, MY), the cells from both platforms integrate very well. Cell types in isocortex and HPF have a lot more 10xv2 cells, consistent with our sampling plan. (d) Correlation of gene expression between 10xv2 and 10xv3 and between 10xv3 and MERFISH. For each gene, we computed the Pearson correlation of its average expression in each cluster across clusters between 10xv2 and 10xv3, and the correlation between 10xv3 and MERFISH. For 10xv3 and MERFISH comparison, distribution of the correlation values of all 500 genes in the MERFISH panel is shown. For 10xv3 and 10xv2 comparison, we show the correlation of 5383 marker genes based on 10xv2, and 466 10xv2 marker genes that are also present on the MERFISH gene panel (the 34 MERFISH genes not shown are expressed in clusters not profiled by 10xv2). (e) 2D density plot showing on the X-axis the number of DEGs (based on 10xv3 dataset) present on the MERFISH gene panel between all pairs of clusters, and on the Y-axis the number of such DEGs showing the same direction of changes between corresponding pairs of mapped MERFISH clusters. Almost all the DEGs between all pairs of clusters show the same direction of changes between 10xv3 and MERFISH. (f) 2D density plot showing on the X-axis the number of DEGs (based on 10xv3 dataset) present on the MERFISH gene panel between all pairs of clusters, and on the Y-axis the number of such DEGs showing the same direction of changes, and logFC > 1 between corresponding pairs of mapped MERFISH clusters. About 60% of DEGs between all pairs of clusters based on 10xv3 show significant fold change (FC) in MERFISH. (g) Similar analysis as in (f) but shown as violin plot by binning the number of 10xv3 DEGs present on the MERFISH gene panel on the X-axis, with better resolution on closely related pairs with four or fewer DEGs present on MERFISH gene panels.
Extended Data Figure 6.
Highly distinct neuronal types across the brain. UMAP representation (a) and representative MERFISH sections (b) of highly distinct subclasses across the brain, colored by subclass.
Extended Data Figure 7.
Extended Data Figure 7.. Neuropeptide distribution across the whole mouse brain.
(a) Scatter plot of Tau score over the number of clusters each neuropeptide is expressed in at the level of logCPM > 3. The Tau score is a measurement of cell type specificity, which varies from 0 to 1 where 0 means uniformly expressed and 1 means highly specific to one type. (b) Scatter plot of Tau score over the number of clusters each peptide-liganded G-protein coupled receptor (GPCR) gene is expressed in at the level of logCPM > 3. (c) Expression level of neuropeptide (logCPM) per cluster. For each neuropeptide along the Y axis, clusters are sorted from the highest to lowest mean gene expression level along the X axis. (d) Expression level of neuropeptide (logCPM) per cluster. For each neuropeptide along the Y axis, clusters are sorted from the highest to lowest mean gene expression level along the X axis. For each gene, only the top 200 highest-expressing clusters out of 5,200 clusters are shown. (e) Representative MERFISH sections highlighting the spatial location of clusters expressing each of the 20 highly cell-type-specific neuropeptide genes (expressed in 8 or fewer clusters). (f) Representative MERFISH sections showing the expression of the neuropeptides present on the MERFISH gene panel that are widely expressed.
Extended Data Figure 8.
Extended Data Figure 8.. Additional non-neuronal UMAPs and marker genes.
(a-c) UMAP representation of non-neuronal cell types colored by subclass (a), region (b), and cluster (c). (d) Dot plot showing marker gene expression in non-neuronal subclasses. Dot size and color indicate proportion of expressing cells and average expression level in each subclass, respectively. (e) Dot plot showing marker gene expression in all clusters in the Astro-Epen class. Dot size and color indicate proportion of expressing cells and average expression level in each cluster, respectively. (f) Dot plot showing the marker gene expression in VLMC clusters. Dot size and color indicate proportion of expressing cells and average expression level in each cluster, respectively. (g) Representative MERFISH sections showing the spatial gradient of OEG clusters. (h) UMAP representation of OPCs and oligodendrocytes colored and labeled by supertype. (i-j) Representative MERFISH sections showing the spatial distribution of OPC (i) and Oligo (j) supertypes.
Extended Data Figure 9.
Extended Data Figure 9.. Gene expression patterns in immature neuron populations.
(a) Heatmap showing the gene expression changes as immature neurons transition to mature cell types, conserved between DG and MOB cell type development. Key markers at each stage of development are highlighted. (b) Heatmap showing the gene expression changes as immature neurons transition to mature cell types, specific to MOB cell types. (c) Heatmap showing the gene expression changes as immature neurons transition to mature cell types, specific to DG cell types.
Extended Data Figure 10.
Extended Data Figure 10.. Transcription factor code.
(a) The transcriptomic taxonomy tree of 306 subclasses organized in a dendrogram (same as Figure 1a). The color blocks divide the dendrogram into major cell divisions. The color bars denote classes. Key transcription factors are annotated for nodes and subclasses on the tree. Red dots mark the Otp expressing subclasses described in panels (b) and (c). (b) Gene expression dot plot of Otp expressing subclasses. Dot size and color indicate proportion of expressing cells and average expression level in each subclass, respectively. (c) Representative MERFISH sections highlighting the Otp expressing subclasses.
Extended Data Figure 11.
Extended Data Figure 11.. Transcription factor families.
Expression of key TFs for each subclass in the taxonomy tree, organized by TF gene families. The color blocks divide the dendrogram into major cell divisions. The color bars denote classes.
Extended Data Figure 12.
Extended Data Figure 12.. Circadian cycle associated expression changes in clock genes.
(a-b) Dot plot showing the expression of clock genes in light-phase and dark-phase cells within each cell class (a) or selected subclasses that have any clock genes with fold change logFC > 1 between light and dark phases (b). Dot size and color indicate proportion of expressing cells and average expression level in each class or subclass, respectively. (c) Heatmap showing the logFC difference between light and dark phases for clock genes in selected subclasses as in (b).
Figure 1.
Figure 1.. Transcriptomic cell type taxonomy of the whole mouse brain.
(a) The transcriptomic taxonomy tree of 306 subclasses organized in a dendrogram (10xv2: n = 1,708,450 cells; 10v3 n = 2,349,599 cells). The color blocks divide the dendrogram into major cell divisions. From left to right, the bar plots represent class, major neurotransmitter type, region distribution of profiled cells, number of clusters, number of RNA-seq cells, and number of MERFISH cells per subclass. The subclasses marked with orange dots represent highly distinct subclasses and ones marked with grey dots represent subclasses containing sex-dominant clusters. For each cell, 15 nearest neighbors in reduced dimension space were determined and summarized by subclass. Highly distinct subclasses were identified as those with no nearest neighbors assigned to other subclasses and/or those that formed a highly distinct branch on the taxonomy dendrogram. Sex-dominant clusters within a subclass were identified by calculating the odds and log P value for Male and Female distribution per cluster. Clusters with odds < 0.2 and logPval < −10 were marked as sex-dominant. (b-e) UMAP representation of all cell types colored by division (b), class (c), subclass (d), and brain region (e).
Figure 2.
Figure 2.. Neuronal cell type classification and distribution across the brain.
UMAP representation (a-e) and representative MERFISH sections (f-j) of Pallium glut (a,f), Subpallium GABA (b,g), PAL-sAMY-HY (c,h), TH-EPI (d,i), and MB-HB-CB (e,j) neighborhoods colored by subclass. Each subclass is labeled by its ID and shown in the same color between UMAPs and MERFISH sections. Outlines in (a-d) show cell classes. For full subclass names see Supplementary Table 7.
Figure 3.
Figure 3.. Neurotransmitter types and their distribution throughout the mouse brain.
(a-c) UMAP representation of neuronal subclasses containing clusters releasing glutamate-GABA dual transmitters. UMAPs are colored by subclass (a), neurotransmitter type (b), and cluster (c). Glutamate-GABA co-releasing clusters include clusters 559, 560, 563 in subclass 37, cluster 566 in subclass 38, clusters 1249, 1250, 1251 in subclass 80, clusters 1498, 1499 in subclass 93, clusters 1571, 1592, 1593 in subclass 99, clusters 2307, 2308 in subclass129, clusters 2716, 2717, 2721 in subclass 148, clusters 3469, 3480, 3482 in subclass 175, cluster 3609 in subclass 178, cluster 4073 in subclass 201, cluster 4089 in subclass 202, clusters 4496, 4498, 4499, 4501, 4502, 4505, 4506, 4514 in subclass 224, clusters 4526, 4528, 4529 in subclass 225, cluster 4653 in subclass 238, and cluster 5041 in subclass 275. Clusters in italic are shown in MERFISH sections in (j). (d) UMAPs representing the expression of neurotransmitter transporter genes for glutamate, GABA and glycine. (e-g) UMAP representation of neuronal subclasses containing clusters releasing modulatory neurotransmitters and their various combinations of co-releasing with glutamate and/or GABA. UMAPs are colored by subclass (e), neurotransmitter type (f), and cluster (g). Cholinergic neurons include clusters 795 (co-release w/ GABA), 796, 797 (w/ GABA), 798 (w/ GABA), 799 (w/ glut), 800 (w/ GABA), 801, 802, 803–805 (all w/ glut) in subclass 49; cluster 958 (w/ GABA) in subclass 59; clusters 1060–1063, 1070, 1071 and 1075 (all w/ glut) in subclass 63; clusters 3322, 3346, 3347, 3348, 3349, 3350 (all w/ glut except 3349) in subclass 170; cluster 3939 (w/ glut) in subclass 188; clusters 4847–4852 in subclass 248; and cluster 5100 in subclass 282. Dopaminergic neurons include clusters 1221–1224 (all w/ GABA) in subclass 75; clusters 2536 and 2537 (both w/ glut) in subclass 139; clusters 4856 (w/ glut-GABA), 4857 (w/ glut-GABA), 4860 (w/ glut-GABA), 4862 (w/ glut), 4863–4865, 4866 (w/ glut), 4867, 4868 (w/ glut), 4869 (w/ glut), 4870 (w/ GABA), 4871–4875, 4876 (w/ GABA), 4877–4880 (all w/ glut), 4881, 4883–4886 (all w/ glut), 4887–4890, 4891 (w/ glut-GABA), 4892, 4893 in subclass 250; and clusters 5047, 5048, 5050, 5055 (all w/ GABA) in subclass 277. Histaminergic neurons include clusters 1225 (w/ GABA), 1226 (w/ GABA), and 1227–1229 in subclass 76. Noradrenergic neurons include clusters 4823, 4824, 4826–4829, 4832 and 4840 (all w/ glut), as well as 4845 in subclass 247. Serotonergic neurons include clusters 2658, 2659, 2660–2662 (all w/ glut), 2663, 2664, 2665–2667 (all w/ glut), 2674 (w/ glut), 2680, 2681–2685 (all w/ glut), 2688 (w/ glut), and 2689 (w/ glut) in subclass 146. Clusters in italic are shown in MERFISH sections in (j). (h) UMAPs representing the expression of genes for glutamate, GABA and modulatory neurotransmitters. (i-j) Representative MERFISH sections showing the location of neuronal types with glutamate-GABA dual transmitters and those with modulatory neurotransmitters. Cells in (i) are colored and labeled by subclasses. Cells in (j) are colored by neurotransmitter/neuromodulator types and labeled by cluster IDs. See Supplementary Table 7 for detailed neurotransmitter assignment for each cluster.
Figure 4.
Figure 4.. Non-neuronal cell types and immature neuronal types.
(a) Dot plot showing the transcription factor marker gene expression in non-neuronal subclasses. Dot size and color indicate proportion of expressing cells and average expression level in each subclass, respectively. (b) UMAP representation of non-neuronal cell types colored by subclass. Three subpopulations are highlighted and further investigated: astrocytes (c), ependymal cells (d), and VLMC (e). (c-e) UMAP representation and representative MERFISH sections of astrocytes (c), ependymal cells (d), and VLMC (e) colored and numbered by cluster. Outlines in (c-d) UMAPs show subclasses. (f) Co-localization of VLMC cluster 5181 with Tanycyte cluster 5133 on the MERFISH section. (g) Co-localization of VLMC cluster 5180 with CHOR cluster 5142 and Ependymal clusters 5137 and 5138. (h) Co-localization of VLMCs with Interlaminar astrocytes (ILA). (i) UMAP representation of immature neuron populations colored by supertype. Maturation trajectories in dentate gyrus (DG) (j), inner main olfactory bulb (k), and outer main olfactory bulb (l) are highlighted. (j-l) Representative MERFISH sections showing location of immature neuronal supertypes from the three trajectories.
Figure 5.
Figure 5.. Transcription factor modules across the whole mouse brain.
(a) Distribution of the number of differentially expressed TFs between divisions (pink), between classes (apple green), between subclasses (sea green), and within subclasses (dark blue). (b) Cross validation accuracy for each cluster (top panel) or subclass (bottom panel) using classifiers built based on all 8,108 marker genes (pink), randomly selected 499 marker genes (sea green), or 499 TF marker genes (dark blue). (c) Confusion matrix between the assigned and predicted subclasses using classifiers trained on 499 TF markers in cross validation. The size of the dots corresponds to the number of overlapping cells, and the color corresponds to the Jaccard similarity score between the assigned and predicted subclasses. (d) Expression level of TFs (logCPM) per cluster. For each TF along the Y axis, clusters are sorted from the highest to lowest mean gene expression level along the X axis. (e) Expression of key TFs for each subclass in the taxonomy tree, organized in gene modules (mod) shown as color bars on the right. The color blocks divide the dendrogram into major cell divisions. The color bars below the dendrogram denote classes.
Figure 6.
Figure 6.. Region specific features and transitional cell types.
. (a) Scatterplot showing the number of neuronal clusters identified per region vs. the number of neuronal cells profiled within the corresponding region. Each neuronal cluster is assigned to the most dominant region. (b) Distribution of the number of genes detected per neuronal cluster per region with logCPM > 3. The top panel shows the number of Homeobox TFs per cluster per region, the middle panel shows the number of all TFs expressed per cluster per region, and the bottom panel shows the number of any gene expressed per cluster per region. (c) Distribution of the number of DEGs between every pair of neuronal clusters within each region, split at quantiles of 0.1, 0.2, …, and 0.9. The curves show the spread of the number of DEGs between more similar types at 0.1 quantile vs. the more distinct types at 0.9 quantile. (d) Scatterplot showing the number of cells mapped to a given neuronal cluster vs. the standard deviation of their 3D coordinates along the X (medial-lateral), Y(dorsal-ventral), and Z (anterior-posterior) axis based on the MERFISH dataset, stratified by the regions. The plot shows how localized the clusters are within each region along each spatial axis. (e-g) UMAP representation (e-f) and representative MERFISH sections (g) of subclasses shared between broad regions, (e,g) colored by subclass, and (f) colored by region. In (g) the best matching CCF reference atlas is shown on the left side of the MERFISH sections.

References

    1. Petilla Interneuron Nomenclature Group et al. Petilla terminology: nomenclature of features of GABAergic interneurons of the cerebral cortex. Nature reviews 9, 557–568, doi:10.1038/nrn2402 (2008). - DOI - PMC - PubMed
    1. Sanes J. R. & Masland R. H. The types of retinal ganglion cells: current status and implications for neuronal classification. Annual review of neuroscience 38, 221–246, doi:10.1146/annurev-neuro-071714-034120 (2015). - DOI - PubMed
    1. Yuste R. et al. A community-based transcriptomics classification and nomenclature of neocortical cell types. Nature neuroscience 23, 1456–1468, doi:10.1038/s41593-020-0685-8 (2020). - DOI - PMC - PubMed
    1. Zeng H. What is a cell type and how to define it? Cell 185, 2739–2755, doi:10.1016/j.cell.2022.06.031 (2022). - DOI - PMC - PubMed
    1. Zeng H. & Sanes J. R. Neuronal cell-type classification: challenges, opportunities and the path forward. Nature reviews 18, 530–546, doi:10.1038/nrn.2017.85 (2017). - DOI - PubMed

Publication types