[Preprint]. 2023 Mar 28:rs.3.rs-2650312.
doi: 10.21203/rs.3.rs-2650312/v1.

Biochemical activity induced by a germline variation in KLK3 (PSA) associates with cellular function and clinical outcome in prostate cancer

Srilakshmi Srinivasan  1   2 Thomas Kryza  3 Nathalie Bock  1   2 Brian Wc Tse  4 Kamil A Sokolowski  4 Janaththani Panchadsaram  1   2 Leire Moya  1   2 Carson Stephens  1   2 Ying Dong  1 Joan Röhl  1 Saeid Alinezhad  1   2 Ian Vela  1   5 Joanna L Perry-Keene  6 Katie Buzacott  6 IMPACT StudyManuela Gago-Dominguez  7 PROFILE Study Steering CommitteeJohanna Schleutker  8   9 Christiane Maier  10 Kenneth Muir  11   12 Catherine M Tangen  13   14 Henrik Gronberg  15 Nora Pashayan  16   17 Demetrius Albanes  18 Alicja Wolk  19   20 Janet L Stanford  21   22 Sonja I Berndt  18 Lorelei A Mucci  23 Stella Koutros  18 Olivier Cussenot  24 Karina Dalsgaard Sorensen  25   26 Eli Marie Grindedal  27 Timothy J Key  28 Christopher A Haiman  29 Graham G Giles  30   31 Ana Vega  32   33 Fredrik Wiklund  15 David E Neal  34   35 Manolis Kogevinas  36   37   38   39 Meir J Stampfer  40 Børge G Nordestgaard  41   42   43 Hermann Brenner  44   45   46 Marija Gamulin  47 Frank Claessens  48 Olle Melander  49 Anders Dahlin  49 Pär Stattin  20 Göran Hallmans  50 Christel Häggström  20   51 Robert Johansson  51 Elin Thysell  52 Ann-Charlotte Rönn  53 Weiqiang Li  54 Nigel Brown  55 Goce Dimeski  55 Benjamin Shepherd  56 Tokhir Dadaev  57 Mark N Brook  57 Amanda B Spurdle  58 Ulf-Håkan Stenman  59 Hannu Koistinen  59 Zsofia Kote-Jarai  57   60 Robert J Klein  54 Hans Lilja  34   61   62 Rupert C Ecker  1   2   63 Rosalind Eeles  57   60 Practical ConsortiumAustralian Prostate Cancer BioResourceJudith Clements  1   2 Jyotsna Batra  1   2   64
Affiliations

Biochemical activity induced by a germline variation in KLK3 (PSA) associates with cellular function and clinical outcome in prostate cancer

Srilakshmi Srinivasan et al. Res Sq. .

Update in

  • A PSA SNP associates with cellular function and clinical outcome in men with prostate cancer.
    Srinivasan S, Kryza T, Bock N, Tse BWC, Sokolowski KA, Janaththani P, Fernando A, Moya L, Stephens C, Dong Y, Röhl J, Alinezhad S, Vela I, Perry-Keene JL, Buzacott K, Nica R; IMPACT Study; Gago-Dominguez M; PROFILE Study Steering Committee; Schleutker J, Maier C, Muir K, Tangen CM, Gronberg H, Pashayan N, Albanes D, Wolk A, Stanford JL, Berndt SI, Mucci LA, Koutros S, Cussenot O, Sorensen KD, Grindedal EM, Travis RC, Haiman CA, MacInnis RJ, Vega A, Wiklund F, Neal DE, Kogevinas M, Penney KL, Nordestgaard BG, Brenner H, John EM, Gamulin M, Claessens F, Melander O, Dahlin A, Stattin P, Hallmans G, Häggström C, Johansson R, Thysell E, Rönn AC, Li W, Brown N, Dimeski G, Shepherd B, Dadaev T, Brook MN, Spurdle AB, Stenman UH, Koistinen H, Kote-Jarai Z, Klein RJ, Lilja H, Ecker RC, Eeles R; Practical Consortium; Australian Prostate Cancer BioResource; Clements J, Batra J. Srinivasan S, et al. Nat Commun. 2024 Nov 6;15(1):9587. doi: 10.1038/s41467-024-52472-6. Nat Commun. 2024. PMID: 39505858 Free PMC article.

Abstract

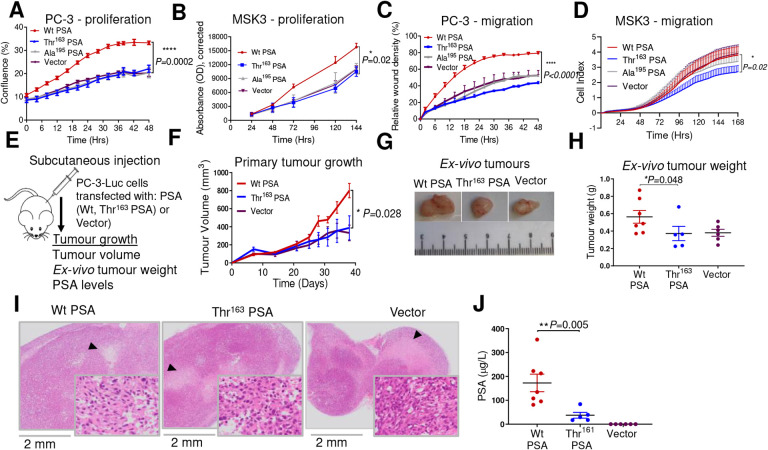
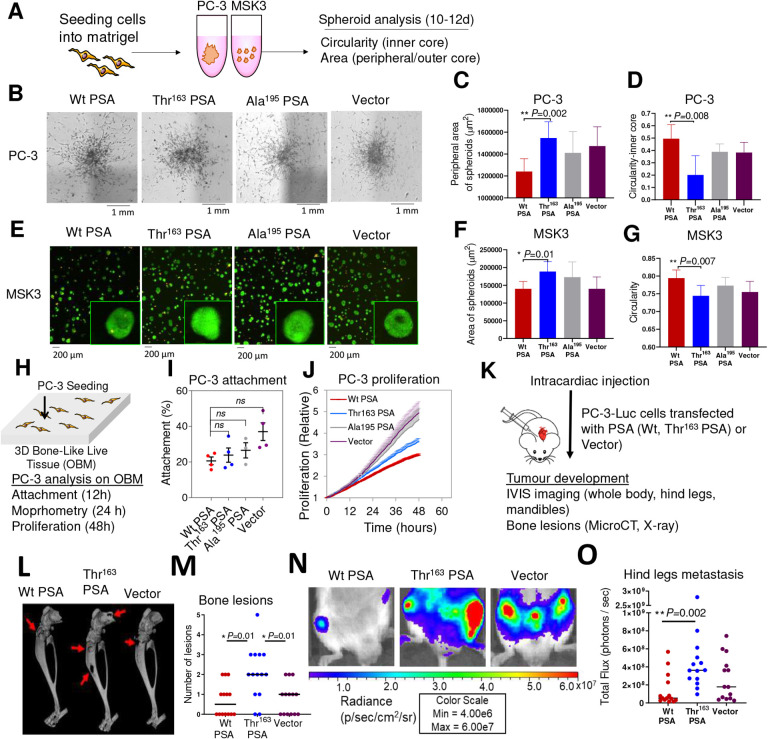
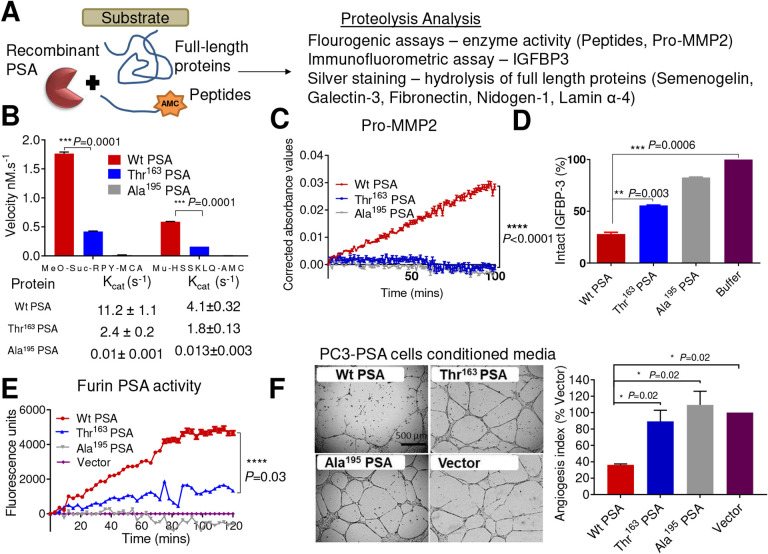
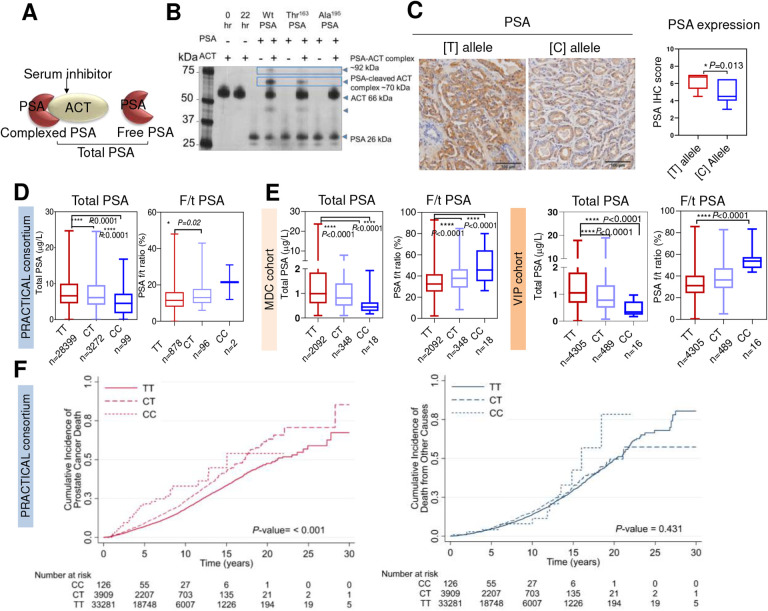
Genetic variation at the 19q13.3 KLK locus is linked with prostate cancer susceptibility. The non-synonymous KLK3 SNP, rs17632542 (c.536T>C; Ile163Thr-substitution in PSA) is associated with reduced prostate cancer risk, however, the functional relevance is unknown. Here, we identify that the SNP variant-induced change in PSA biochemical activity as a previously undescribed function mediating prostate cancer pathogenesis. The 'Thr' PSA variant led to small subcutaneous tumours, supporting reduced prostate cancer risk. However, 'Thr' PSA also displayed higher metastatic potential with pronounced osteolytic activity in an experimental metastasis in-vivo model. Biochemical characterization of this PSA variant demonstrated markedly reduced proteolytic activity that correlated with differences in in-vivo tumour burden. The SNP is associated with increased risk for aggressive disease and prostate cancer-specific mortality in three independent cohorts, highlighting its critical function in mediating metastasis. Carriers of this SNP allele had reduced serum total PSA and a higher free/total PSA ratio that could contribute to late biopsy decisions and delay in diagnosis. Our results provide a molecular explanation for the prominent 19q13.3 KLK locus, rs17632542 SNP, association with a spectrum of prostate cancer clinical outcomes.

Keywords: Kallikrein-related peptidase 3/KLK3; Prostate cancer; diagnosis; disease aggressiveness; prostate-specific antigen/PSA; single nucleotide polymorphism.


Conflict of interest statement

HL holds patents for free PSA, hK2, and intact PSA assays, and is named on a patent for a statistical method to detect prostate cancer. The marker assay patents and the patent for the statistical model has been licensed and commercialized as the 4Kscore by OPKO Diagnostics. HL receives royalties from sales of this test and owns stock in OPKO. All the other authors declare no conflict of interest.

Figures

Figure 1.
Figure 1.
Thr163 PSA abolished the effect of PSA on PC-3 cell proliferation and migration and is associated with reduced growth of primary tumours in-vivo PC-3 and MSK3 cells were transfected with furin activated Wt PSA, Thr163 PSA or control plasmid (vector). A) Proliferation rate (confluence %) monitored in the IncuCyte live cell imaging system for PC3 cells expressing PSA variants and vector control over 48 h. Data were consistent across the three independent experiments. B) Proliferation of MSK3-PSA and vector control cells, measured by Prestoblue cell viability assays. C) Cell migration rate (relative wound density %) measured by the IncuCyte live cell imaging system for PC-3 cells expressing PSA variants compared to vector control over 48 h. D) Cell migration measured using the xCELLigence system for the PSA variant expressing MSK3 cells as compared to vector control. Three replicates were included unless otherwise indicated from three independent experiments. Data were consistent across the three independent experiments. Data are represented as mean ± SEM. Statistical significance for all these assays were analysed by Friedman test with Dunn’s multiple comparison test. E) Preclinical subcutaneous xenograft tumour model of PC-3-Luc cells transfected with furin activated Wt PSA, Thr163 PSA or vector (n=7 mice/group). F) Mean volume ± SEM of subcutaneous tumours throughout the experiment, based on caliper measurements (mean ± SEM) (Dunnett’s multiple comparisons test). G) Representative photographs of resected subcutaneous tumours. H) Scatter plot of post-mortem weight of subcutaneous tumours at day 38; horizontal line indicates mean value (mean±SEM) (Mann-Whitney test). I) H&E staining of resected subcutaneous tumours. J) Serum concentration of total PSA at endpoint (mean±SEM) (Mann-Whitney test).
Figure 2.
Figure 2.
Thr163 PSA increased cancer cell invasive ability and increased metastasis in-vivo A) Schematic workflow of spheroid assay. B) Representative brightfield microscope images (4X magnification) of 3D spheroids formed by transfected PC-3 cells after 14 days of culture. C) Peripheral area (μm)2 of invading cells outside the outer core. Also see Supplementary Figure 2A. D) Measure of invasiveness of the spheroid from 0 – 1. A circularity value of 1 (maximum) indicates the spheroid is perfectly circular and least invasive, while a decreasing value towards 0 indicates less circular spheroids. (N = 6 spheroids per condition) E) Representative fluorescent microscopy overlay images (10× magnification) of transfected MSK3 cells at 10 days with a magnified view. MSK3 cells were stained with calcein-AM (live cells, green) and ethidium heterodimer (dead cells, orange). Spheroid, Area (μm)2 (F) and circularity (G) were measured. Also see Supplementary Figures 2B, 2C. At least two replicates (2 fields selected per well) from three independent experiments were analysed (Mann Whitney t-test). H) Schematic of a 3D osteoblast-derived bone matrix (OBM) co-culture with PC-3 cells, and the various analyses performed. I) Attachment of PC-3-mKO2 cells transfected with furin activated Wt PSA, Thr163 PSA, Ala195 PSA, or vector cells to OBM constructs after 12h co-culture. J) PC-3 proliferation on OBM constructs. Also see Supplementary Figures 3A, 3B. For J, 2 technical replicates were used, 4–5 fields of view/replicate, for a total of 120–230 cells per condition. P values on all groups were evaluated by one-way ANOVA followed by Games-Howell post hoc analysis. K) Intracardiac injection of PC-3-Luc-PSA cells in mice (n=7 mice/group). L) Reconstructed 3D microCT images of tumour-bearing hind legs from representative mice of each group; red arrows showing areas of significant bone degradation, indicating presence of tumour. M) Quantification of bone lesions per hind leg based on visual inspection of planar X-ray images (Dunnett’s multiple comparisons test with Two-way Anova). N) Representative bioluminescence images of tumour-bearing hind legs of mice (week 4). O) Scatter plots of tumour bioluminescence based on region of interest (ROI) drawn over individual hind legs (at week 4); horizontal line indicates median value (Dunnett’s multiple comparisons test). Also see Supplementary Figure 4.
Figure 3.
Figure 3.
Biochemical characterization of the effect of the Thr163 variant on PSA activity. A) Schematic for PSA proteolytic activity analysis. B) Rate of hydrolysis by mature PSA proteins (Wt PSA, Thr163 PSA, and catalytically inactive mutant control Ala195 PSA, all at 0.1 μM) were compared using the peptide substrates MeO-Suc-RPY-MCA (10 μM) and Mu-HSSKLQ-AMC (1 μM) over 4 h at 37°C. Proteolytic activity derived from assaying a constant amount of PSA with increasing concentration (0–250 mM) for these two substrates were used to estimate Kcat values using nonlinear regression analysis in Graphpad Prism. Results are shown as the mean ± SEM from two experiments, each with three replicates (Welch’s t-test ***P=0.0001). Also see Supplementary Figure 5B. C) Time (mins) versus relative absorbance (OD) corrected to the substrate alone controls was plotted indicating the activity of pro-MMP2 (0.14 μM) when pre-incubated with PSA protein variants (Wt, Thr163 and Ala195 at 0.07 μM) at 37°C and then the activity analysed with the chromogenic substrate (Ac-PLG-[2-mercapto-4-methyl-pentanoyl]-LG-OC2H5, 40 μM) for active MMP2 over 2 h. Results are shown as the mean ± SEM of three experiments analysed using Kruskal-Wallis test. ****P<0.0001. D) Intact/total IGFBP-3 (2.2 μM) after 24h incubation at 37°C with PSA variants (0.25 μM) as shown relative to IGFBP-3 control without added PSA. Also see Supplementary Figure 5C. Results are shown as mean ± SEM (n=3, Welch’s t-test, **P=0.003 and ***P=0.0006). E) Fluorescent activity observed for the furin generated active PSA captured from serum free conditioned media of furin-PSA overexpressing PC-3 cells (Wt, Thr163, inactive mutant Ala195 and vector) using the peptide substrate MeO-Suc-RPY-MCA. (n=2, Mean ± SEM *P=0.03). F) Inhibition of HUVEC tube formation on Matrigel by treatment of HUVECs with serum free conditioned media from the PC-3 cells overexpressing (Wt, Thr163 and Ala195 PSA) and PBS control (negative). Scale bar is 500 μm. The graph to the right represents the effect of these PSA protein variants on HUVEC tube formation expressed as an angiogenesis index. The angiogenesis index, reflecting the extent of tube formation or angiogenic potential of the cells 39,53 is shown in relation to the control (mean + SEM, *P=0.02 as compared to control (t-test), n=2). Also see Supplementary Figure 5D.
Figure 4.
Figure 4.
rs17632442 SNP association with PSA levels and prostate cancer survival. A) PSA-inhibitor (ACT) complex, free and total PSA. B) A representative silver stain analysis of recombinant wild type (Wt) and Thr163 and Ala195 PSA (0.1 μM) incubated with ACT (0.5 μM) at room temperature for 3 h before resolving on gel showed lower complexing potential of Thr163 PSA with ACT compared to the Wt PSA. Inactive mutant Ala195 does not complex with ACT. C) Representative immunohistochemical results for Gleason Grade 4 adenocarcinoma tissues, showing strong staining for PSA for the TT compared to the CC genotype. Graph on the right shows difference in PSA expression scores between [T] and [C] allele (CC=2, CT=10, TT=10) for the immunohistochemical samples. D-E) Genotype correlation of total PSA (tPSA) levels and f/t PSA ratio in prostate cancer cases (PRACTICAL consortium) and disease-free controls (MDC and VIP cohorts). D) PRACTICAL consortium. N= 31,770; genotype status TT=28,399, CT=3,272 and CC=99 for tPSA levels comparison. N=976; genotype status TT=878, CT=96 and CC=2 for f/t PSA ratio comparison. E) MDC cohort with genotype status TT=2,092, CT=348 and CC=18; and VIP cohort with genotype status TT=4,305, CT=489 and CC=16. (****P<0.0001, Kruskal-Wallis Test). F) Survival analysis for the rs17632542 SNP (c.536T>C) in 37,316 cases of PRACTICAL consortium with follow-up on cause specific death. Of these, 4,629 died of prostate cancer, 3,456 died of other causes. Cases by carrier status, TT=33,281, CT=3,909 and CC=126. The cumulative incidence of death from prostate cancer, Hazards ratio (HR)=1.33, 95% CI=1.24–1.45, P<0.001 (left panel) and all causes other than prostate cancer, HR=1.08, 95% CI=0.98–1.19, P=0.431 (right panel) are indicated. Number at risk are also indicated.

References

    1. Carter H. B. Prostate-Specific Antigen (PSA) Screening for Prostate Cancer: Revisiting the Evidence. Jama 319, 1866–1868, doi:10.1001/jama.2018.4914 (2018). - DOI - PubMed
    1. Schroder F. H. et al. Screening and prostate cancer mortality: results of the European Randomised Study of Screening for Prostate Cancer (ERSPC) at 13 years of follow-up. Lancet 384, 2027–2035, doi:10.1016/S0140-6736(14)60525-0 (2014). - DOI - PMC - PubMed
    1. Kovac E. et al. Association of Baseline Prostate-Specific Antigen Level With Long-term Diagnosis of Clinically Significant Prostate Cancer Among Patients Aged 55 to 60 Years A Secondary Analysis of a Cohort in the Prostate, Lung, Colorectal, and Ovarian (PLCO) Cancer Screening Trial. Jama Netw Open 3, doi:10.1001/jamanetworkopen.2019.19284 (2020). - DOI - PMC - PubMed
    1. Lilja H. et al. Prostate-specific antigen in serum occurs predominantly in complex with alpha 1-antichymotrypsin. Clin Chem 37, 1618–1625 (1991). - PubMed
    1. Catalona W. J. et al. Use of the percentage of free prostate-specific antigen to enhance differentiation of prostate cancer from benign prostatic disease: a prospective multicenter clinical trial. Jama 279, 1542–1547 (1998). - PubMed

Publication types