[Preprint]. 2023 Mar 28:2023.03.27.534413.
doi: 10.1101/2023.03.27.534413.

Altered muscle niche contributes to myogenic deficit in the D2- mdx model of severe DMD

Affiliations

Altered muscle niche contributes to myogenic deficit in the D2- mdx model of severe DMD

Davi A G Mázala et al. bioRxiv. .

Update in

Abstract

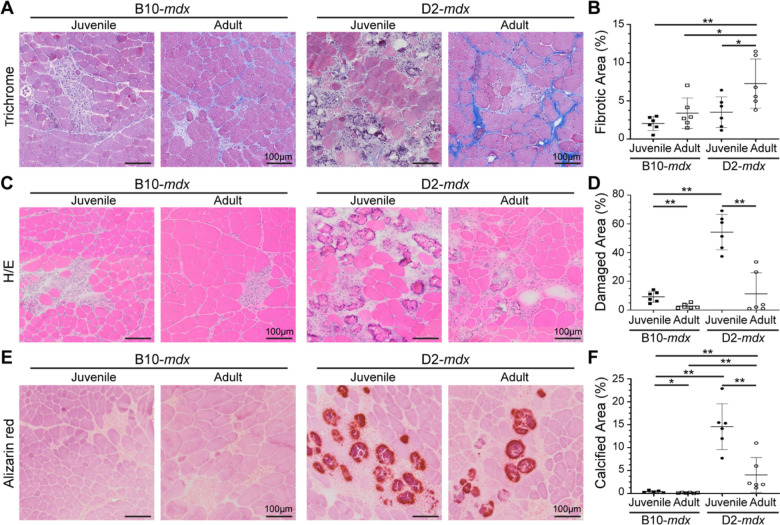
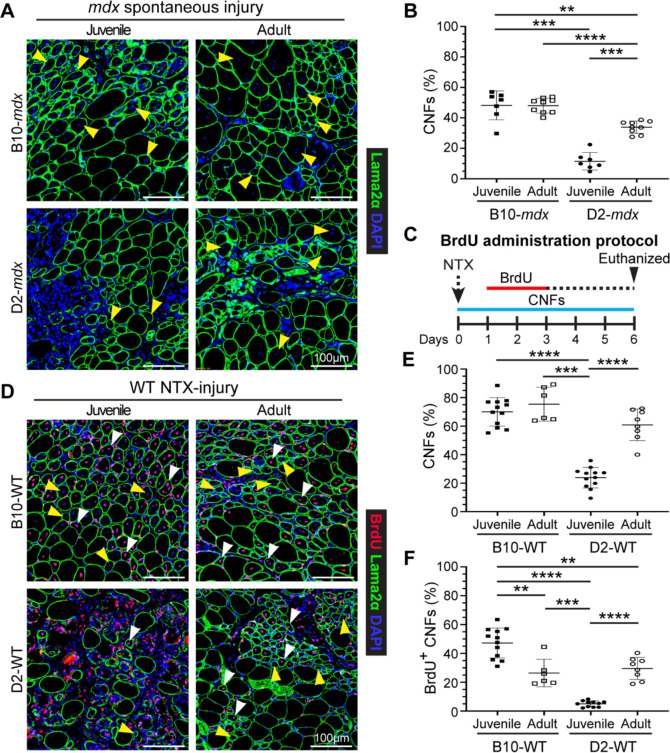
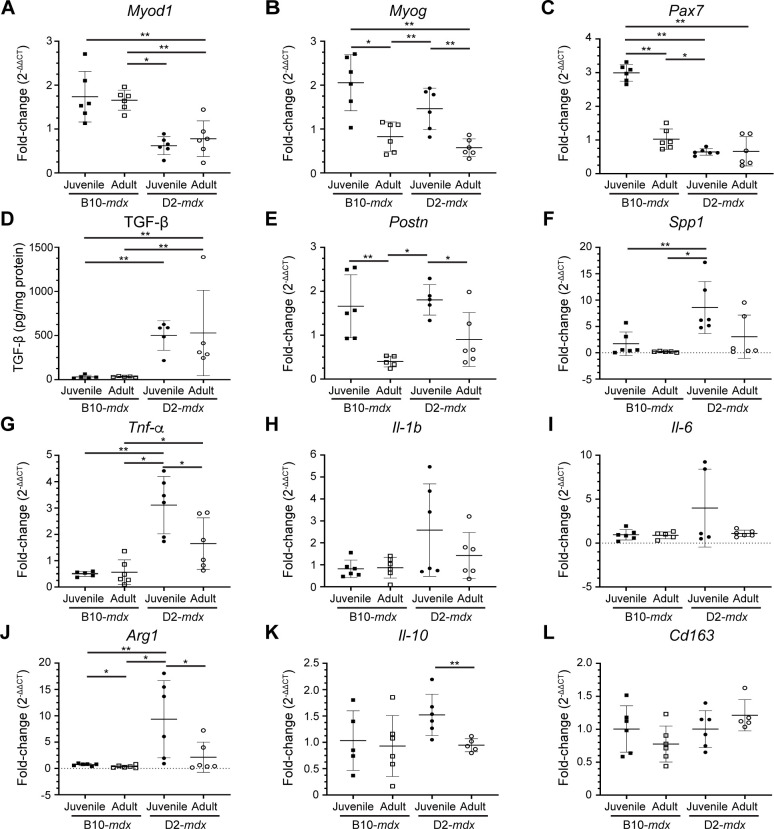
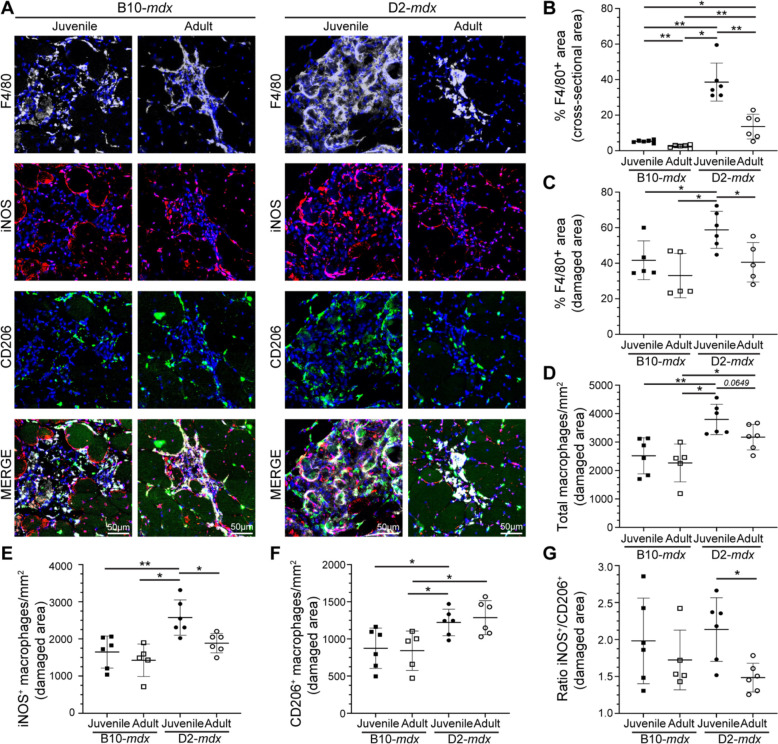
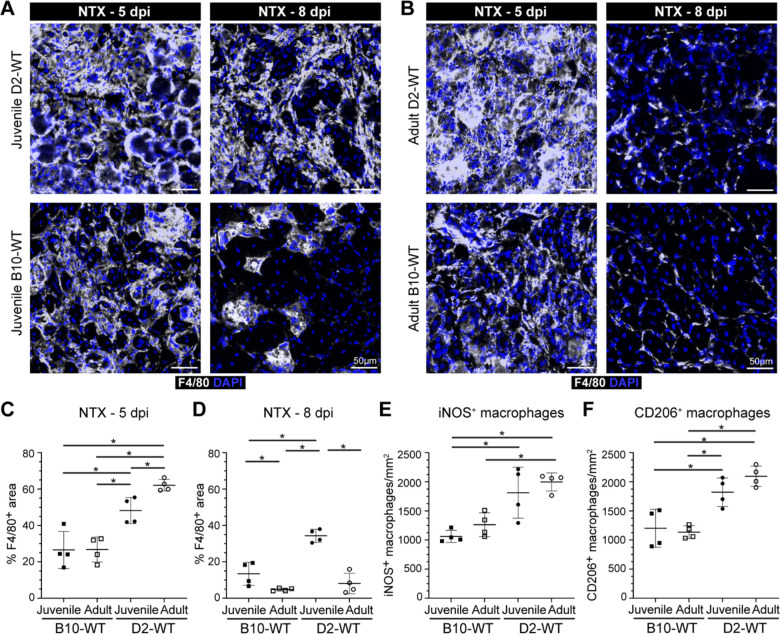
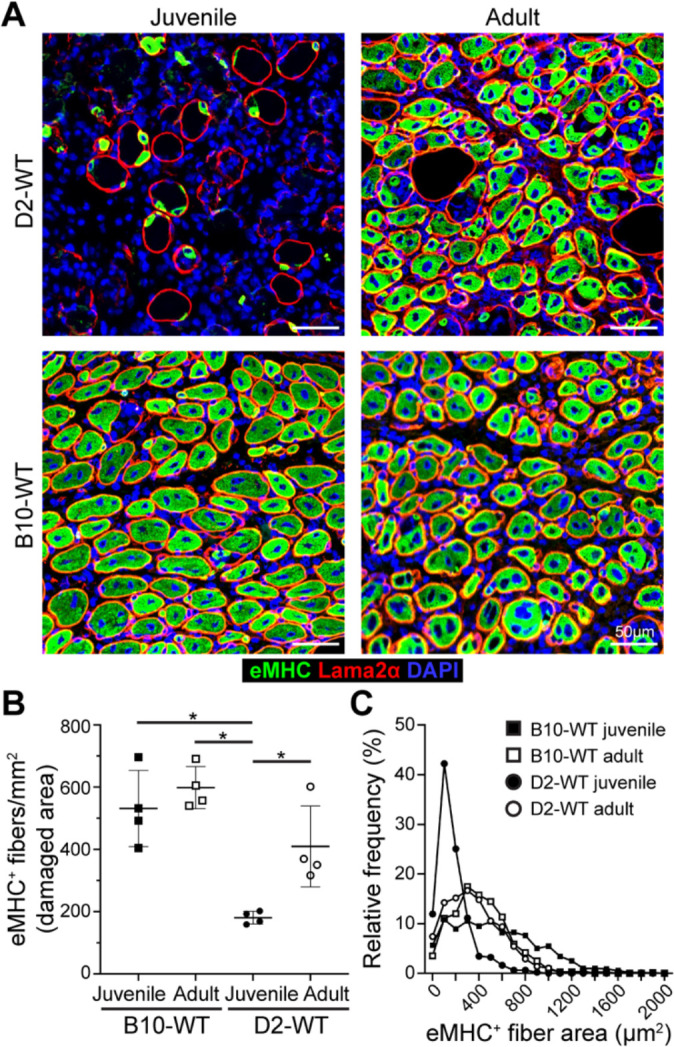
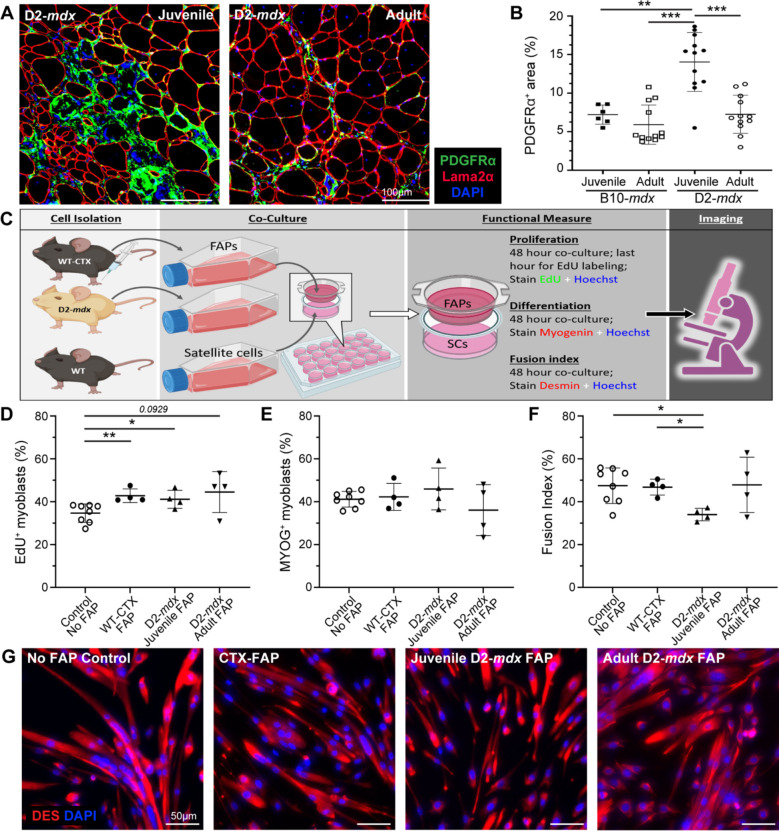
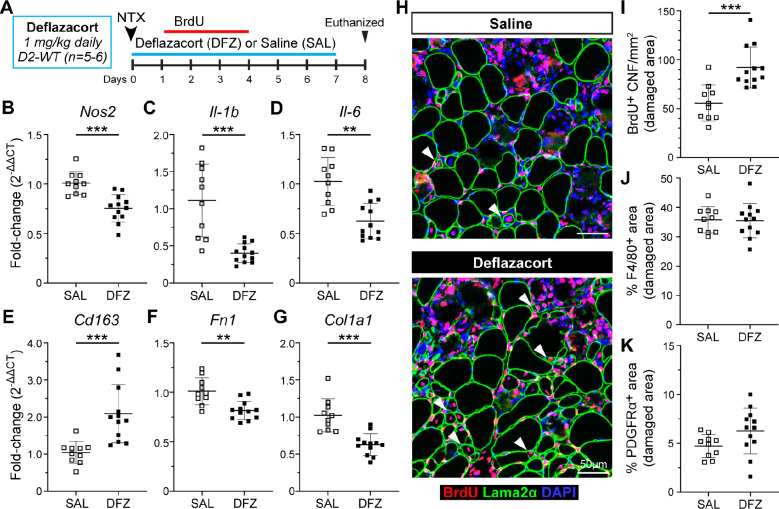
Lack of dystrophin is the genetic basis for the Duchenne muscular dystrophy (DMD). However, disease severity varies between patients, based on specific genetic modifiers. D2- mdx is a model for severe DMD that exhibits exacerbated muscle degeneration and failure to regenerate even in the juvenile stage of the disease. We show that poor regeneration of juvenile D2- mdx muscles is associated with enhanced inflammatory response to muscle damage that fails to resolve efficiently and supports excessive accumulation of fibroadipogenic progenitors (FAPs). Unexpectedly, the extent of damage and degeneration of juvenile D2- mdx muscle is reduced in adults and is associated with the restoration of the inflammatory and FAP responses to muscle injury. These improvements enhance myogenesis in the adult D2- mdx muscle, reaching levels comparable to the milder (B10- mdx ) mouse model of DMD. Ex vivo co-culture of healthy satellite cells (SCs) with the juvenile D2- mdx FAPs reduced their fusion efficacy and in vivo glucocorticoid treatment of juvenile D2 mouse improved muscle regeneration. Our findings indicate that aberrant stromal cell response contributes to poor myogenesis and greater muscle degeneration in dystrophic juvenile D2- mdx muscles and reversal of this reduces pathology in adult D2- mdx mouse muscle, identifying these as therapeutic targets to treat dystrophic DMD muscles.


Conflict of interest statement

Competing interests. The authors have no competing or financial interests to declare.

Figures

Fig. 1.
Fig. 1.. Histopathological assessment of disease in D2-mdx and B10-mdx models.
A-B. Masson’s trichrome staining and quantification of percent fibrotic tissue area performed on triceps harvested from juvenile and adult D2-mdx and B10-mdx mice. C-D. H&E staining and quantification of percent damaged muscle tissue area performed on triceps harvested from juvenile and adult D2-mdx and B10-mdx mice; damaged areas were characterized by the presence of interstitial mononuclear cells, damaged myofibers, and appearance of small-diameter centrally nucleated fibers (CNFs). E-F. Alizarin red staining and quantification of percent calcified fiber area performed on triceps harvested from juvenile and adult D2-mdx and B10-mdx mice. Data represents mean ± SD from n=6 mice per cohort. * p < 0.05, ** p < 0.01 by Mann-Whitney test. Refer to Supplemental Fig. 1.
Fig. 2.
Fig. 2.. Assessment of muscle regeneration in juvenile and adult mdx and WT mice.
A. IF images from juvenile and adult triceps muscle sections from dystrophic mice stained to identify muscle fibers (Laminin-2α) and CNFs (DAPI). Yellow arrowheads show CNFs. B. Quantification of CNFs from dystrophic triceps expressed as a percentage of total muscle fibers. C. Schematic showing the BrdU ‘myofiber birthdating’ strategy to label proliferating SCs in NTX-injured TA muscles in juvenile and adult mice by BrdU administration from 24–72h post injury (green line). Mice were euthanized and tissues harvested 6d post-injury. D. IF images and quantification of muscle sections from B10-WT and D2-WT TA muscles stained to identify muscle fibers BrdU+ CNFs and total CNFs; sections co-stained with Laminin-2α and DAPI. White arrowheads show BrdU+ CNFs while yellow arrowheads show CNFs. E. Quantification of CNFs (%) from NTX-injured TA muscles harvested from juvenile and adult B10-WT and D2-WT mice harvested 6d post-injury. F. Quantification of BrdU+ CNFs (%) from juvenile and adult B10-WT and D2-WT NTX-injured TA muscles. Data represents mean ± SD from n=7–9 mice per cohort (B) or n=6-12 NTX-injured TA muscles per cohort (E, F). * p < 0.05, ** p < 0.01, *** p < 0.001, **** p < 0.0001 by Mann-Whitney test.
Fig. 3.
Fig. 3.. Expression of genes indicative of myogenesis, ECM, and inflammation in juvenile and adult mouse muscles.
A-C. Gene expression analysis of myogenic markers, MyoD, MyoG and Pax7 in juvenile and adult D2-mdx and B10-mdx triceps. D. Levels of active TGF-β protein assessed by ELISA from juvenile and adult D2-mdx and B10-mdx triceps. E-F. Gene expression analysis of ECM remodeling markers, Postn and Spp1, in juvenile and adult D2-mdx and B10-mdx triceps. G-L. Gene expression analysis of inflammatory genes associated with pro-inflammatory (Tnf-α, Il-1b, Il-6) and pro-regenerative (Arg1, Il-10, Cd163) macrophage phenotypes in juvenile and adult D2-mdx and B10-mdx triceps. Data represents mean ± SD from n=5–6 mice per cohort. * p < 0.05, ** p < 0.01 by Mann-Whitney test.
Fig. 4.
Fig. 4.. Investigation of macrophage response to spontaneous injury in mdx muscles.
A. Images showing juvenile and adult D2-mdx and B10-mdx triceps muscle cross-sections stained to mark F4/80, iNOS, and CD206 expressing macrophages. B-C. Quantification of F4/80+ area (%) per total cross-sectional area (B) and only in damaged areas (areas with abundant F4/80+ macrophage infiltration) within cross-sections (C) in juvenile and adult D2-mdx and B10-mdx triceps. D. Total macrophages per unit area (mm2) within damaged regions of juvenile and adult D2-mdx and B10-mdx triceps cross-sections. E-G. Quantification of the distribution of pro-inflammatory (iNOS+/F4/80+) (E), and pro-regenerative (CD206+/F4/80+) (F) macrophages, and the ratio of these macrophages (G) within damaged areas of triceps muscles from juvenile and adult D2-mdx and B10-mdx. Data represents mean ± SD from n=6 mice per cohort. * p < 0.05, ** p < 0.01 by Mann-Whitney test.
Fig. 5.
Fig. 5.. Investigating dynamics of macrophage inflammatory response after acute injury of healthy muscle.
A-B. F4/80 expression assessed 5 d or 8 d post-injury (dpi) in TA muscles of juvenile (A) and adult (B) D2-WT and B10-WT mice. IF images of muscle sections stained to show the distribution of macrophages (F4/80) in adult B10-WT and D2-WT NTX-injured TA muscles after 5d and 8d post-injury; muscles co-stained with DAPI. C-D. Quantification of F4/80+ area after NTX-injury assessed 5 dpi (C) and 8 dpi (D) in juvenile B10-WT and D2-WT. E-F. Quantification of the distribution of pro-inflammatory (iNOS+, F4/80+) (E) and pro-regenerative (CD206+, F4/80+) (F) macrophages per damaged area (mm2) in B10-WT and D2-WT NTX-injured TA muscles. Data represents mean ± SD from n=4 mice per cohort. * p < 0.05, ** p < 0.01 by Mann-Whitney test.
Fig. 6.
Fig. 6.. Investigating regenerative response after acute injury of healthy muscle.
A. eMHC expression assessed 5 d post-injury (dpi) in TA muscles of juvenile and adult D2-WT and B10-WT mice. IF images show the distribution and size of regenerated, eMHC+ myofibers (green), co-stained with Laminin-2α (red) and DAPI. B. Quantification of eMHC+ myofibers per mm2 of damaged tissue present 5 dpi in juvenile and adult D2-WT and B10-WT TA muscles. Data represents mean ± SD from n=4 mice per cohort. * p < 0.05 by Mann-Whitney test. C. Relative frequency plot of eMHC+ myofiber area (reported in μm2) at 5 dpi in juvenile and adult D2-WT and B10-WT TA muscles, where fiber area was quantified for 1119 fibers (B10-WT juvenile), 496 fibers (D2-WT juvenile), 829 fibers (B10-WT adult) and 866 fibers (D2-WT adult).
Fig. 7.
Fig. 7.. Analysis of juvenile D2-mdx FAPs on satellite cell function.
A, B. IF images and quantification of PDGFRα+ FAPs in juvenile and adult D2-mdx and B10-mdx triceps immunostained for (Laminin), PDGFRα (green), and interstitial nuclei (DAPI). C. Schematic illustrating the approach for co-culture experiments to evaluate the effect of FAPs on SC functional properties. SCs from uninjured WT were co-cultured with FAPs isolated from WT mice at 4 days post cardiotoxin injury (WT-CTX), juvenile D2-mdx mice, or adult D2-mdx mice. D. Quantification of the SC proliferation monitored by EdU incorporation. E. Quantification of the SC differentiation monitored by Myogenin expression. F, G. Quantification of the SC fusion index (F) monitored by staining for Desmin expression with corresponding IF images (G) (Desmin stain – red, nuclei stained with Hoechst – blue). Data represents mean ± SD from n=6-12 mice per cohort (A-B) or n=4–6 individual replicates carried out for each functional measure (C-G). * p < 0.05, ** p < 0.01, *** p < 0.001, by Mann-Whitney test.
Fig. 8.
Fig. 8.. Analysis of regenerative capacity following acute injury and glucocorticoid treatment.
A. Schematic showing details for deflazacort treatment regimen performed in D2-WT mice following acute NTX injury. For additional details refer to methods. B-E. Gene expression analysis of inflammatory genes associated with pro-inflammatory (Nos2, Il-1b, Il-6) and pro-regenerative (CD163) macrophage phenotypes in juvenile and adult D2-WT and B10-WT TA muscles after acute injury and deflazacort treatment compared to saline controls. F-G. Gene expression analysis of ECM markers, Fn1 and Col1a1, in juvenile and adult D2-WT and B10-WT TA muscles after acute injury and deflazacort treatment compared to saline controls. H. IF images showing BrdU+ CNFs (Red) as indicated by white arrowheads after acute injury and deflazacort treatment compared to saline controls; sections co-stained with Laminin-2α (green) and DAPI (blue). I. Quantification of BrdU+ CNFs (per damaged area) after acute injury and deflazacort treatment compared to saline controls. J-K. % F4/80 (J) and PDGFRα (K) area reported within damaged muscle regions after acute injury and deflazacort treatment compared to saline controls. Data represents mean ± SD from n=5–6 mice per cohort. ** p < 0.01, *** p < 0.001 by Mann-Whitney test.

Similar articles

References

    1. Hoffman EP, Brown RH Jr., Kunkel LM. Dystrophin: the protein product of the Duchenne muscular dystrophy locus. Cell. 1987;51(6):919–28. - PubMed
    1. Mendell JR, Shilling C, Leslie ND, Flanigan KM, al-Dahhak R, Gastier-Foster J, et al. Evidence-based path to newborn screening for Duchenne muscular dystrophy. Annals of neurology. 2012;71(3):304–13. - PubMed
    1. Ibraghimov-Beskrovnaya O, Ervasti JM, Leveille CJ, Slaughter CA, Sernett SW, Campbell KP. Primary structure of dystrophin-associated glycoproteins linking dystrophin to the extracellular matrix. Nature. 1992;355(6362):696–702. - PubMed
    1. Allikian MJ, McNally EM. Processing and assembly of the dystrophin glycoprotein complex. Traffic. 2007;8(3):177–83. - PubMed
    1. Petrof BJ, Shrager JB, Stedman HH, Kelly AM, Sweeney HL. Dystrophin protects the sarcolemma from stresses developed during muscle contraction. Proceedings of the National Academy of Sciences of the United States of America. 1993;90(8):3710–4. - PMC - PubMed

Publication types