[Preprint]. 2023 Mar 29:2023.03.28.534666.
doi: 10.1101/2023.03.28.534666.

APOBEC3 degradation is the primary function of HIV-1 Vif for virus replication in the myeloid cell line THP-1

Affiliations

APOBEC3 degradation is the primary function of HIV-1 Vif for virus replication in the myeloid cell line THP-1

Terumasa Ikeda et al. bioRxiv. .

Update in

Abstract

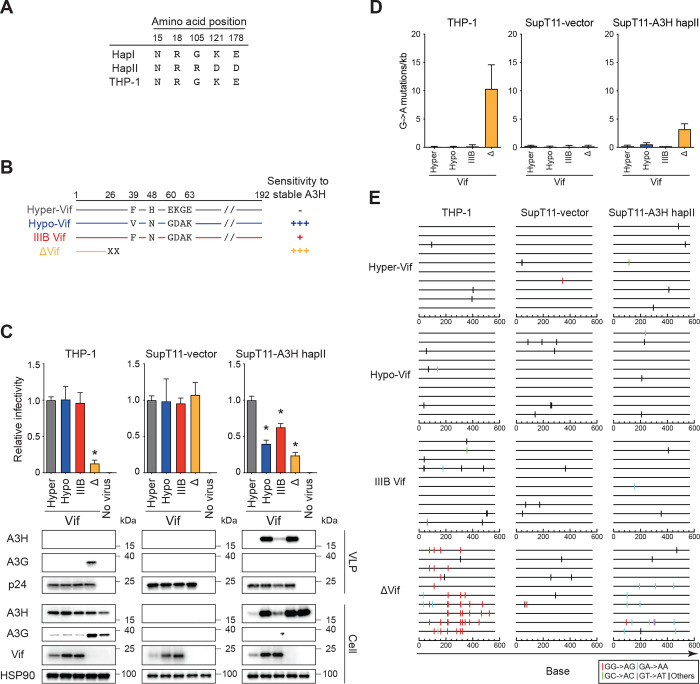
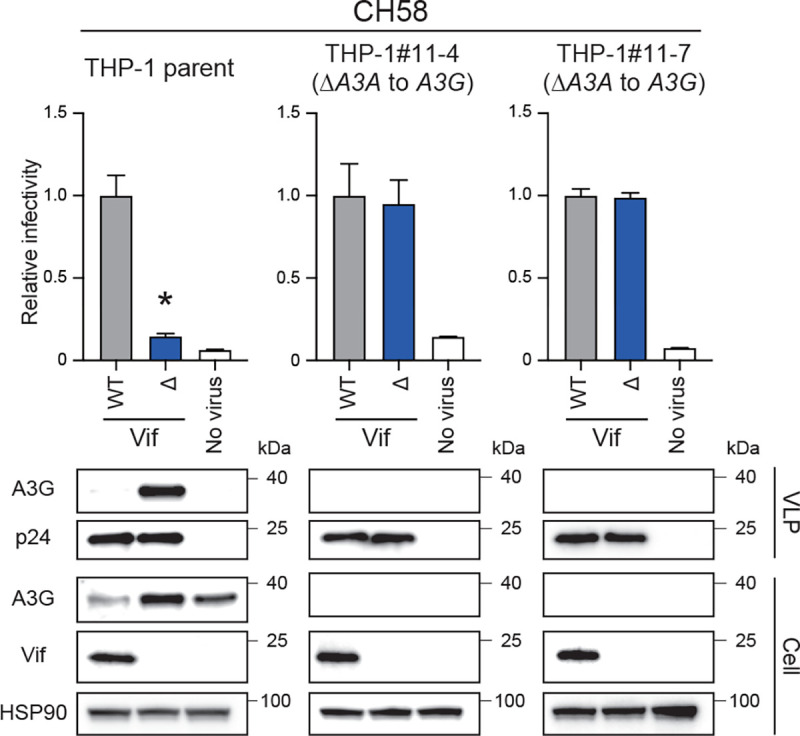
HIV-1 must overcome multiple innate antiviral mechanisms to replicate in CD4 + T lymphocytes and macrophages. Previous studies have demonstrated that the APOBEC3 (A3) family of proteins (at least A3D, A3F, A3G, and stable A3H haplotypes) contribute to HIV-1 restriction in CD4 + T lymphocytes. Virus-encoded virion infectivity factor (Vif) counteracts this antiviral activity by degrading A3 enzymes allowing HIV-1 replication in infected cells. In addition to A3 proteins, Vif also targets other cellular proteins in CD4 + T lymphocytes, including PPP2R5 proteins. However, whether Vif primarily degrades only A3 proteins or has additional essential targets during viral replication is currently unknown. Herein, we describe the development and characterization of A3F -, A3F/A3G -, and A3A -to- A3G -null THP-1 cells. In comparison to Vif-proficient HIV-1, Vif-deficient viruses have substantially reduced infectivity in parental and A3F -null THP-1 cells, and a more modest decrease in infectivity in A3F/A3G -null cells. Remarkably, disruption of A3Aâ€"A3G protein expression completely restores the infectivity of Vif-deficient viruses in THP-1 cells. These results indicate that the primary function of Vif during HIV-1 replication in THP-1 cells is the targeting and degradation of A3 enzymes.

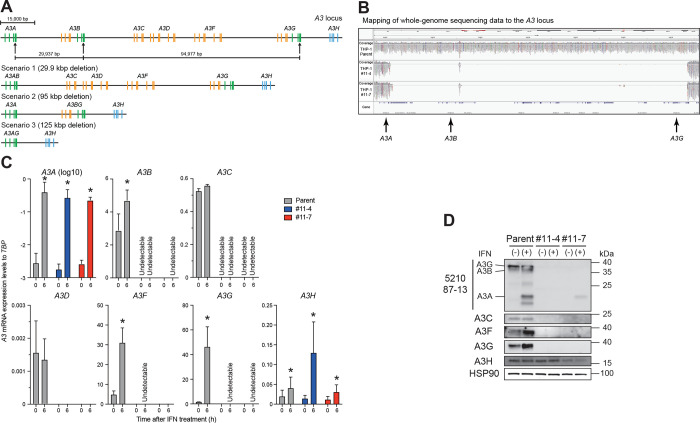
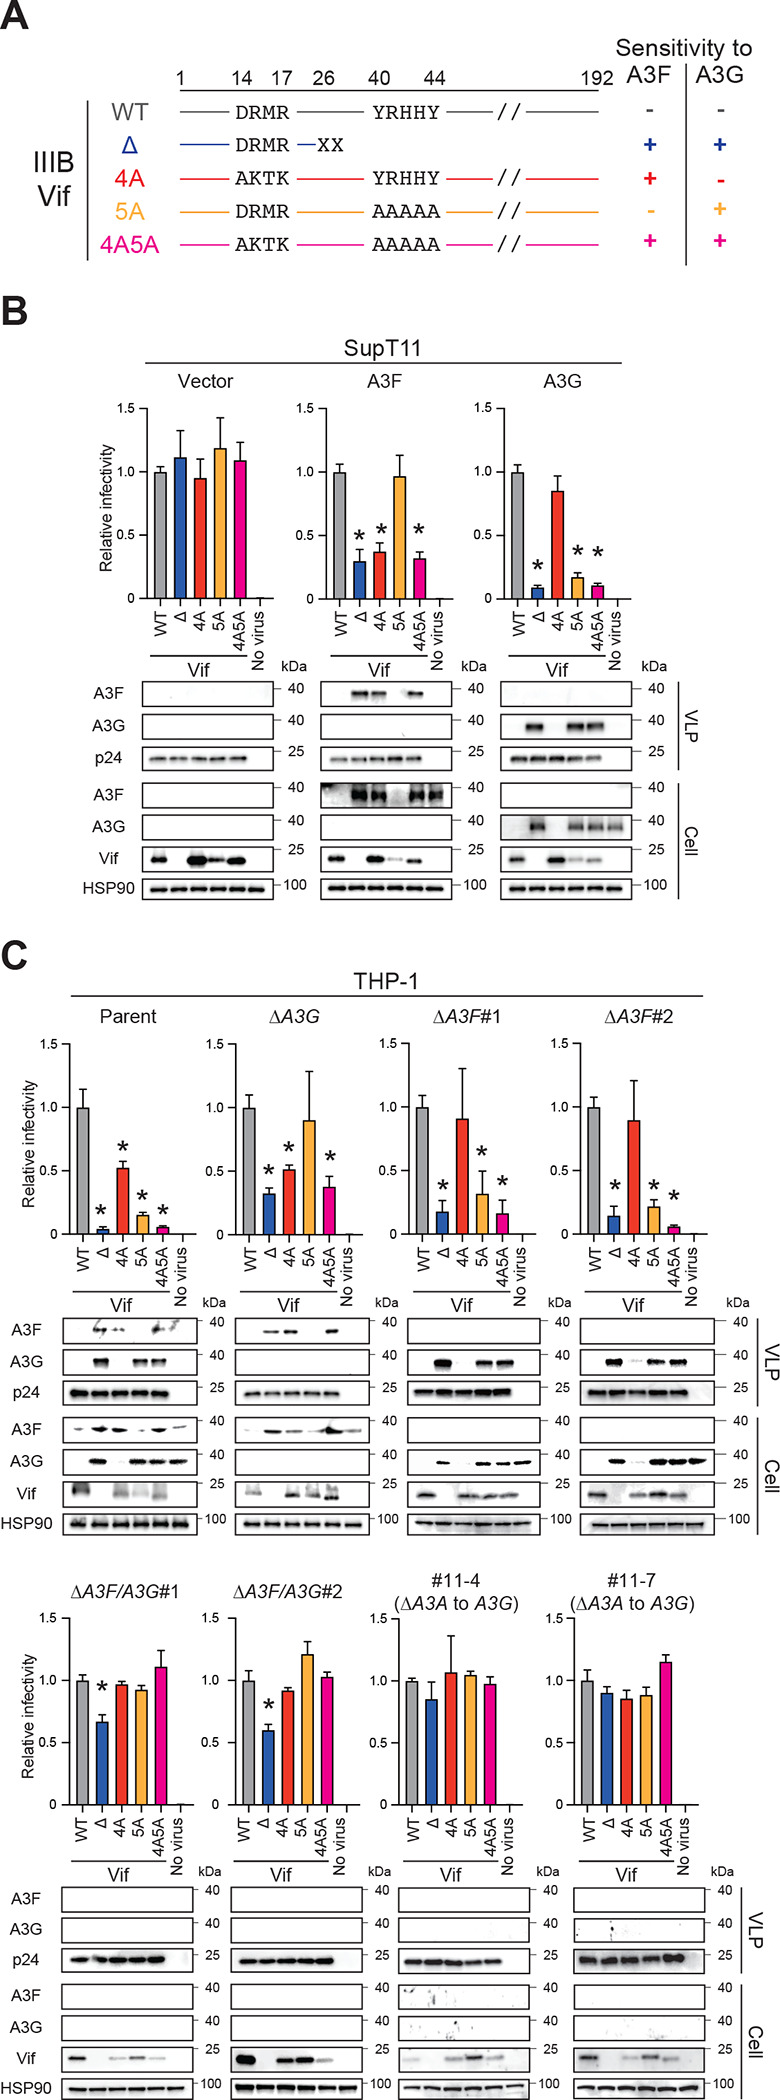
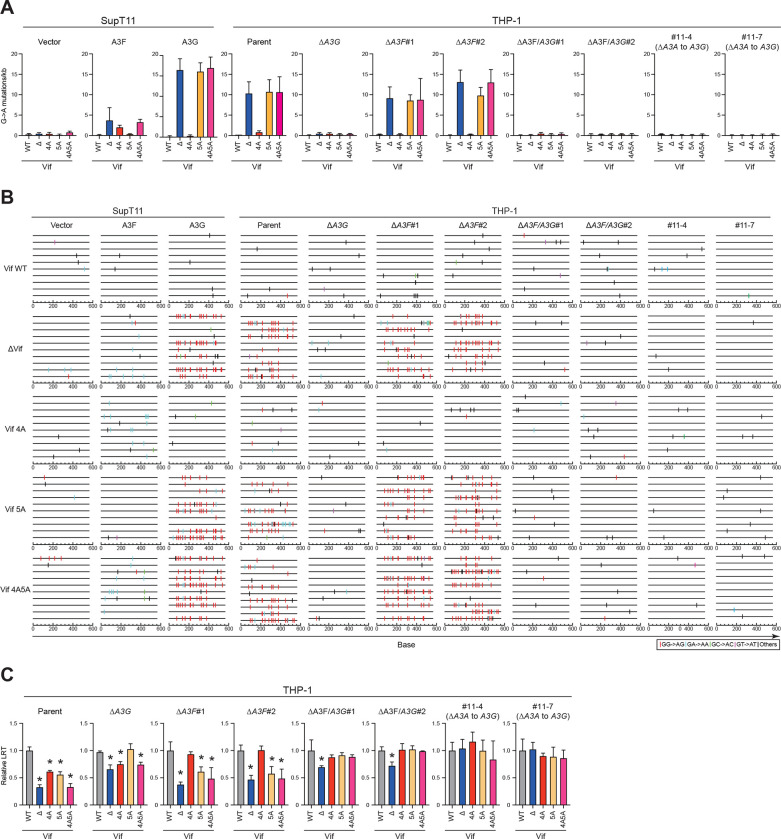
Importance: HIV-1 Vif neutralizes the HIV-1 restriction activity of A3 proteins. However, it is currently unclear whether Vif has additional essential cellular targets. To address this question, we disrupted A3A to A3G genes in the THP-1 myeloid cell line using CRISPR and compared the infectivity of wildtype HIV-1 and Vif mutants with the selective A3 neutralization activities. Our results demonstrate that the infectivity of Vif-deficient HIV-1 and the other Vif mutants is fully restored by ablating the expression of cellular A3A to A3G proteins. These results indicate that A3 proteins are the only essential target of Vif that is required for HIV-1 replication in THP-1 cells.


Conflict of interest statement

The authors declare that they have no competing interests.

Figures

Figure 1.
Figure 1.. Endogenous A3H does not inhibit HIV-1 in THP-1 cells.
(A) A3H haplotypes in THP-1 cells. The indicated positions are key amino acid residues that determine the expression of unstable (hapI) or stable (hapII) A3H protein. (B) Schematic of the susceptibility of Vif mutants to stable A3H haplotypes. Key amino acid residues that determine the susceptibility of HIV-1 IIIB Vif to restriction by stable A3H haplotypes. −, full resistance; +, partial resistance; +++, sensitivity. (C) Representative infectivity of hyper- and hypo-functional Vif HIV-1 mutants. Top panels show the infectivity of hyper-Vif, hypo-Vif, and IIIB Vif, and Vif-deficient HIV-1 mutants produced in THP-1 cells compared to the same viruses produced in SupT11 cells with stable expression of the control vector or A3H haplotype II. The amounts of produced viruses used to infect TZM-bl cells was normalized to p24 levels. Each bar shows the average of four independent experiments with the standard deviation (SD). Data are represented as relative infectivity compared to hyper-Vif HIV-1. Statistical significance was determined using the two-sided paired t test. *P < 0.05 compared with the infectivity of hyper-Vif HIV-1. The bottom panels are representative Western blots of three independent experiments. The levels of viral and cellular proteins in virus-like particles (VLPs) and whole cell lysates are shown. p24 and HSP90 were used as loading controls. (D) G-to-A mutations. Average number of G-to-A mutations in the 564 bp pol gene after infection with hyper-Vif, hypo-Vif, IIIB Vif, or Vif deficient HIV-1 produced from THP-1 or SupT11 cells expressing either the vector control or A3H hapII. Each bar depicts the average of three independent experiments with SD. (E) G-to-A mutation profile. Dinucleotide sequence contexts of G-to-A mutations in the 564 bp pol gene after infection with the indicated viruses produced from indicated cell lines. Each vertical line indicates the location of the dinucleotide sequence contexts described in the legend within the 564 bp amplicon (horizontal line).
Figure 2.
Figure 2.. Disruption of the A3A to A3G genes in THP-1 cells.
(A) Schematic of the A3 gene at the A3 locus. The A3 family of genes comprises seven members with one or two Z domains (single- or double-domain deaminases) which belong to three phylogenetically distinct groups shown in green, yellow, and blue. Three sites with an identical sequence (5′-GAG TGG GAG GCT GCG GGC CA) in exon 4 of the A3A gene, exon 7 of the A3B gene, and exon 7 of the A3G gene are targeted by gRNA, as indicated by arrows. The three predicted scenarios are shown. Bar represents 15,000 bp. (B) Mapping of WGS sequencing data to the A3 locus. Genomic DNA from parental THP1, THP-1#11-4, and #11–7 cells were subjected to WGS analysis, with an extensive deletion including the A3AA3G genes observed in THP-1#11-4 and #11–7 clones. (C) RT-qPCR data. Parental THP-1, THP-1#11-4, and #11–7 cells were treated with 500 units/ml type I IFN. Total RNA was isolated after 6 hours. A3 mRNA expression levels were quantified by RT-qPCR and are normalized to TBP mRNA levels. Each bar represents the average of three independent experiments with SD. Statistical significance was determined using the two-sided paired t test. *, P < 0.05 compared to untreated cells. (D) Representative Western blots of three independent experiments. Levels of indicated A3 proteins in whole cell lysates from cells treated with or without type I IFN are shown. HSP90 was used as a loading control.
Figure 3.
Figure 3.. Pseudo-single cycle infectivity assays for each HIV-1 mutant in A3-null THP-1 cells.
(A) Schematic of the susceptibility of Vif mutants to A3F and A3G. Key amino acid residues that determine the susceptibility of HIV-1 IIIB Vif to restriction by A3F and A3G. −, resistance; +, sensitivity. (B) Representative infectivity of Vif-proficient, Vif-deficient, Vif4A, Vif5A, and Vif4A5A HIV-1 mutants in SupT11 cells stably expressing vector control, A3F, or A3G. Top panels show the infectivity of indicated HIV-1 mutants produced in SupT11 cells stably expressing vector control, A3F, or A3G. The amounts of produced viruses used to infect TZM-bl cells was normalized to p24 levels. Each bar represents the average of four independent experiments with SD. Data are presented as relative infectivity compared to Vif-proficient HIV-1 (WT). Statistical significance was assessed using the two-sided paired t test. *P < 0.05 compared to Vif-proficient HIV-1. Bottom panels are representative Western blots of three independent experiments. Levels of indicated viral and cellular proteins in VLPs and whole cell lysates are shown. p24 and HSP90 were used as loading controls. (C) Representative infectivity of Vif-proficient, Vif-deficient, Vif4A, Vif5A, and Vif4A5A HIV-1 mutants in A3-null THP-1 cells. Top panels show the infectivity of indicated HIV-1 mutants produced in parental or A3-null THP-1 cells. The amounts of produced viruses used to infect TZM-bl cells was normalized to p24 levels. Each bar represents the average of four independent experiments with SD. Data are presented as infectivity relative to Vif-proficient HIV-1 (WT). Statistical significance was assessed using the two-sided paired t test. *P < 0.05 compared to Vif-proficient HIV-1. Bottom panels are representative Western blots of three independent experiments. Levels of indicated viral and cellular proteins in VLPs and whole cell lysates are shown. p24 and HSP90 were used as loading controls.
Figure 4.
Figure 4.. A3 proteins inhibit Vif-deficient HIV-1 by both deaminase-dependent and independent mechanisms in THP-1 cells.
(A) G-to-A mutations. Average number of G-to-A mutations in the 564 bp pol gene after infection with hyper-Vif, hypo-Vif, IIIB Vif, or Vif-deficient HIV-1 produced from THP-1 or SupT11 expressing either vector control or A3H hapII. Each bar depicts the average of three independent experiments with SD. (B) G-to-A mutation profile. Dinucleotide sequence contexts of G-to-A mutations in the 564 bp pol gene after infection with the indicated viruses produced from indicated cell lines. Each vertical line indicates the location of the dinucleotide sequence contexts described in the legend within the 564 bp amplicon (horizontal line). (C) Representative LRT quantification data for Vif-proficient, Vif-deficient, Vif4A, Vif5A, and Vif4A5A HIV-1 mutants in each A3-null THP-1 subclone. Data show LRT products of the indicated HIV-1 mutants produced in parental or indicated A3-null THP-1 cells. The amount of produced viruses used to infect SupT11 cells was normalized to p24 levels. LRT products were measured by qPCR. Each bar represents the average of four independent experiments with SD. LRT products were normalized to the quantity of the CCR5 gene relative to Vif-proficient HIV-1 (WT). Statistical significance was assessed using the two-sided paired t test. *P < 0.05 compared to Vif-proficient HIV-1 LRT products.
Figure 5.
Figure 5.. Pseudo-single cycle infectivity assays of TF virus molecular clone in A3A-to-A3G-null THP-1 cells.
Infectivity of Vif-proficient and Vif-deficient CH58 viruses. Top panels show the infectivity of Vif-proficient and Vif-deficient HIV-1 produced in parental THP-1, THP-1#11-4, or THP-1#11-7 cells. The amounts of produced viruses used to infect TZM-bl cells was normalized to p24 levels. Each bar represents the average of four independent experiments with SD. Data are represented as relative to Vif-proficient HIV-1 (WT). Statistical significance was assessed using the two-sided paired t test. *P < 0.05 compared to Vif-proficient HIV-1. The bottom panels are representative Western blots of three independent experiments. The levels of indicated viral and cellular proteins in VLPs and whole cell lysates are shown. p24 and HSP90 were used as loading controls.

Similar articles

References

    1. Ikeda T, Yue Y, Shimizu R, Nasser H. 2021. Potential utilization of APOBEC3-mediated mutagenesis for an HIV-1 functional cure. Front Microbiol 12:686357. - PMC - PubMed
    1. Desimmie BA, Delviks-Frankenberrry KA, Burdick RC, Qi D, Izumi T, Pathak VK. 2014. Multiple APOBEC3 restriction factors for HIV-1 and one Vif to rule them all. J Mol Biol 426:1220–45. - PMC - PubMed
    1. Harris RS, Dudley JP. 2015. APOBECs and virus restriction. Virology 479–480C:131–145. - PMC - PubMed
    1. Koito A, Ikeda T. 2012. Apolipoprotein B mRNA-editing, catalytic polypeptide cytidine deaminases and retroviral restriction. Wiley Interdiscip Rev RNA 3:529–41. - PubMed
    1. Cheng AZ, Moraes SN, Shaban NM, Fanunza E, Bierle CJ, Southern PJ, Bresnahan WA, Rice SA, Harris RS. 2021. APOBECs and herpesviruses. Viruses 13. - PMC - PubMed

Publication types