[Preprint]. 2023 Mar 29:2023.03.27.534452.
doi: 10.1101/2023.03.27.534452.

A role for N6-methyldeoxyadenosine in C. elegans mitochondrial genome regulation

Affiliations

A role for N6-methyldeoxyadenosine in C. elegans mitochondrial genome regulation

Lantana K Grub et al. bioRxiv. .

Abstract

Epigenetic modifications provide powerful means for transmitting information from parent to progeny. As a maternally inherited genome that encodes essential components of the electron transport chain, the mitochondrial genome (mtDNA) is ideally positioned to serve as a conduit for the transgenerational transmission of metabolic information. Here, we provide evidence that mtDNA of C. elegans contains the epigenetic mark N6-methyldeoxyadenosine (6mA). Bioinformatic analysis of SMRT sequencing data and methylated DNA IP sequencing data reveal that C. elegans mtDNA is methylated at high levels in a site-specific manner. We further confirmed that mtDNA contains 6mA by leveraging highly specific anti-6mA antibodies. Additionally, we find that mtDNA methylation is dynamically regulated in response to antimycin, a mitochondrial stressor. Further, 6mA is increased in nmad-1 mutants and is accompanied by a significant decrease in mtDNA copy number. Our discovery paves the way for future studies to investigate the regulation and inheritance of mitochondrial epigenetics.

Keywords: 6mA; Mitochondria; epigenetics; mtDNA.


Conflict of interest statement

Declaration of Interests The authors declare no competing interests.

Figures
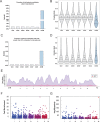
Figure 1.
Figure 1.. SMRT sequencing and MeDIP data sets show high 6mA methylation in mitochondrial DNA relative to the nuclear genome
(A) The ratio of total adenine methylation sites (6mA) with a p value ≤ 0.001 to total adenines (dA). Nuclear chromosomes shown in gray, and the mitochondrial chromosome in blue for Figure 1A–D. ChrI n=41,916, ChrII n=41,457, ChrIII n=37,943, ChrIV n=42,763, ChrV n=54,567, ChrX n=42,009, ChrM n=862. Means are shown. (B) The fraction of reads that are identified as methylated, from 0.0 to 1.0, for a unique adenine. Means (black dot) and distribution quartiles (lines) are shown. (C) The 6mA:dA ratio of sites with 50% methylation or greater. ChrI n=12,269, ChrII n=11,915, ChrIII n=11,028, ChrIV n=12,527, ChrV n=15,744, ChrX n=12,100, ChrM n=162. (D) The fraction of reads that are identified as methylated, from 0.5 to 1.0, for a unique adenine. Means (black dot) and distribution quartiles (lines) are shown. (E) MeDIP read depth throughout the mitochondrial chromosome. Control IgG IP shown in red, 6mA IP in purple. (F) The fold enrichment of the 6mA IP over the control IP for each significantly enriched sequence. The mean fold enrichment for each chromosome is shown (black line). (G) Unique sequences that are significantly enriched in the 6mA IP compared to the control using MACS2. The −log10(qvalue) for each enriched sequence is plotted as a single point. ChrI n=574, ChrII n=535, ChrIII n=513, ChrIV n=554, ChrV n=588, ChrX n=654, ChrM n=1. The mean −log10(qvalue) for each chromosome is shown (black line).
Figure 2.
Figure 2.. Dot blot assay shows 6mA signal in mitochondrial DNA
(A) Anti-6mA dot blot of synthetic oligonucleotides with an internal N6-methyladenosine (6mA) or without (dA) blotted at 12.5, 2.5, 0.5, and 0.1 μM. (B) Schematic of droplet digital PCR. DNA template is partitioned into individual oil droplets such that there is 1 (blue) or 0 (gray) DNA templates per droplet. The template in each droplet is amplified through PCR and a fluorescent probe is integrated. A microfluidic detector identifies fluorescent DNA positive (blue) and fluorescent DNA negative (gray) droplets which are used to quantify the number of DNA molecules. (C) Representative ddPCR assay of an enriched mtDNA sample with positive mtDNA droplets (left) and positive nuDNA droplets (right), n=3. (D) The number of mtDNA copies relative to nuDNA in the mtDNA enriched sample (left) and the total DNA enriched sample (right) from three independent biological experiments. (E) Representative anti-6mA dot blot assay of enriched mtDNA and total DNA. Three concentrations were loaded for each sample, and a positive control (6mA oligonucleotides) and negative control (dA oligonucleotides) were included.
Figure 3.
Figure 3.. 6mA immunoprecipitation enriches for mtDNA
(A) Schematic of mtDNA IP and ddPCR. mtDNA was enriched via differential centrifugation. mtDNA was then immunoprecipitated with an anti-6mA antibody/bead complex, or IgG control antibody/bead complex. mtDNA was then released from the antibody/bead complex and DNA was quantified with ddPCR. (B) In one treatment group, samples were treated with Proteinase K in elution buffer for complete release of mtDNA from antibody/bead complex. (C) Representative ddPCR results of the mtDNA positive (blue) and negative (gray) droplets in the 6mA IP (left) and the IgG control IP (right). (D). The number of mtDNA molecules immunoprecipitated in the 6mA IP (left) and the IgG control IP (right) in three independent experiments. (E) In another treatment group, 6mA IP samples were competed with 6mA methylated oligonucleotides or unmethylated oligonucleotides to displace mtDNA bound to the antibody/bead complex. (F) Representative ddPCR results of the DNA positive (blue) and negative (gray) droplets in the 6mA oligonucleotide displacement elution (left) and the dA oligonucleotide displacement elution (right). (G) The number of mtDNA molecules immunoprecipitated in the 6mA oligonucleotide displacement elution (left) and the dA oligonucleotide displacement elution (right) in three independent experiments.
Figure 4.
Figure 4.. 6mA distribution within the mitochondrial genome
(A) Distribution and methylation level of 6mA methylation sites in mtDNA on the heavy (dark gray, upper) and light (light gray, lower) strands. Methylation levels at a given adenine position are represented from 0 to 1, with 0 being 0% of reads were methylated at that site and 1 being 100% of reads are methylated at that site. (B) Level of 6mA methylation on the heavy (n=359, mean=33.6%) and light strand (n=503, mean=31.6%). (C) Ratio of 6mA sites to total adenines within mRNA, rRNA, and tRNA coding regions and the d-loop. Data is further stratified by heavy (darker shade) or light strand (lighter shade). (D) Methylation levels within mRNA, rRNA, tRNA coding regions and the d-loop. Mean values are denoted with a black dot and 25th, 50th, and 75th distribution percentiles are marked with dashed lines. Comparisons between groups were made with an ordinary one-way ANOVA. mRNA n=662 and mean=31.5%, rRNA n=108 and mean=32.6%, tRNA n=70 and mean=33.5%, and d-loop n=11 and mean=78.2%. (E) Expanded view of methylation of the d-loop. Methylation levels are plotted at individual adenine sites in the first 100 bp of the d-loop. (F) A sequence motif enriched in at sites of methylation was detected using STREME .
Figure 5.
Figure 5.. mtDNA 6mA levels are dynamically regulated in response to mitochondrial stressor antimycin
(A) MeDIP read depth throughout the mitochondrial chromosome in antimycin treated 6mA IP (black), control 6mA IP (purple), antimycin treated IgG IP (blue), and control IgG IP (red) samples. (B) Log2 fold-change in mtDNA transcript expression in antimycin treated animals compared to control animals. Color gradient is Log2 fold-change from positive fold-change (blue), to no change (white), to negative-fold change (red). (C) Significantly enriched sequences in the antimycin treated 6mA IP compared to the control 6mA IP using MACS2. The −log10 of the qvalue for each enriched sequence is plotted as a dot. ChrI n=9, ChrII n=4, ChrIII n=3, ChrIV n=4, ChrV n=7, ChrX n=4, ChrM n=10.
Figure 6.
Figure 6.. nmad-1 loss of function animals have increased mtDNA 6mA and decreased mtDNA copy number.
(A) anti-6mA dot blot of mtDNA from wildtype and nmad-1 −/− animals with decreasing DNA concentrations, a positive control (6mA), and negative control (dA). Representative image of two independent biological replicates. (B) mtDNA copy number, normalized to nuDNA, in age synchronized day 3 (D3) adults. Wildtype n=46, nmad-1 −/− n=45, unpaired t-test, **** indicates p-value <0.0001. (C) mtDNA copy number, normalized to nuDNA, in age synchronized animals 24 hr post embryo-lay. Wildtype n=35, nmad-1 −/− n=33, unpaired t-test, **** indicates p-value <0.0001. (D) logCPM normalized transcript expression of hmg-5, polg-1, and mtss-1 from wildtype (black) and nmad-1 −/− (red) animals. Two independent replicates represented as individual data points, means shown with black bar. (E) Representative image wildtype or nmad-1 −/− animals labeled with the hsp-6p::GFP reporter of UPRmt (F) Relative fluorescent intensity normalized to the wildtype average of wildtype and nmad-1 −/− animals with the hsp-6p::GFP reporter. Wildtype n=32, nmad-1 −/− n=32, unpaired t-test, **** indicates p-value <0.0001.

References

    1. Sánchez-Romero M.A., and Casadesús J. (2020). The bacterial epigenome. Nat Rev Microbiol 18, 7–20. 10.1038/s41579-019-0286-2. - DOI - PubMed
    1. Loenen W.A.M., and Raleigh E.A. (2014). The other face of restriction: modification-dependent enzymes. Nucleic Acids Res 42, 56–69. 10.1093/nar/gkt747. - DOI - PMC - PubMed
    1. Wion D., and Casadesús J. (2006). N6-methyl-adenine: an epigenetic signal for DNA–protein interactions. Nat Rev Microbiol 4, 183–192. 10.1038/nrmicro1350. - DOI - PMC - PubMed
    1. Fang G., Munera D., Friedman D.I., Mandlik A., Chao M.C., Banerjee O., Feng Z., Losic B., Mahajan M.C., Jabado O.J., et al. (2012). Genome-wide mapping of methylated adenine residues in pathogenic Escherichia coli using single-molecule real-time sequencing. Nat Biotechnol 30, 1232–1239. 10.1038/nbt.2432. - DOI - PMC - PubMed
    1. Fukui K. (2010). DNA Mismatch Repair in Eukaryotes and Bacteria. Journal of Nucleic Acids 2010, e260512. 10.4061/2010/260512. - DOI - PMC - PubMed

Publication types