. 2023 Mar 13;26(4):106390.
doi: 10.1016/j.isci.2023.106390. eCollection 2023 Apr 21.

Addition of dNTPs can improve the detection sensitivity of catalytic hairpin assembly

Affiliations

Addition of dNTPs can improve the detection sensitivity of catalytic hairpin assembly

Mingyuan Zou et al. iScience. .

Abstract

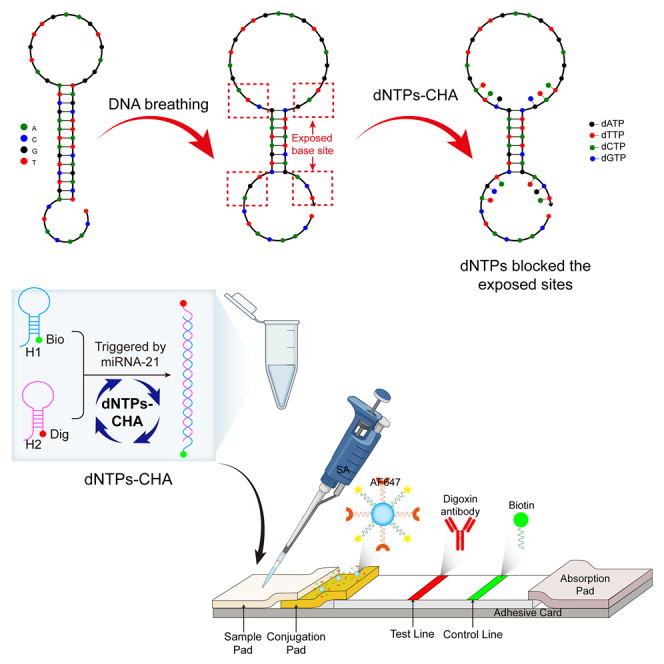
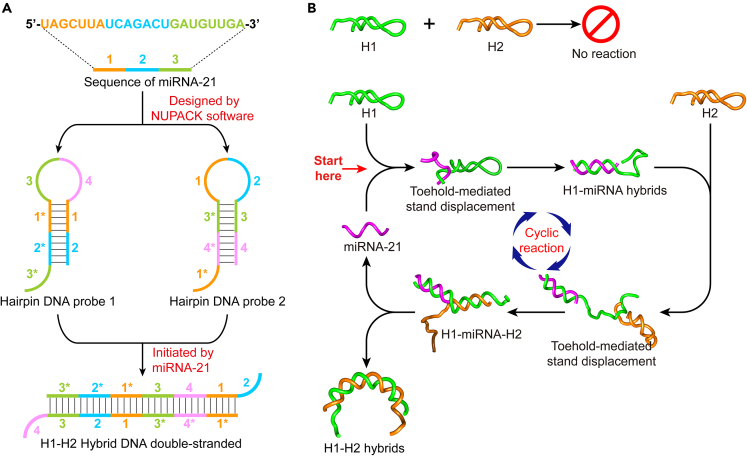
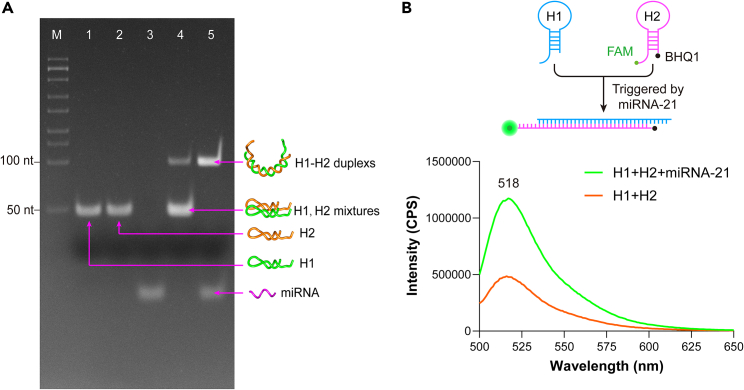
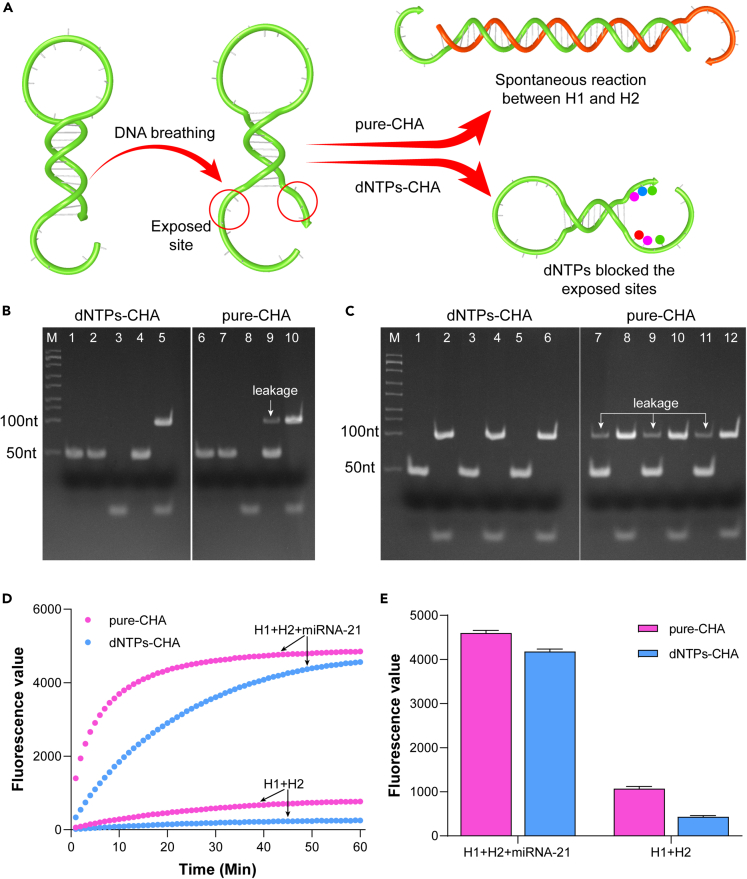
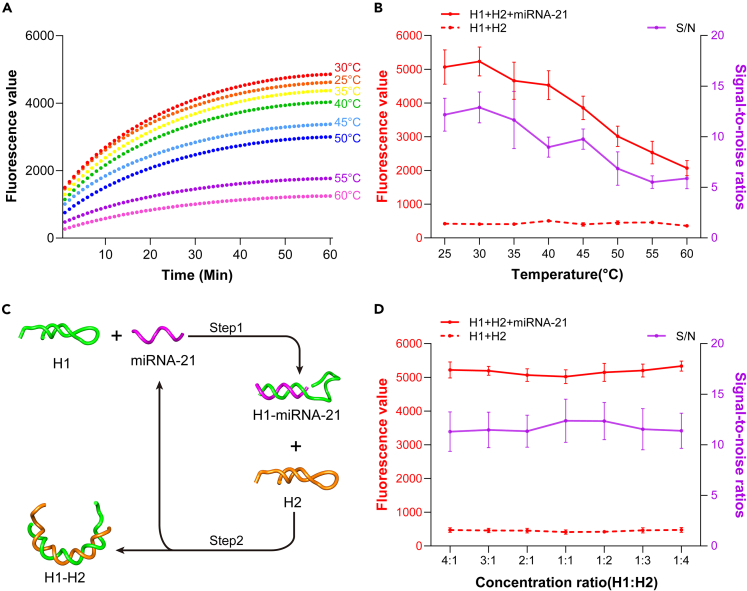
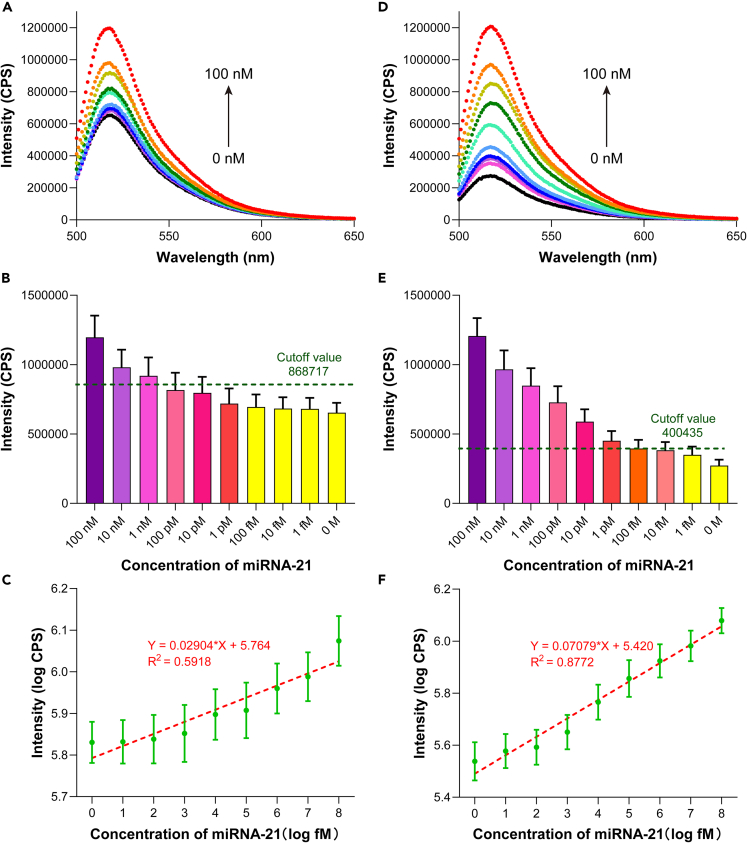
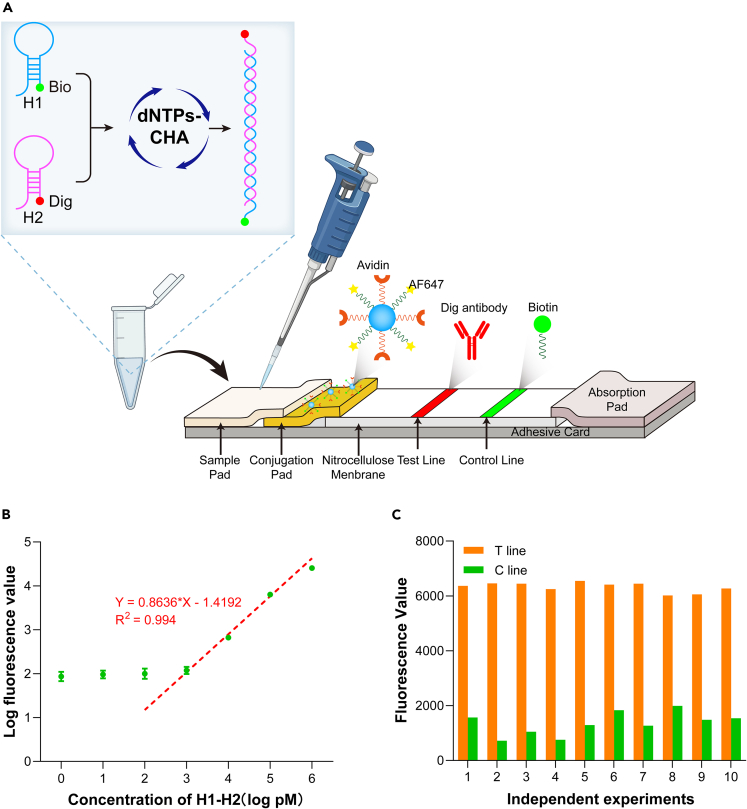
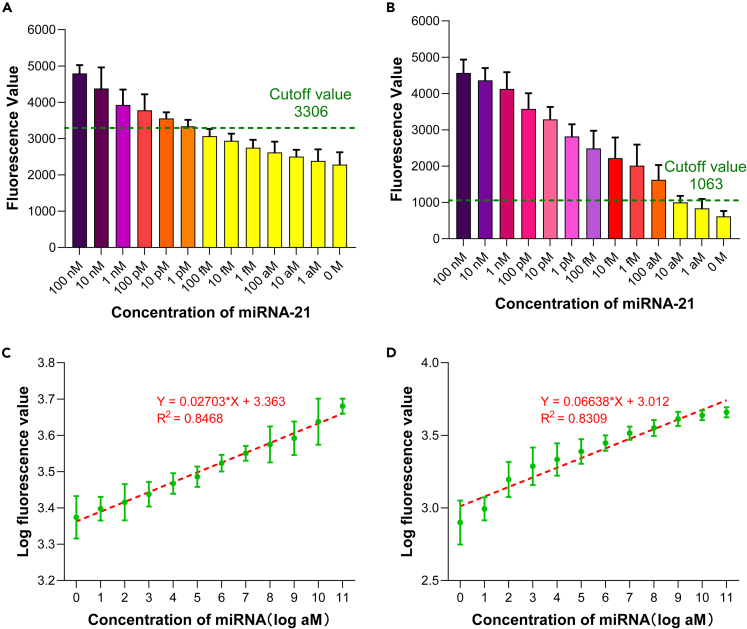
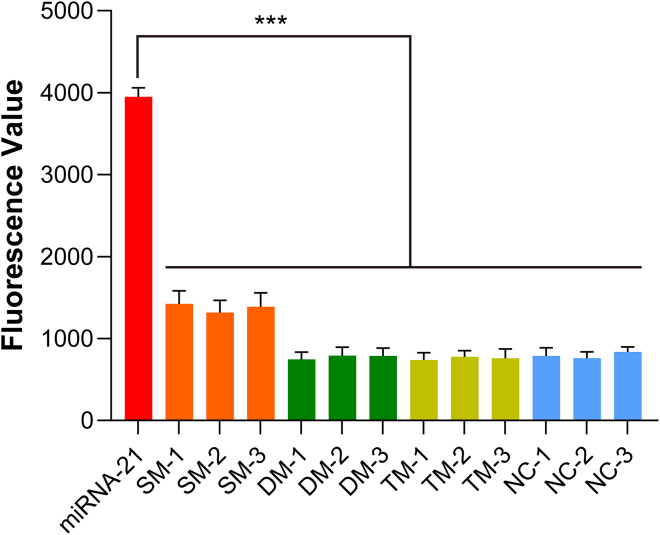
Ever since the catalytic hairpin assembly (CHA) circuit has been highlighted as a powerful nucleic acid detection tool, nucleic acid detection methods based on CHA have been widely studied. However, the detection sensitivity of CHA-based methods is insufficient. The relatively high background signals resulting from the spontaneous reaction between the two hairpin probes is one of the major reasons for limiting the sensitivity of CHA. In this study, we established that the addition of deoxynucleotide triphosphates (dNTPs) to the reaction system can significantly reduce the background leakage of CHA. The dNTPs-CHA, coupled with a fluorescence lateral flow assay strip, is used for the rapid and highly sensitive detection of miRNA. It is capable of reliably detecting miRNA in serum samples down to a limit of 100 aM, which is an improvement in the lower detection limit by nearly five orders of magnitude compared to that of the pure CHA.

Keywords: Biological sciences; Diagnostics; Molecular biology.


Conflict of interest statement

The authors declare no competing interests.

Figures

None
Graphical abstract
Figure 1
Figure 1
Design of hairpin probes and principle of the CHA (A) Design process and sequence of hairpin DNA probes. Colored lines represent strand domains and asterisks denote complementarity. (B) Principle of the CHA circuit.
Figure 2
Figure 2
Feasibility of the CHA reaction (A and B) (A) Analysis of the CHA reaction by native PAGE. lane 1: H1 probe; lane 2: H2 probe; lane 3: miRNA-21; lane 4: mixture of H1 and H2; lane 5: mixture of H1, H2, and miRNA-21; (B) Fluorescence spectra of a mixture of H1 and H2, and a mixture of H1, H2, and miRNA-21, obtained using a fluorophotometer.
Figure 3
Figure 3
Comparative effect of the dNTP-CHA and pure-CHA on background leakage (A) Schematic of DNA breathing and its impact on background leakage. (B) Representative image of background leakage in the dNTP-CHA and pure-CHA reactions verified by native PAGE. lane 1: H1; lane 2: H2; lane3: miRNA-21; lane4: H1+H2; lane5: H1+H2+miRNA-21; lane 6: H1; lane 7: H2; lane8: miRNA-21; lane9: H1+H2; lane10: H1+H2+miRNA-21. (C) Gel electrophoresis results from three independent experiments. For all odd-numbered lanes: H1+H2; for all even-numbered lanes: H1+H2+miRNA-21. (D) System kinetics of the dNTP-CHA and pure-CHA examined in real time. (E) Mean fluorescence values of six independent experiments at 60 min to elucidate the system kinetics of the dNTP-CHA and pure CHA.
Figure 4
Figure 4
Optimization of the dNTP-CHA reaction conditions (A) Effect of different reaction temperatures on the dNTP-CHA reaction. The concentrations of H1, H2, and miRNA are 1 μM. (B) Fluorescence values from six independent experiments. The fluorescence values were acquired at 60 min. Comparisons were performed with t-tests (two groups) or analysis of variance (ANOVA) (multiple groups). (C) Schematic of the reaction steps of CHA. (D) Optimization of the concentration rate of H1 and H2. The fluorescence values were from six independent experiments and acquired at 60 min. The concentration of miRNA-21 was 1 μM, and the concentration ratio of H1 and H2 is in μM. Comparisons were performed with t-tests (two groups) or ANOVA (multiple groups).
Figure 5
Figure 5
Sensitivity of the dNTP-CHA for miRNA detection (A) Typical fluorescence spectra for the detection of miRNA in the range of 0–100 nM tested using the pure-CHA. (B) Mean peak value in the fluorescence spectrum from ten independent experiments using the pure-CHA. The green dotted line is the LOD. (C) Log-log relationship between the concentration of miRNA-21 and the peak value in the fluorescence spectrum based on ten independent experiments with the pure-CHA. (D) Typical fluorescence spectra for the detection of miRNA in the range of 0–100 nM using the dNTP-CHA. (E) Mean peak value in the fluorescence spectrum based on ten independent experiments using the dNTP-CHA. The green dotted line is the LOD. (F) Log-log relationship between the concentration of miRNA-21 and the peak value of the fluorescence spectrum based on ten independent experiments using the dNTP-CHA.
Figure 6
Figure 6
Working principle and performance of the LFA strip (A) Schematic of the dNTP-CHA-LFA method for miRNA detection. (B) Log-log relationship between the concentration of biotin-double-labeled H1-H2 hybrid duplexes and the fluorescence values. The results were obtained based on ten independent tests. (C) Stability and reproducibility of the LFA. One sample with 100 nM of biotin-double-labeled H1-H2 hybrid duplexes was tested ten times using the LFA strips. The coefficient of variation (CV%) was calculated as CV = standard deviation/the mean×100%. A CV of less than 5% was set as the criterion for reliability.
Figure 7
Figure 7
dNTP-CHA coupled with LFA strip for miRNA-21 detection (A–D) Fluorescence kinetics of (A) dNTP-CHA-LFIA and (B) pure-CHA-LFIA methods with various concentrations of miRNA-21 diluted in serum. The LOD is indicated by the horizontal green dashed line. The cutoff value was calculated as the mean fluorescence value of the negative control plus three times the standard deviation. Log-log relationship between the fluorescence value and concentration of miRNA-21 tested using (C) pure-CHA-LFIA and (D) dNTP-CHA-LFIA.
Figure 8
Figure 8
Sequence specificity of the dNTP-CHA-LFA The concentration of each sequence was 1 nM. Error bars represent the standard deviation of six repetitive experiments. Three asterisks (∗) indicate p ≤ 0.001. The comparisons were performed with t-tests.

Similar articles

References

    1. Liu Y., Song J.W., Lin J.Y., Miao R., Zhong J.C. Roles of MicroRNA-122 in cardiovascular fibrosis and related diseases. Cardiovasc. Toxicol. 2020;20:463–473. doi: 10.1007/s12012-020-09603-4. - DOI - PMC - PubMed
    1. Jeffries J., Zhou W., Hsu A.Y., Deng Q. miRNA-223 at the crossroads of inflammation and cancer. Cancer Lett. 2019;451:136–141. doi: 10.1016/j.canlet.2019.02.051. - DOI - PMC - PubMed
    1. Barwari T., Joshi A., Mayr M. MicroRNAs in cardiovascular disease. J. Am. Coll. Cardiol. 2016;68:2577–2584. doi: 10.1016/j.jacc.2016.09.945. - DOI - PubMed
    1. Vishnoi A., Rani S. MiRNA biogenesis and regulation of diseases: an overview. Methods Mol. Biol. 2017;1509:1–10. doi: 10.1007/978-1-4939-6524-3_1. - DOI - PubMed
    1. Tian T., Wang J., Zhou X. A review: microRNA detection methods. Org. Biomol. Chem. 2015;13:2226–2238. doi: 10.1039/c4ob02104e. - DOI - PubMed

LinkOut - more resources