. 2023 Mar 11;26(4):106386.
doi: 10.1016/j.isci.2023.106386. eCollection 2023 Apr 21.

Tom40 in cholesterol transport

Affiliations

Tom40 in cholesterol transport

Himangshu S Bose et al. iScience. .

Abstract

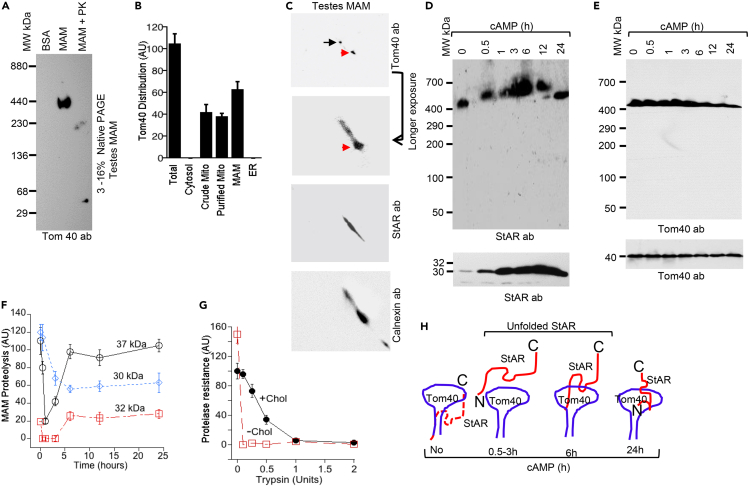
Cholesterol initiates steroid metabolism in adrenal and gonadal mitochondria, which is essential for all mammalian survival. During stress an increased cholesterol transport rapidly increases steroidogenesis; however, the mechanism of mitochondrial cholesterol transport is unknown. Using rat testicular tissue and mouse Leydig (MA-10) cells, we report for the first time that mitochondrial translocase of outer mitochondrial membrane (OMM), Tom40, is central in cholesterol transport. Cytoplasmic cholesterol-lipids complex containing StAR protein move from the mitochondria-associated ER membrane (MAM) to the OMM, increasing cholesterol load. Tom40 interacts with StAR at the OMM increasing cholesterol transport into mitochondria. An absence of Tom40 disassembles complex formation and inhibits mitochondrial cholesterol transport and steroidogenesis. Therefore, Tom40 is essential for rapid mitochondrial cholesterol transport to initiate, maintain, and regulate activity.

Keywords: Biomolecules; Cell biology; Protein folding.


Conflict of interest statement

The authors declare no competing interest.

Figures

None
Graphical abstract
Figure 1
Figure 1
Cholesterol transport through the MAM (A) Top, Pregnenolone synthesis initiated by the MAM, mitochondria, and ER fractions following incubation with isolated mitochondria from rat testes. Bottom, Western blot of the mitochondrial extract used for pregnenolone synthesis with a VDAC2 antibody. (B) Measurement of activity by transfection of full-length and N-62 StAR in COS-1 cells cotransfected with the F2 factor. 22R-hydroxy cholesterol, which bypasses the need of StAR and shows the maximum activity of a cell, was a positive control. Bottom, Western blot of the transfected cells with a VDAC2 antibody. (C–E) Direct visualization of StAR localization through immunostaining of rat testes. StAR was mostly concentrated in the MAM within clusters (D); an enlarged version (red arrow) depicts StAR at the MAM, connecting to mitochondria (E). (F) Analysis of the localization of MAM with a distance of 8, 11 and 18 nm of StAR clusters. (G) Intensity analysis of the expression of different StAR forms in the MAM (37- and 32-kDa) and ER (37-kDa) fractions through Percoll density gradient fractionation and Western blotting with a StAR antibody. (H) Cholesterol transport measured by activity (progesterone synthesis) following addition of different vesicle or lipid concentrations to the mix of MAM and mitochondria. (I) Schematic presentation showing cholesterol transport to mitochondria from the MAM associated StAR with the lipid vesicles. The scale bars of the original figures in panels C and D are 200 nm. Data in panels A, B, G and H represent the means plus standard errors of the means (SEM) for three independent experiments performed at three different times.
Figure 2
Figure 2
Tom40 complex is stabilized with cholesterol (A) Analysis of rat testes MAM complex by Western blotting with a Tom40 antibody through native gradient PAGE. (B) Quantitative analysis of Tom40 distribution pattern in the MAM complex detected by Western blotting with a Tom40 antibody. (C) The Tom40 complex was excised from 1D native PAGE, Panel A, and was further analyzed through 2D native PAGE by Western blotting with Tom40, StAR, and calnexin antibodies independently. Enhanced exposure for 20 min (indicated with an arrow) showed the presence of a major complex of 230 kDa and the minor complex of 140 kDa (second from the top). Similar 2D native PAGE analysis and Western blotting with a StAR antibody showed only one major complex of 140 kDa (third from the top). Similar 2D analysis of the native PAGE of the MAM fraction and staining with calnexin antibody showed one major complex of 100 kDa and another complex of 240 kDa (bottom). (D and E) Top, Kinetics of antibody shift experiment after stimulation with cAMP following incubation of StAR (D) and Tom40 antibodies with the MAM fraction isolated from rat testes, analysis through a native gradient PAGE, and staining with StAR (D) and Tom40 antibodies independently. Bottom (D) Western blot analysis of the MAM fraction following cAMP-stimulated MAM fractions and staining with a StAR and Tom40 antibody. (F) Quantitative analysis of the total MAM complex, isolated after stimulation with cAMP for different times, were solubilized with digitonin and then proteolyzed with 0.5U of trypsin for 10 min followed by Western blotting with StAR antibody. The intensity of the protection of specific StAR expression is indicated directly. (G) Analysis of CFS 35S-StAR import kinetics into isolated mitochondria for 30 min in the presence (black solid line, -·-) and absence (broken red line, --□--) of cholesterol followed by proteolysis with the indicated concentrations of trypsin for 10 min. (H) Schematic presentation of mitochondrial import of StAR through Tom40 during acute regulation, where the red line indicates StAR and blue line indicates Tom40. In the absence of stimulation or prior to acute stress, StAR is not imported or formed a complex with Tom40. During acute regulation, newly synthesized StAR remains close to mitochondria and in a partially unfolded but stable conformation associated with cholesterol. As a result, the protein is partially proteolyzed quickly. Once the newly synthesized StAR is imported, further import continues for up to 6 h. The solid red lines are the newly synthesized StAR that will be imported. Data in panels B, F and G represent the means plus standard errors of the means (SEM) for three independent experiments performed at three different times.
Figure 3
Figure 3
Tom40 participation in cholesterol metabolism (A) Top, Western blotting of COS-1 transfected cells with and without Tom40 knockdown with a StAR antibody. Second, Third and Bottom, Western blot of the StAR-transfected cells with or without Tom40 knockdown probed with Tom40 (Second), GAPDH (Third) and VDAC2 (Bottom) antibodies independently. (B) Metabolic activity as measured by pregnenolone synthesis in StAR-transfected COS-1 cells with and without Tom40 knockdown. (C) StAR expression following incubation of negative control siRNA, Tom40 siRNA and mCCCP in COS-1 cells by staining with a StAR antibody. Middle and Bottom, Western blot of the same transfected cells with Tom40 (Middle) and GAPDH (Third) antibodies independently. (D) Localization of Tom22 through immunoelectron microscopy. Right hand panel (Figure Db) is the enlargement of a mitochondrion from left panel (Figure Da). (E) Simultaneous localization of Tom40 (55 nm, red arrow) and Tom22 (15 nm, blue arrow) is the knockdown (Ec) and wild-type (Ea) cells probing with the antibodies together. Panel Eb and Ed is the enlargement of from panel Ea and Ec showing Tom40 and Tom22. The panels Da, Ea and Ec scale bars are 200 nm. (F) Cell viability assay using MA-10 (Solid black line with open round circle, ⸺○⸺), ΔTom40 MA10 (Broken green lines with diamond, - - ◊- -), COS-1 (solid pink line with solid cross, ⸺×⸺) and ΔTom40 COS-1 (Red dotted line with solid dot … · …) cells over 0, 6, 12, 18, 24, 36, 48, 72 and 96 h. MCF-7 (Large broken blue line with blue square, ⸺□⸺) cells incubated with zeranol were a positive control showing toxicity after 24 h. (G and H) Import of CFS 35S-SCC into the mitochondria of MA-10 (G) and ΔTom40 MA-10 (H) cells. Bottom panels (G, H) are the Western blots with a VDAC2 antibody showing total amount of mitochondria in both import experiments. (I) Western blot of the Tom22 knockdown MA-10 cells with Tom40 (Top), VDAC2 (middle), and GAPDH antibodies independently. (J) Activity of mitochondria isolated from MA-10 and Tom-40 knockdown MA-10 cells following incubation of the same amount of biosynthetic StAR. The water soluble 22R-hydroxy cholesterol, which bypasses the need of StAR to foster cholesterol into mitochondria and shows maximum activity, was a positive control. Data in panels B, F and J are the mean ± S.E.M. of at least three independent experiments.
Figure 4
Figure 4
Direct identification of Tom40-StAR interaction (A) StAR association with Tom40 followed by import. CFS 35S-StAR was imported into the isolated mitochondria from MA-10 cells with and without Tom40 knockdown. The import reaction complex was solubilized with digitonin and analyzed through 4–16% native gradient PAGE. The right panel is the longer exposure of the left. (B) Direct interaction of Tom40 and StAR. In vitro chemical crosslinking with the indicated concentration of BS3 (crosslinker) for 30 min with mitochondria isolated from MA-10 cells and detected by Western blotting with Tom40 and StAR antibodies independently. (C and D) LC MS/MS analysis of the Tom40 complex from panel B, confirming the presence of Tom40 in the complex. (E and J) Localization of StAR and Tom40 by electron microscopy using antibodies specific for StAR (E, Red arrow) and Tom40 (G, Cyan arrow) or together (I). The right panels (F, H and J) are the enlarged images from left panels (E, G and I). The nanogold particle size 15 nm is for Tom40 and 55 nm for StAR. The scale bars in all the panels (E, F and H) are 200 nm. (K) Electron microscopic characterization with no antibody (K). Right hand panel (L) is the enlargement of a mitochondrion from left panel (L). (M) Schematic presentation showing that StAR (red solid line) is associated with the Tom40 import channel during mitochondrial import.
Figure 5
Figure 5
Import into the mitochondria is regulated through amino terminal folding (A) Activity as measured by pregnenolone synthesis following wild-type StAR and A10T StAR overexpression in COS-1 cells cotransfected with F2 vector. Trilostane was added to inhibit 3βHSD2 activity. (B) Import kinetics analysis of the mutant A10T (broken line in blue with open square, ---□---) and wild-type StAR (solid lines in red in open circle, ⸺○⸺) into the isolated mitochondria of MA-10 cells with the indicated time. (C) Comparison of simultaneous competition of import between 35S-A10T StAR with wild-type StAR (---□---) and A10T StAR with 35S-StAR (⸺○⸺) into isolated mitochondria for 2 h, where both the A10T and StAR were incubated at the same time with the indicated pattern. (D) Competition of import from panel C. Top, mitochondria (open cylinder) were incubated with cold StAR (red solid circle, •) and 35S-A10T StAR (blue solid circle, •) together performed from 5 min to 2 h 35S-A10T StAR was imported fast and thus occupied most of the matrix side leaving very little room for StAR. Signal of the imported fragment was high. Bottom, Mitochondria (open cylindrical box) were incubated with 35S-StAR (open circle, ○) and cold A10T StAR (•) for 5 min to 2 h. Cold A10T StAR was imported rapidly, resulting in limited 35S-StAR import. The imported signal was very weak as indicated by low intensity. (E) Determination of import saturation limit. Mitochondria were incubated first with cold StAR for 30, 60 and 90 min and then 35S-A10T-StAR was added for 90, 60 and 30 min for a total of 2 h. In another set of experiments, 35S-StAR was imported for 30, 60 and 90 min and then A10T-StAR was added for 90, 60 and 30 min for a total of 2 h. The import efficiency was determined with the intensity of 30-kDa StAR. Data in panels A-C and E represent the means plus standard errors of the means (SEM) for three independent experiments performed at three different times.
Figure 6
Figure 6
Mechanism of interaction of Tom40 with the turn-helix-turn sequence (A) Schematic presentation of the helical region of the amino acids at the mitochondrial pause sequence of StAR. The amino acids generating the specific folding are shown in the arrow where 1–30 amino acids have no specific folding. The lipid binding passenger protein sequence from 63–285 has a turn-helix-turn folding. (B–G) Wild-type (WT) and deletional mutagenesis of the indicated StAR fusions employed in mitochondrial import were labeled with 35S-methionine synthesized in cell-free system. Membrane association was analyzed first by washing with the buffer and separation via centrifugation. Membrane integration was analyzed by incubation of the membrane association fractions with sodium carbonate followed by separation by centrifugation. The pelleted fraction is denoted by P, supernatant fraction is S, and de novo CFS methionine-labeled proteins are labeled as CFS. The constructs included full-length (WT), Del StAR (Δ31-62), Mut 1 StAR (Δ31-45), Mut2 (Δ47-62), Del2 StAR (Δ38-62), and Del 11 StAR (Δ34-58). (H) Metabolic activity of the wild-type and internal deletional mutants. COS-1 cells were transfected with the indicated deletion mutants and F2 factor. (I) Summary of the mitochondrial import of wild-type and different N-terminal deletional mutants and their activity, as determined by pregnenolone synthesis. The broken lines show the deletion of amino acids from the indicated region, and the solid lines show the unchanged amino acids. The symbol Y denotes as a cleavage (Y), and no cleavage following mitochondrial import is denoted as N. The activity of the deletion mutants were compared with full-length StAR, which was set as 100. Data in panel H represent the means plus standard errors of the means (SEM) for three independent experiments performed at three different times.
Figure 7
Figure 7
Schematic presentation of the gradual integration of StAR into the mitochondrial Tom40 channel StAR is initially folded at the MAM via GRP78 and then targeted to mitochondria. The pause sequence (amino acids 31–62) of StAR interacts with Tom40 in a loop formation, resulting in slower processing and changes in folding that are essential to gradually pass through the import channel. Once the pause sequence is completely inserted, StAR finally enters into the mitochondria.

References

    1. Miller W.L., Bose H.S. Early steps in steroidogenesis: intracellular cholesterol trafficking. J. Lipid Res. 2011;52:2111–2135. - PMC - PubMed
    1. Clark B.J., Wells J., King S.R., Stocco D.M. The purification, cloning and expression of a novel luteinizing hormone-induced mitochondrial protein in MA-10 mouse Leydig tumor cells. Characterization of the steroidogenic acute regulatory protein (StAR) J. Biol. Chem. 1994;269:28314–28322. - PubMed
    1. Tsujishita Y., Hurley J.H. Structure and lipid transport mechanism of a StAR-related domain. Nat. Struct. Biol. 2000;7:408–414. - PubMed
    1. Artemenko I.P., Zhao D., Hales D.B., Hales K.H., Jefcoate C.R. Mitochondrial processing of newly synthesized steroidogenic acute regulatory protein (StAR), but not total StAR, mediates cholesterol transfer to cytochrome P450 side chain cleavage enzyme in adrenal cells. J. Biol. Chem. 2001;276:46583–46596. - PubMed
    1. Wang X., Liu Z., Eimerl S., Timberg R., Weiss A.M., Orly J., Stocco D.M. Effect of truncated forms of the steroidogenic acute regulatory (StAR) protein on intramitochondrial cholesterol transfer. Endocrinology. 1998;139:3903–3912. - PubMed

LinkOut - more resources