. 2023 Mar 22:13:1138049.
doi: 10.3389/fonc.2023.1138049. eCollection 2023.

Identification of a centrosome-related prognostic signature for breast cancer

Affiliations

Identification of a centrosome-related prognostic signature for breast cancer

Zhou Fang et al. Front Oncol. .

Abstract

Background: As the major microtubule organizing center in animal cells, the centrosome is implicated with human breast tumor in multiple ways, such as promotion of tumor cell immune evasion. Here, we aimed to detect the expression of centrosome-related genes (CRGs) in normal and malignant breast tissues, and construct a novel centrosome-related prognostic model to discover new biomarkers and screen drugs for breast cancer.

Methods: We collected CRGs from the public databases and literature. The differentially expressed CRGs between normal and malignant breast tissues were identified by the DESeq2. Univariate Cox and LASSO regression analyses were conducted to screen candidate prognostic CRGs and develop a centrosome-related signature (CRS) to score breast cancer patients. We further manipulated and visualized data from TCGA, GEO, IMvigor210, TCIA and TIMER to explore the correlation between CRS and patient outcomes, clinical manifestations, mutational landscapes, tumor immune microenvironments, and responses to diverse therapies. Single cell analyses were performed to investigate the difference of immune cell landscape between high- and low-risk group patients. In addition, we constructed a nomogram to guide clinicians in precise treatment.

Results: A total of 726 CRGs were collected from the public databases and literature. PSME2, MAPK10, EIF4EBP1 were screened as the prognostic genes in breast cancer. Next, we constructed a centrosome-related prognostic signature and validated its efficacy based on the genes for predicting the survival of breast cancer patients. The high-risk group patients had poor prognoses, the area under the ROC curve for 1-, 3-, and 5-year overall survival (OS) was 0.77, 0.67, and 0.65, respectively. The predictive capacity of CRS was validated by other datasets from GEO dataset. In addition, high-risk group patients exhibited elevated level of mutational landscapes and decreased level of immune infiltration, especially T and B lymphocytes. In terms of treatment responses, patients in the high-risk group were found to be resistant to immunotherapy but sensitive to chemotherapy. Moreover, we screened a series of candidate anticancer drugs with high sensitivity in the high-risk group.

Conclusion: Our work exploited a centrosome-related prognostic signature and developed a predictive nomogram capable of accurately predicting breast cancer OS. The above discoveries provide deeper insights into the vital roles of the centrosome and contribute to the development of personalized treatment for breast cancer.

Keywords: CRSS; breast cancer; centrosome; immune; machine algorithm; prognostic model.


Conflict of interest statement

The authors declare that the research was conducted in the absence of any commercial or financial relationships that could be construed as a potential conflict of interest.

Figures

Figure 1
Figure 1
Identification of differentially expressed centrosome-related genes and functional analysis. (A) Volcano plot of the differentially expressed centrosome-related DEGs by comparing breast cancer tissues to normal prostate tissues from TCGA-BRCA cohort. Blue represents downregulated genes, and red represents upregulated genes in BRCA. p< 0.05, |log2 fold change| > 1.0. (B) Principal component analysis (PCA) of TCGA-BRCA cohort for optimal k = 2. (C) Heatmaps of centrosome-related DEGs. (D) GO enrichment of upregulated centrosome-related DEGs. (E) KEGG pathways of upregulated centrosome-related DEGs.
Figure 2
Figure 2
Establishment and stability validation of centrosome-related prognostic model. (A) The Least Absolute Shrinkage and Selection Operator (LASSO) Cox regression for the centrosome-related prognostic DEGs. (B) The multivariable Cox regression analysis of five genes based on cross-validation and the minimum partial likelihood deviance to further demonstrate the independent prognosis-related genes and obtain the genes index. (C) Kaplan–Meier analysis for OS curves of patients from TCGA-BRCA in high/low-risk subgroups in training cohort. (D) Kaplan–Meier analysis for OS curves of patients from GEO in high/low-risk subgroups in validation cohort. (E) Distribution of CRSS and patterns of the survival time and survival status between the high/low-risk subgroups for the training set. (F) Distribution of CRSS and patterns of the survival time and survival status between the high/low-risk subgroups for the validation set. (G) Time-related ROC analysis exhibited the prognostic value of the CRSS in the training set. (H) Time-related ROC analysis exhibited the prognostic value of the CRSS in the validation set. The asterisks represent the statistical P value (*p < 0.05; **p < 0.01; ***p < .001).
Figure 3
Figure 3
Functional analysis of centrosome-related prognostic model. (A) GO enrichment of centrosome-related DEGs in low-risk subgroups. (B) KEGG pathways of centrosome-related DEGs in low-risk subgroups. (C) Gene set enrichment analysis (GSEA) of centrosome-related prognostic model. (D) Analysis of 14 cancer-related pathway activities score. The asterisks represent the statistical P value (*p < 0.05; **p < 0.01; ***p < .001; ****p < 0.0001; ns p > 0.05).
Figure 4
Figure 4
Mutation analysis of centrosome-related prognostic model. (A) Comparison of the mutation landscape between groups with high/low-risk. (B) Tumor mutant burden (TMB) difference among groups with high/low-risk. (C) Kaplan-Meier analyses of OS in breast cancer patients, stratified according to TMB values. (D) Kaplan-Meier analyses of OS in breast cancer patients stratified according to the combination of CRSS and TMB. The asterisks represent the statistical P value (****p < 0.0001).
Figure 5
Figure 5
Diverse tumor immune microenvironments among high/low-risk patients. (A) Immune score in high/low-risk subgroups. (B) Tumor purity in high/low-risk subgroups. (C) Spearman correlation between Immune score and CRSS. (D) The differential estimated proportion of 22 CIBERSORT immune cell types in high/low-risk subgroups. The central line represents the median value. The bottom and top of the boxes are the 25th and 75th percentiles (interquartile range). The whiskers encompass 1.5 times the interquartile range. (E) Activities of seven-step cancer immune cycle. (F) Immune response score in high/low-risk groups. (G) The expression of immune-related checkpoints genes among high/low-risk subgroups. (H) Correlations between CRSS and expression of immune-related checkpoints genes. The asterisks represent the statistical P value (*p < 0.05; **p < 0.01; ***p < .001; ****p < 0.0001; ns p > 0.05).
Figure 6
Figure 6
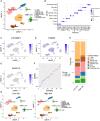
Distinct cellular composition of high/low-risk breast cancer patients at single-cell resolution. (A) Cells were clustered into eight types via tSNE dimensionality reduction algorithm, each color represented the annotated phenotype of each cluster. (B) Dot plot of the top three marker genes expression of each cluster. (C–E) Expression of three centrosome-related prognostic genes in each cluster. (F) CRSS of 24 samples from breast cancer single cell dataset GSE176078. (G) eight cell clusters in the high/low-risk groups were identified via tSNE dimensionality reduction algorithm. (H) The proportion of cells in high/low-risk groups of breast cancer single cell dataset GSE176078.
Figure 7
Figure 7
Validation of immunotherapy response and the difference of anticancer drug sensitivity. (A, B) Immunophenoscore (IPS) score in high/low-risk subgroups. (C) Kaplan–Meier survival curve of the patients in high/low-risk groups for OS in the PD-1/PD-L1 treatment cohort (IMvigor210). (D) Analysis of the immunotherapy response between high/low-risk groups in the high-grade melanoma immunotherapy cohort (GSE35640). (E) Analysis of the neoadjuvant chemotherapy between high/low-risk group in breast cancer cohort (GSE123845). (F) The IC50 of Tamoxifen among high/low-risk groups. (G)The IC50 of Bortezomib among high/low-risk groups. (H) The IC50 of Lapatinib among high/low-risk groups. The asterisks represent the statistical P value (**p < 0.01; ***p < .001; ****p < 0.0001).
Figure 8
Figure 8
The calculation of centrosome-related prognostic nomogram. (A) The prognostic nomogram to predict the 1-, 3-, and 5-year OS of breast cancer patients. For each patient, we calculated the points of the clinical–pathological features and summed up the points to obtain the total points. The predicted 1-, 3-, and 5-year OS can be estimated based on the total points of each patient. (B) The calibration curves for predicting patient survival at 1-year OS. (C) The calibration curves for predicting patient survival at 3-year OS. (D) The calibration curves for predicting patient survival at 5-year OS.

Similar articles

Cited by

References

    1. Teichgraeber DC, Guirguis MS, Whitman GJ. Breast cancer staging: Updates in the AJCC cancer staging manual, 8th edition, and current challenges for radiologists, from the AJR special series on cancer staging. AJR Am J Roentgenol (2021) 217(2):278–90. doi: 10.2214/AJR.20.25223 - DOI - PubMed
    1. Tsang JYS, Tse GM. Molecular classification of breast cancer. Adv Anat Pathol (2020) 27(1):27–35. doi: 10.1097/PAP.0000000000000232 - DOI - PubMed
    1. Liang Y, Zhang H, Song X, Yang Q. Metastatic heterogeneity of breast cancer: Molecular mechanism and potential therapeutic targets. Semin Cancer Biol (2020) 60:14–27. doi: 10.1016/j.semcancer.2019.08.012 - DOI - PubMed
    1. Burstein HJ, Curigliano G, Thürlimann B, Weber WP, Poortmans P, Regan MM, et al. . Customizing local and systemic therapies for women with early breast cancer: the St. Gallen international consensus guidelines for treatment of early breast cancer 2021. Ann Oncol (2021) 32(10):1216–35. doi: 10.1016/j.annonc.2021.06.023 - DOI - PMC - PubMed
    1. Emens LA. Breast cancer immunotherapy: Facts and hopes. Clin Cancer Res (2018) 24(3):511–20. doi: 10.1158/1078-0432.CCR-16-3001 - DOI - PMC - PubMed