. 2023 Mar 23:11:1076458.
doi: 10.3389/fcell.2023.1076458. eCollection 2023.

Dual inhibition of EZH2 and G9A/GLP histone methyltransferases by HKMTI-1-005 promotes differentiation of acute myeloid leukemia cells

Affiliations

Dual inhibition of EZH2 and G9A/GLP histone methyltransferases by HKMTI-1-005 promotes differentiation of acute myeloid leukemia cells

Y Sbirkov et al. Front Cell Dev Biol. .

Abstract

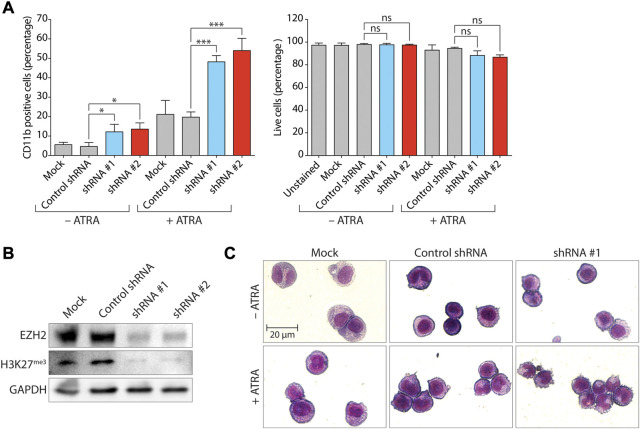
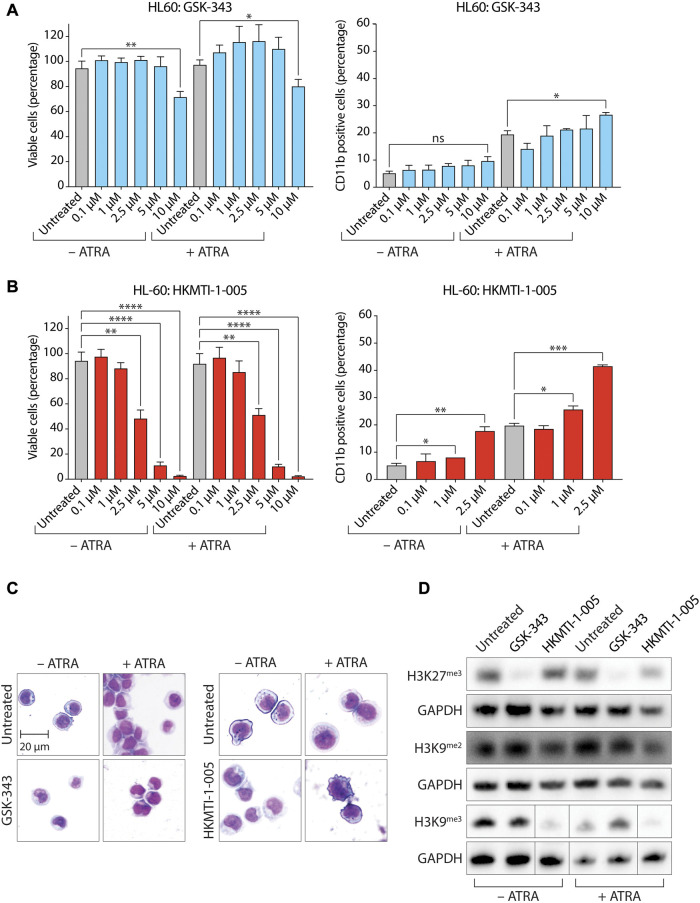
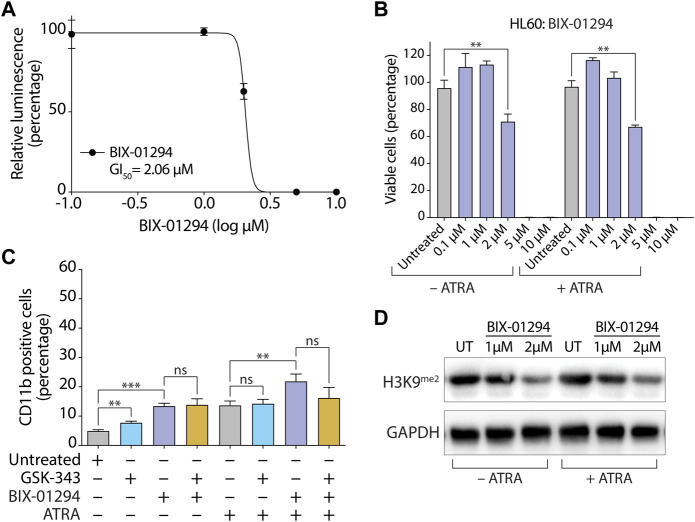
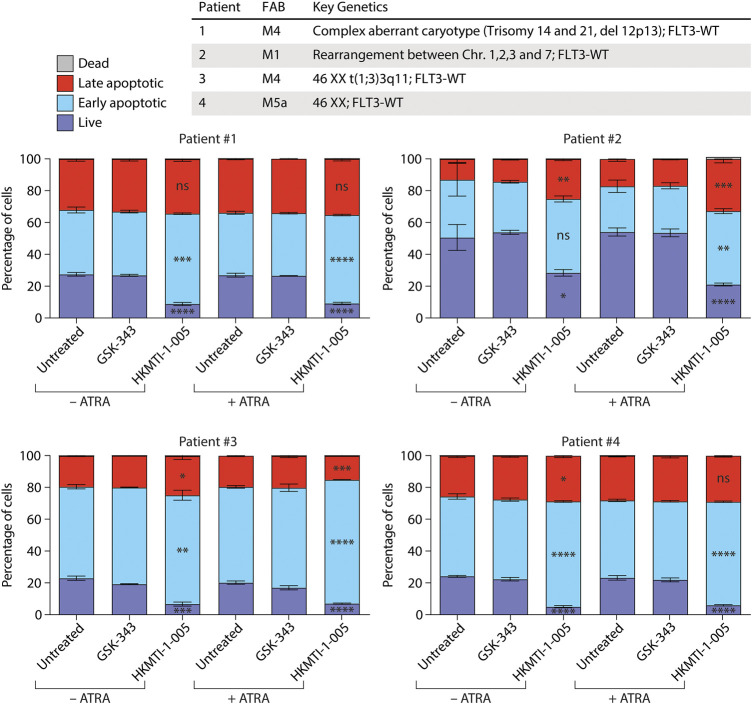
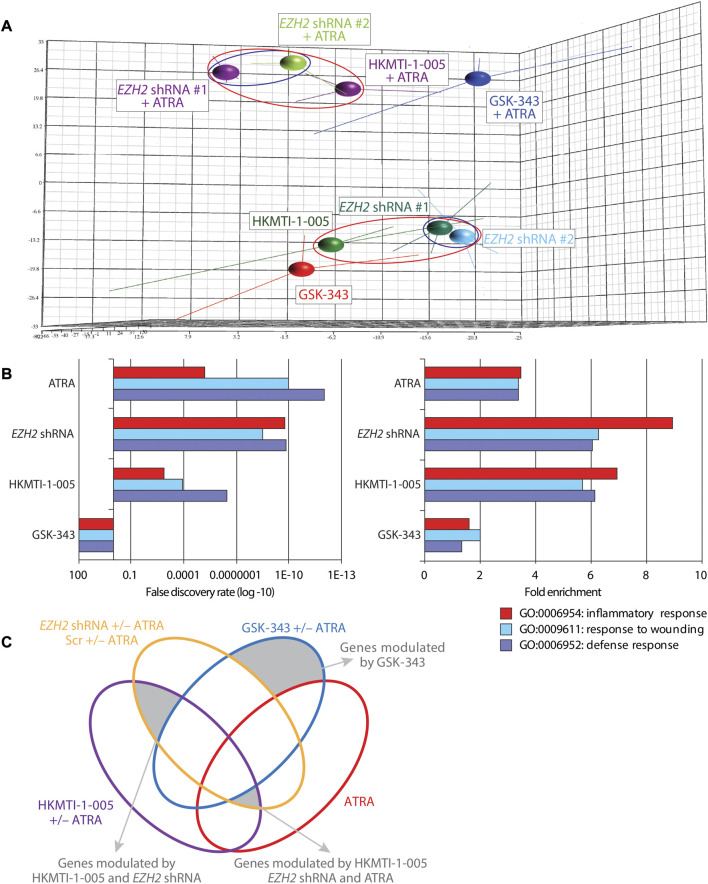
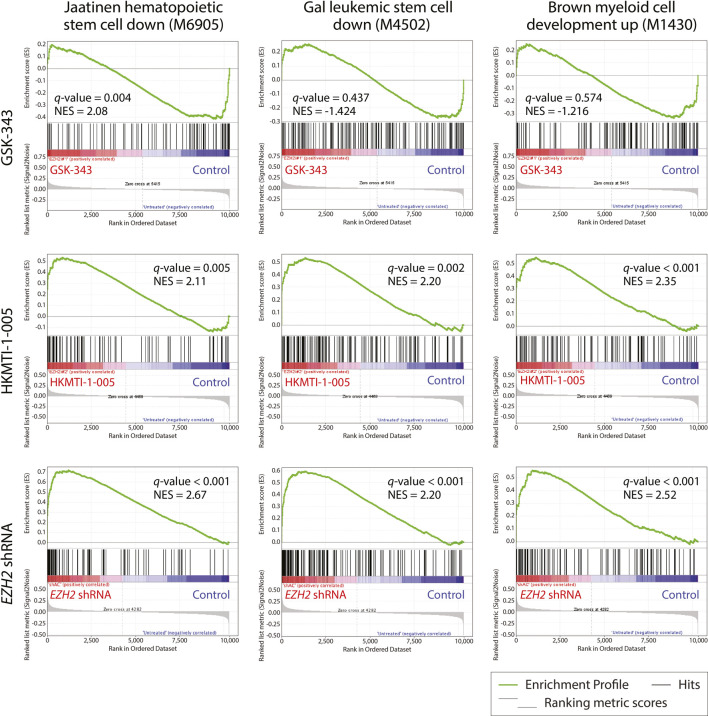
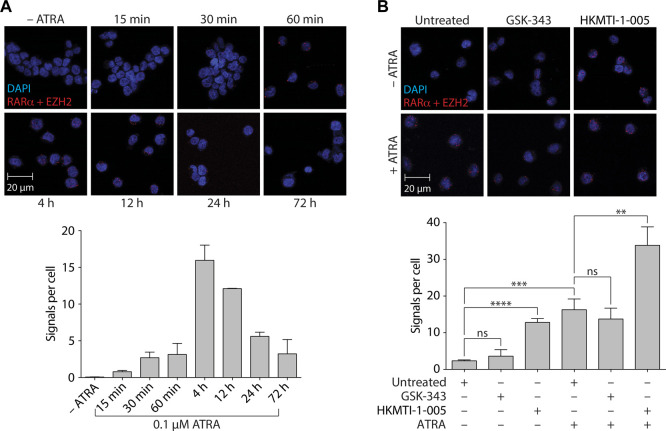
All-trans-retinoic acid (ATRA)-based differentiation therapy of acute promyelocytic leukemia (APL) represents one of the most clinically effective examples of precision medicine and the first example of targeted oncoprotein degradation. The success of ATRA in APL, however, remains to be translated to non-APL acute myeloid leukemia (AML). We previously showed that aberrant histone modifications, including histone H3 lysine 4 (H3K4) and lysine 27 (H3K27) methylation, were associated with this lack of response and that epigenetic therapy with small molecule inhibitors of the H3K4 demethylase LSD1/KDM1A could reprogram AML cells to respond to ATRA. Serving as the enzymatic component of Polycomb Repressive Complex 2, EZH2/KMT6A methyltransferase plays a critical role in normal hematopoiesis by affecting the balance between self-renewal and differentiation. The canonical function of EZH2 is methylation of H3K27, although important non-canonical roles have recently been described. EZH2 mutation or deregulated expression has been conclusively demonstrated in the pathogenesis of AML and response to treatment, thus making it an attractive therapeutic target. In this study, we therefore investigated whether inhibition of EZH2 might also improve the response of non-APL AML cells to ATRA-based therapy. We focused on GSK-343, a pyridone-containing S-adenosyl-L-methionine cofactor-competitive EZH2 inhibitor that is representative of its class, and HKMTI-1-005, a substrate-competitive dual inhibitor targeting EZH2 and the closely related G9A/GLP H3K9 methyltransferases. We found that treatment with HKMTI-1-005 phenocopied EZH2 knockdown and was more effective in inducing differentiation than GSK-343, despite the efficacy of GSK-343 in terms of abolishing H3K27 trimethylation. Furthermore, transcriptomic analysis revealed that in contrast to treatment with GSK-343, HKMTI-1-005 upregulated the expression of differentiation pathway genes with and without ATRA, while downregulating genes associated with a hematopoietic stem cell phenotype. These results pointed to a non-canonical role for EZH2, which was supported by the finding that EZH2 associates with the master regulator of myeloid differentiation, RARα, in an ATRA-dependent manner that was enhanced by HKMTI-1-005, possibly playing a role in co-regulator complex exchange during transcriptional activation. In summary, our results strongly suggest that addition of HKMTI-1-005 to ATRA is a new therapeutic approach against AML that warrants further investigation.

Keywords: EZH2/KMT6A; G9A/EHMT2; GLP/EHMT1; HKMTI-1-005; RARα; acute myeloid leukemia (AML); all-trans retinoic acid (ATRA); differentiation.


Conflict of interest statement

The authors declare that the research was conducted in the absence of any commercial or financial relationships that could be construed as a potential conflict of interest.

Figures

FIGURE 1
FIGURE 1
Knockdown of EZH2 promotes differentiation of HL-60 AML cells by ATRA. (A) Expression of the myeloid differentiation marker CD11b (left panel), and proportion of live cells (PI-negative population, right panel) following lentivirally-mediated knockdown (KD) of EZH2 expression and analysis by flow cytometry. EZH2 KD was achieved using two different short-hairpin RNA sequences (shRNA #1 and #2) as indicated. A non-targeting shRNA was used as a negative control. Values represent the means of three experiments and error bars denote standard deviations. *p < 0.05; ***p < 0.001; ns, no statistical significance. (B) Immunoblot analysis of levels of EZH2 protein and trimethylated H3 Lys27 (H3K27me3) following EZH2 KD. Transduced cells were selected with puromycin and expanded for a minimum of 10 days. GAPDH was used as a loading control. (C) Cell morphology of cells analyzed by May-Grunwald Giemsa staining following EZH2 KD (shRNA #1) +/− ATRA (0.1 µM for 72 h).
FIGURE 2
FIGURE 2
Dual inhibition of EZH2-G9A/GLP by HKMTI-1-005 promotes differentiation of HL-60 AML cells by ATRA. (A) Proportion of viable cells as determined by CellTiter-Glo cell viability assay (left panel), and expression of the myeloid differentiation marker CD11b (right panel) following treatment with the indicated concentrations of GSK-343 +/− 0.1 µM ATRA for 72 h. (B) Proportion of viable cells as determined by CellTiter-Glo cell viability assay (left panel) and expression of the myeloid differentiation marker CD11b (right panel) following treatment with the indicated concentrations of HKMTI-1-005 +/− 0.1 µM ATRA for 72 h. Values represent the means of three experiments (viability assays) or two experiments (CD11b flow cytometry). Error bars denote standard deviations. *p < 0.05; **p < 0.01; ***p < 0.001; ****p < 0.0001; ns, no statistical significance. (C) Cell morphology of cells analyzed by May-Grunwald Giemsa staining following treatment with 10 µM GSK-343 (left panel) or 2.5 µM HKMTI-1-005 (right panel) for 72 h. Treatments were performed +/− 0.1 µM ATRA. (D) Immunoblot analysis of levels of trimethylated H3 Lys27 (H3K27me3), dimethylated H3 Lys9 (H3K9me2) and trimethylated H3 Lys9 (H3K9me3) following treatment (72 h) with 10 µM GSK-343 or 2.5 µM HKMTI-1-005 +/− 0.1 µM ATRA as indicated. GAPDH was used as a loading control.
FIGURE 3
FIGURE 3
Inhibition of G9A/GLP by BIX-01294 promotes moderate differentiation in HL-60 cells. (A) Determination of GI50 concentration for BIX-01294 in HL-60 cells. Cells were seeded at 20,000 cells per well and treated for 72 h with different concentrations of BIX-01294 as indicated. The growth inhibitory (GI50) concentration was determined by measuring cell viability with CellTiter-Glo and generating a dose-response curve (GraphPad Prism, version 9.5.0). (B) Proportion of viable cells as determined by CellTiter-Glo cell viability assay following treatment with the indicated concentrations of BIX-01294 +/− 0.1 µM ATRA for 72 h. (C) Flow cytometry quantification of the percentage of CD11b positive cells after treatment with 2 µM BIX-01294 and/or 10 µM GSK-343 +/− 0.1 µM ATRA for 72 h. Values represent the means of three experiments and error bars denote standard deviations. **p < 0.01; ***p < 0.001; ns, no statistical significance. (D) Immunoblot analysis of levels of dimethylated H3 Lys9 (H3K9me2) following treatment with 2 µM BIX-01294 +/− 0.1 µM ATRA for 72 h. GAPDH was used as a loading control.
FIGURE 4
FIGURE 4
HKMTI-1-005 diminishes cell viability of primary AML cells. Primary AML cells from patients were treated with 10 µM GSK-343 or 2.5 µM HKMTI-1-005 for 48 h. Treatments were performed +/− 0.1 µM ATRA. The proportions of live, early apoptotic, late apoptotic and dead cells were evaluated by uptake of propidium iodide (PI) and Annexin V as measured by flow cytometry. Values represent the means of three experiments and error bars denote standard deviations. p values refer to percentages of live, early or late apoptotic cells treated with HKMTI-1-005 compared with untreated, or HKMTI-1-005 plus ATRA compared with ATRA alone. *p < 0.05; **p < 0.01; ***p < 0.001; ****p < 0.0001; ns, no statistical significance. No statistically significant change was observed in the percentages of live, early or late apoptotic cells for cells treated with GSK-343 compared with untreated, or GSK-343 plus ATRA compared with ATRA alone. No statistically significant change was observed in dead cells.
FIGURE 5
FIGURE 5
Differential gene expression following EZH2 knockdown or inhibition with GSK-343 or HKMTI-1-005 in HL-60 AML cells. (A) Principal component analysis (PCA; covariance) of GCRMA-normalized expression array samples in biological triplicates represented with centroids as annotated: two different EZH2-targeting shRNAs and one non-targeting control (days ∼10–20 post transduction), 10 µM GSK-343 or 2.5 µM HKMTI-1-005 +/− 0.1 µM ATRA following treatment for 72 h. Red or blue ellipses highlight specific grouping of samples of interest. (B) Gene ontology (GO) analysis of upregulated genes following EZH2 KD or drug treatment as annotated (0.1 µM ATRA, 10 µM GSK-343, 2.5 µM HKMTI-1-005 for 72 h) showing enrichment score (left panel) and fold-enrichment over control (right panel) of genes belonging to the indicated categories. (C) Venn diagram showing groups of genes taken for further analysis that belong exclusively to GSK-343 treated cells, or are shared only between EZH2 KD and HKMTI-1-005 treated cells, or between EZH2 KD, HKMTI-1-005 and ATRA, but not GSK-343 treated cells. Gene groups are shaded grey and indicated.
FIGURE 6
FIGURE 6
Gene set enrichment analysis (GSEA) of gene expression in HL-60 cells reveals opposite effects of GSK-343 and HKMTI-1-005 on stem cell and differentiation programs. Gene expression data were generated by expression microarray analysis following 72 h treatment with 10 µM GSK-343 or 2.5 µM HKMTI-1-005, or EZH2 KD versus untreated control and analyzed using GSEA to extract biological knowledge. Highly significantly enriched gene sets are indicated by their standard and systematic names. The most upregulated genes in treatment or EZH2 KD samples are shown on the left side (red), while the most upregulated genes in the control are shown on the right side (blue). Black bars represent the positions of the treatment or EZH2 KD samples versus vehicle control upregulated signature genes in the ranked list. Green curves represent the evolution of gene density. Normalized enrichment scores (NES) reflect the degree to which genes were overrepresented. When the distribution is random, the enrichment score is zero. Enrichment of signature genes at the top of the ranked list results in a large positive deviation of the NES from zero. q-value = FDR-adjusted p-value.
FIGURE 7
FIGURE 7
ATRA-mediated differentiation promotes an association between RARα and EZH2 in HL-60 cells that is inhibited by GSK-343 and enhanced by HKMTI-1-005. (A) Proximity ligation assay (PLA) analyzing RARα/EZH2 complexes following 0.1 µM ATRA treatment for the indicated times. (B) PLA analyzing RARα/EZH2 complexes following treatment with 10 µM GSK-343 or 2.5 µM HKMTI-1-005 for 4 h. Treatments were performed +/− 0.1 µM ATRA as indicated. Upper panels show representative fields of view of cells indicating proximity (< 40 nm) of antibody conjugated PLA probes that have been ligated, amplified, and detected with complementary fluorescent probes. Red dots represent the presence of RARα/EZH2 interactions. Scale bars, 20 µm. Cell nuclei are counterstained with DAPI (blue). Lower panels show mean values of signals (red dots) per cell representing RARα/EZH2 interactions. Values represent the means of two experiments (A) or three experiments (B), and error bars denote standard deviations. **p < 0.01; ***p < 0.001; ****p < 0.0001; ns, no statistical significance.

Similar articles

Cited by

References

    1. Anwar T., Gonzalez M. E., Kleer C. G. (2021). Noncanonical functions of the polycomb group protein EZH2 in breast cancer. Am. J. Pathol. 191 (5), 774–783. 10.1016/j.ajpath.2021.01.013 - DOI - PMC - PubMed
    1. Basheer F., Giotopoulos G., Meduri E., Yun H., Mazan M., Sasca D., et al. (2019). Contrasting requirements during disease evolution identify EZH2 as a therapeutic target in AML. J. Exp. Med. 216 (4), 966–981. 10.1084/jem.20181276 - DOI - PMC - PubMed
    1. Beyer M., Mallmann M. R., Xue J., Staratschek-Jox A., Vorholt D., Krebs W., et al. (2012). High-resolution transcriptome of human macrophages. PLoS One 7 (9), e45466. 10.1371/journal.pone.0045466 - DOI - PMC - PubMed
    1. Birnie G. D. (1988). The HL60 cell line: A model system for studying human myeloid cell differentiation. Br. J. Cancer Suppl. 9, 41–45. - PMC - PubMed
    1. Blobel G. A. (2000). CREB-Binding protein and p300: Molecular integrators of hematopoietic transcription. Blood 95 (3), 745–755. 10.1182/blood.v95.3.745.003k05_745_755 - DOI - PubMed