Tumor dormancy is closely related to prognosis prediction and tumor immunity in neuroblastoma
- PMID: 37035400
- PMCID: PMC10080482
- DOI: 10.21037/tp-23-119
Tumor dormancy is closely related to prognosis prediction and tumor immunity in neuroblastoma
Abstract
Background: Neuroblastoma (NB), which is the most frequent and fatal solid tumor in early childhood, lacks an accurate approach to prevent or forecast its recurrence. Dormant NB cells are responsible for metastasis, drug resistance, and suppressive activity in the immune system. However, there is a lack of systematic research on the interaction between dormancy and NB prognosis and its potential associations with tumor immunity.
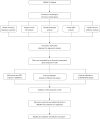
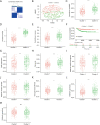
Methods: We downloaded NB gene expression data and clinical information from the Gene Expression Omnibus and ArrayExpres databases. Based on consensus clustering of the expression of dormancy-associated genes, the NB samples were classified into different groups, and differentially expressed genes (DEGs) were explored in each group. Functional analyses of DEGs were performed, followed by the establishment of a predictive dormancy signature and the assessment of tumor immunity. Finally, sex, age, International Neuroblastoma Staging System (INSS) stage, and MYCN status were identified as independent overall survival-related variables, which were incorporated into the nomogram.
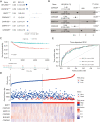
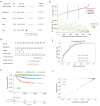
Results: A dormancy-associated gene signature, including CDKN2A, BHLHB3, CDKN2B, MAPK14, CDKN1B, and BMP7, was established. The gene signature showed a strong correlation with NB immune infiltration and capacity to predict NB patient prognosis. A nomogram including MYCN status, INSS stage, age and gene signature risk score was established which further divided NB into high, medium and low-risk groups. This nomogram had certain guiding significance in decision-making for clinical treatment.
Conclusions: Our results suggested that the 6-gene genetic signature for NB based on dormancy could predict NB survival and response to immunotherapy.
Keywords: Dormancy; gene signature; neuroblastoma (NB); prognosis; tumor immunity.
2023 Translational Pediatrics. All rights reserved.
Conflict of interest statement
Conflicts of Interest: All authors have completed the ICMJE uniform disclosure form (available at https://tp.amegroups.com/article/view/10.21037/tp-23-119/coif). The authors have no conflicts of interest to declare.
Figures


Similar articles
-
Development and validation of a novel stemness-related prognostic model for neuroblastoma using integrated machine learning and bioinformatics analyses.Transl Pediatr. 2024 Jan 29;13(1):91-109. doi: 10.21037/tp-23-582. Epub 2024 Jan 12. Transl Pediatr. 2024. PMID: 38323183 Free PMC article.
-
Identification of a Five-Gene Signature Derived From MYCN Amplification and Establishment of a Nomogram for Predicting the Prognosis of Neuroblastoma.Front Mol Biosci. 2021 Dec 7;8:769661. doi: 10.3389/fmolb.2021.769661. eCollection 2021. Front Mol Biosci. 2021. PMID: 34950701 Free PMC article.
-
Integration of clinical characteristics and molecular signatures of the tumor microenvironment to predict the prognosis of neuroblastoma.J Mol Med (Berl). 2023 Nov;101(11):1421-1436. doi: 10.1007/s00109-023-02372-x. Epub 2023 Sep 15. J Mol Med (Berl). 2023. PMID: 37712965
-
A signature of 29 immune-related genes pairs to predict prognosis in patients with neuroblastoma.Int Immunopharmacol. 2020 Nov;88:106994. doi: 10.1016/j.intimp.2020.106994. Epub 2020 Sep 21. Int Immunopharmacol. 2020. PMID: 33182060
-
Identification of prognostic long noncoding RNAs associated with spontaneous regression of neuroblastoma.Cancer Med. 2020 Jun;9(11):3800-3815. doi: 10.1002/cam4.3022. Epub 2020 Mar 26. Cancer Med. 2020. PMID: 32216054 Free PMC article.
Cited by
-
Segmental chromosome aberrations as a prognostic factor of neuroblastoma: a meta-analysis and systematic review.Transl Pediatr. 2024 Oct 1;13(10):1789-1798. doi: 10.21037/tp-24-200. Epub 2024 Oct 28. Transl Pediatr. 2024. PMID: 39524401 Free PMC article.
-
Development and validation of a novel stemness-related prognostic model for neuroblastoma using integrated machine learning and bioinformatics analyses.Transl Pediatr. 2024 Jan 29;13(1):91-109. doi: 10.21037/tp-23-582. Epub 2024 Jan 12. Transl Pediatr. 2024. PMID: 38323183 Free PMC article.
-
Prognostic implications of store-operated calcium entry signatures and immune dynamics in neuroblastoma via machine learning.Transl Cancer Res. 2025 Jul 30;14(7):4179-4193. doi: 10.21037/tcr-2024-2563. Epub 2025 Jul 23. Transl Cancer Res. 2025. PMID: 40792155 Free PMC article.
References
LinkOut - more resources
Full Text Sources
Miscellaneous
