

Identification of potential diagnostic and prognostic biomarkers for sepsis based on machine learning
- PMID: 37035547
- PMCID: PMC10073883
- DOI: 10.1016/j.csbj.2023.03.034
Identification of potential diagnostic and prognostic biomarkers for sepsis based on machine learning
Abstract
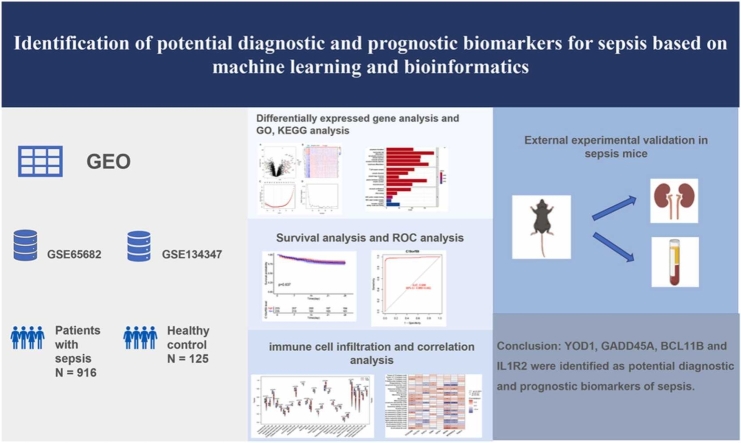
Background: To identify potential diagnostic and prognostic biomarkers of the early stage of sepsis.
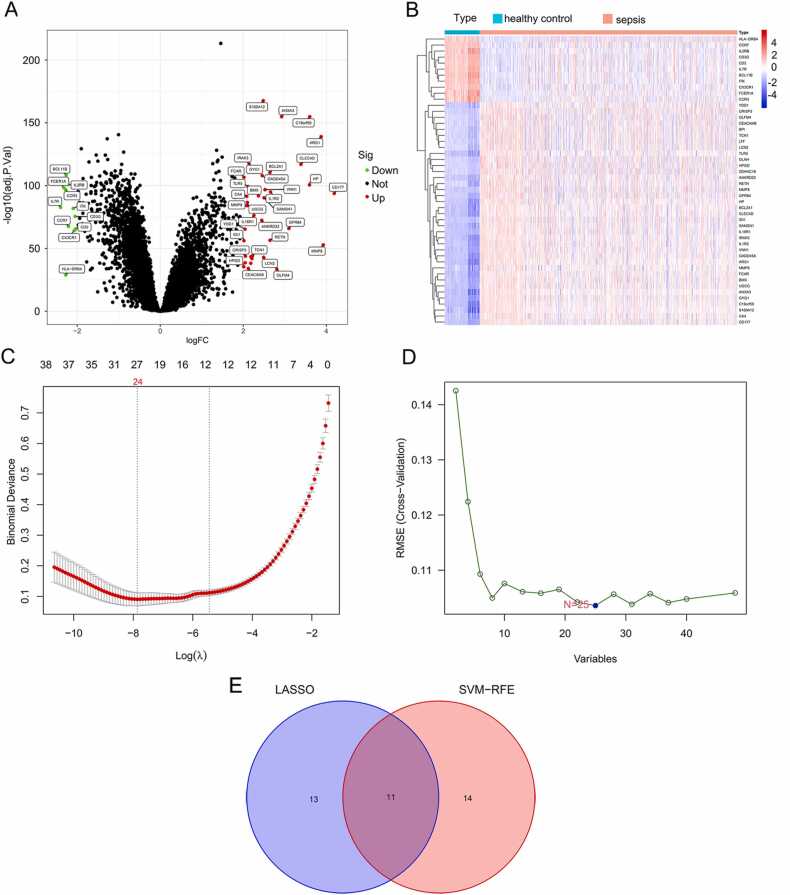
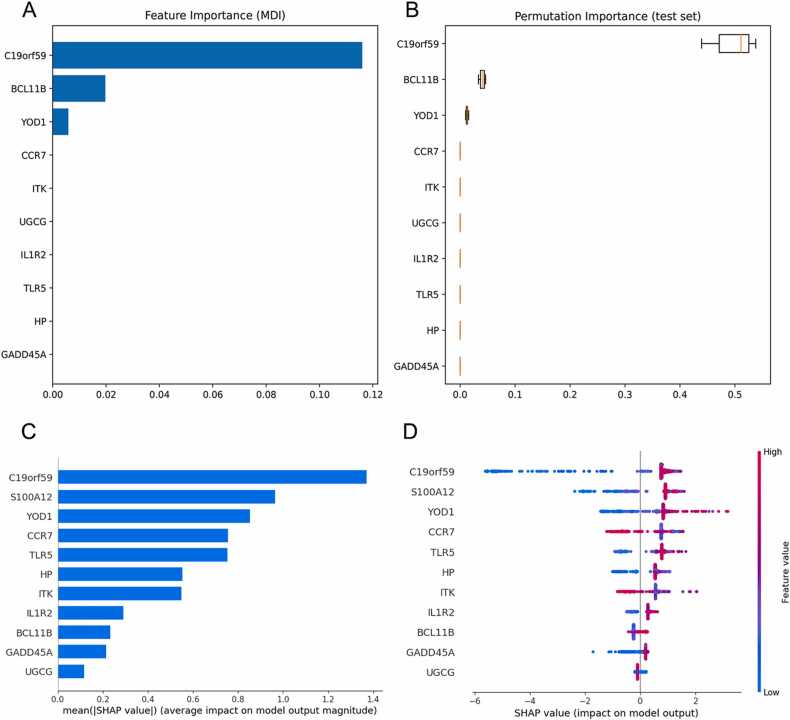
Methods: The differentially expressed genes (DEGs) between sepsis and control transcriptomes were screened from GSE65682 and GSE134347 datasets. The candidate biomarkers were identified by the least absolute shrinkage and selection operator (LASSO) regression and support vector machine recursive feature elimination (SVM-RFE) analyses. The diagnostic and prognostic abilities of the markers were evaluated by plotting receiver operating characteristic (ROC) curves and Kaplan-Meier survival curves. Gene Set Enrichment Analysis (GSEA) and single-sample GSEA (ssGSEA) were performed to further elucidate the molecular mechanisms and immune-related processes. Finally, the potential biomarkers were validated in a septic mouse model by qRT-PCR and western blotting.
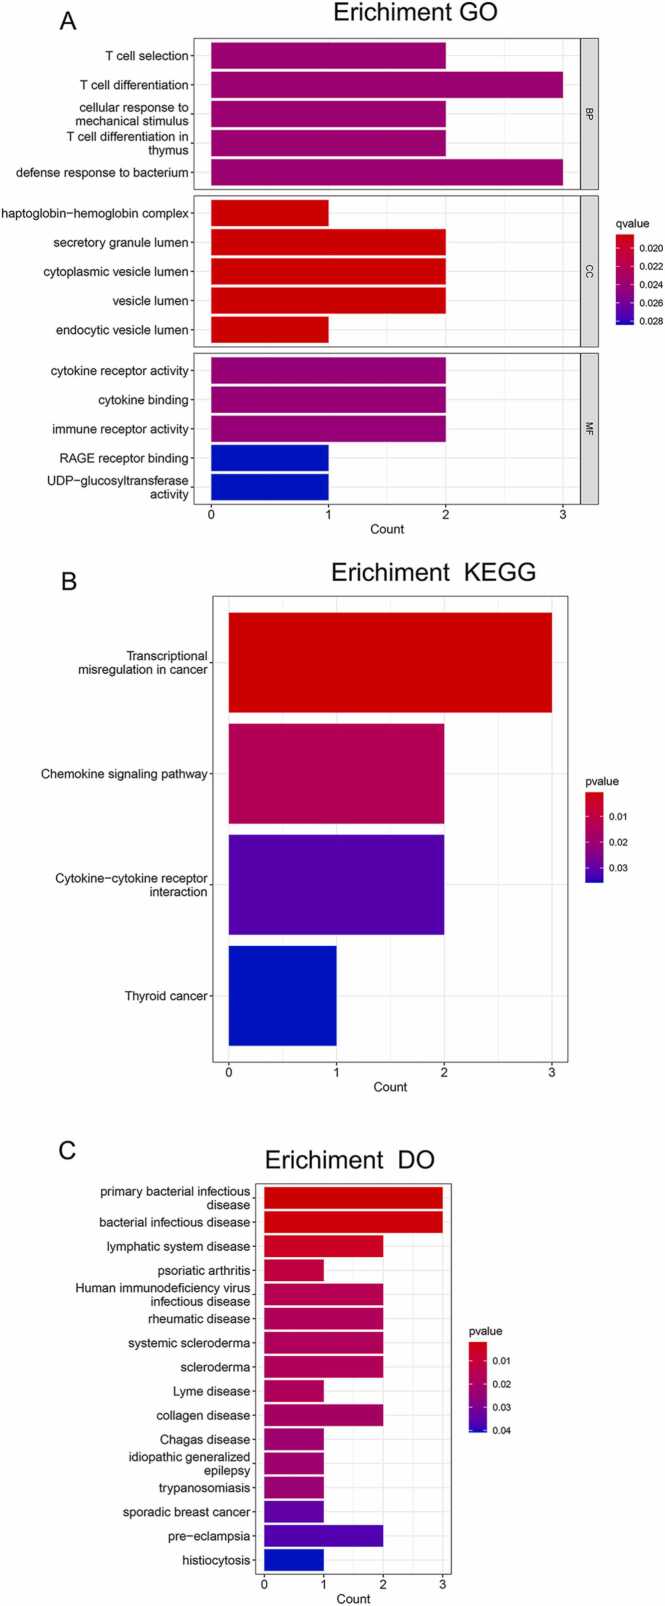
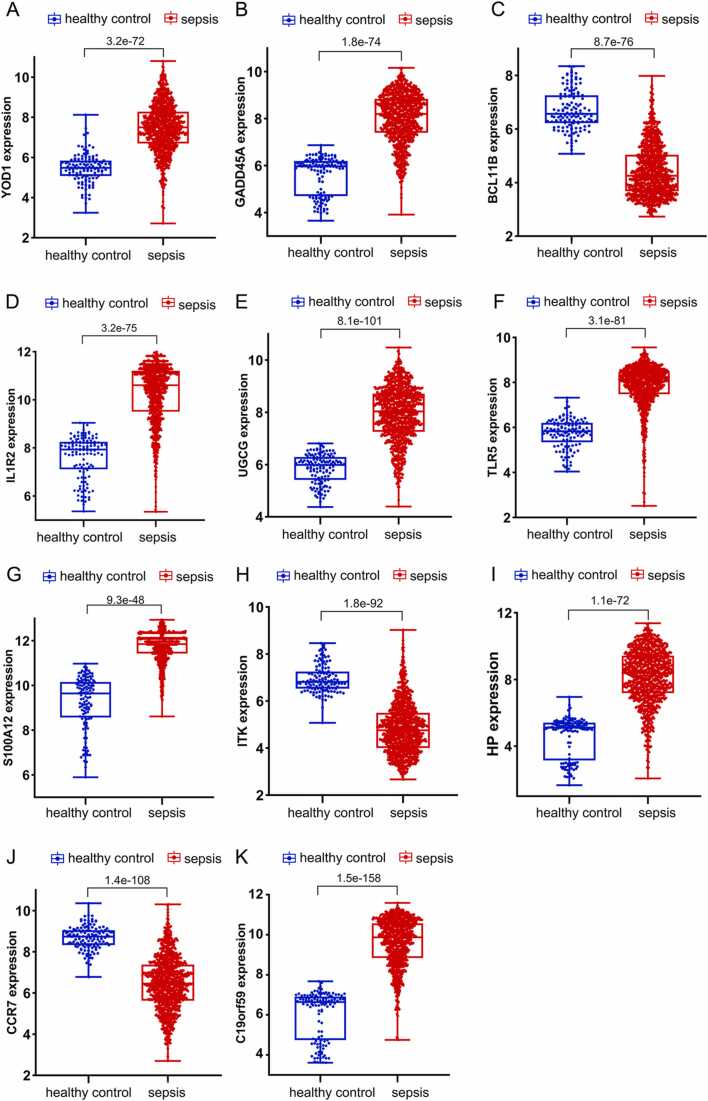
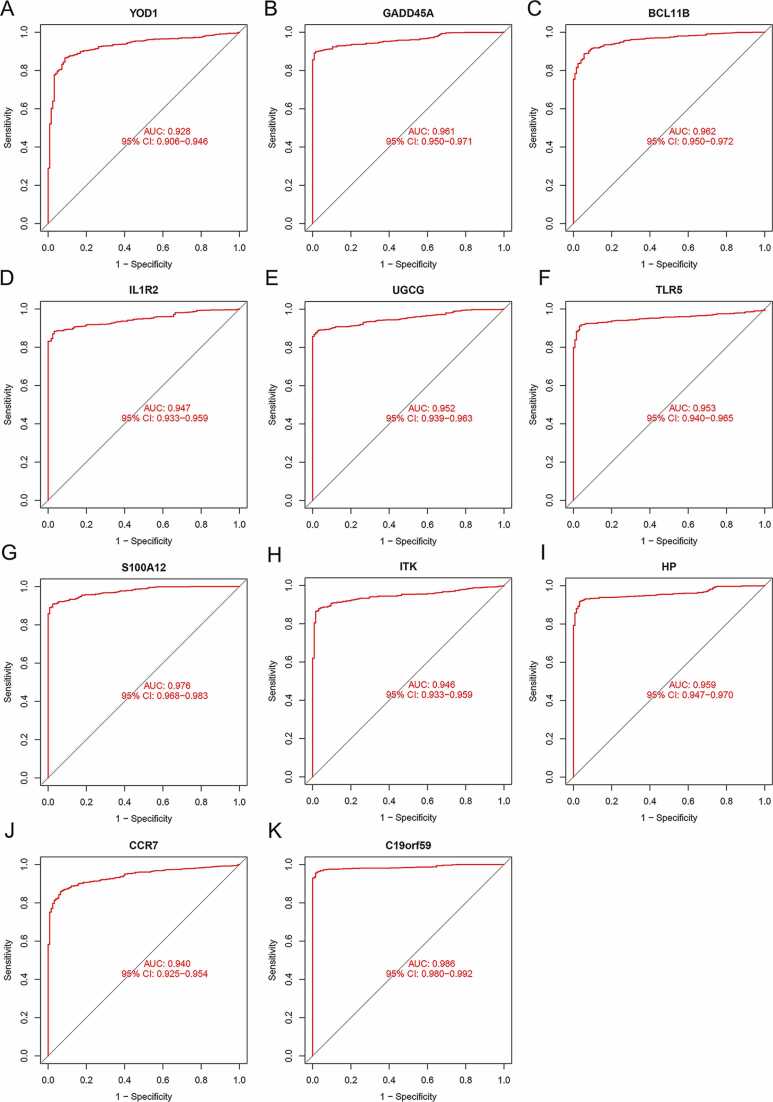
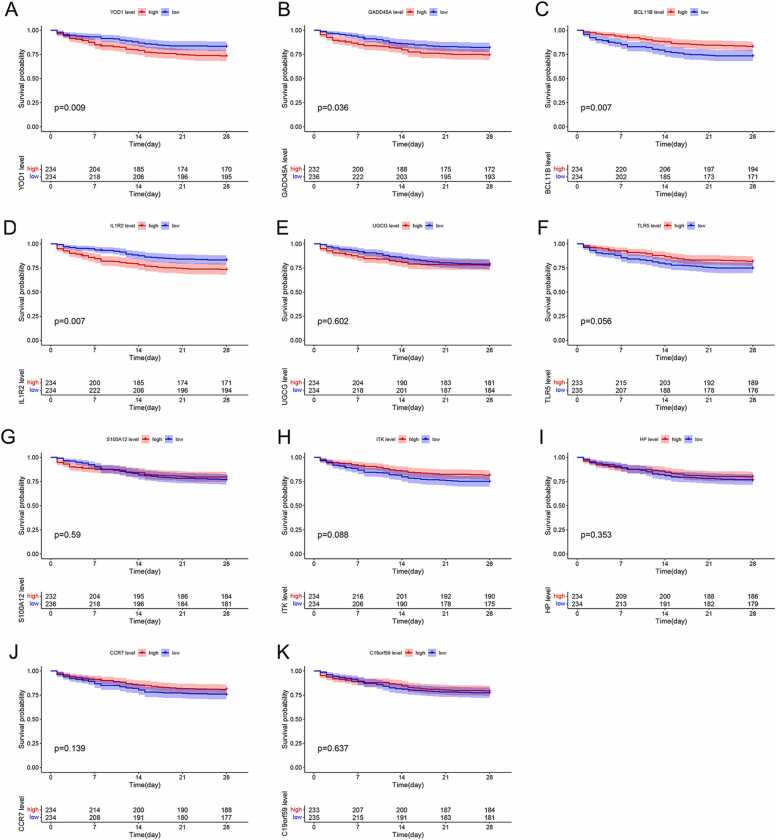
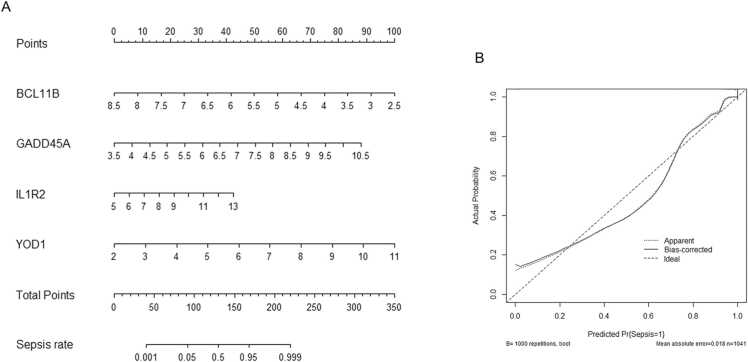
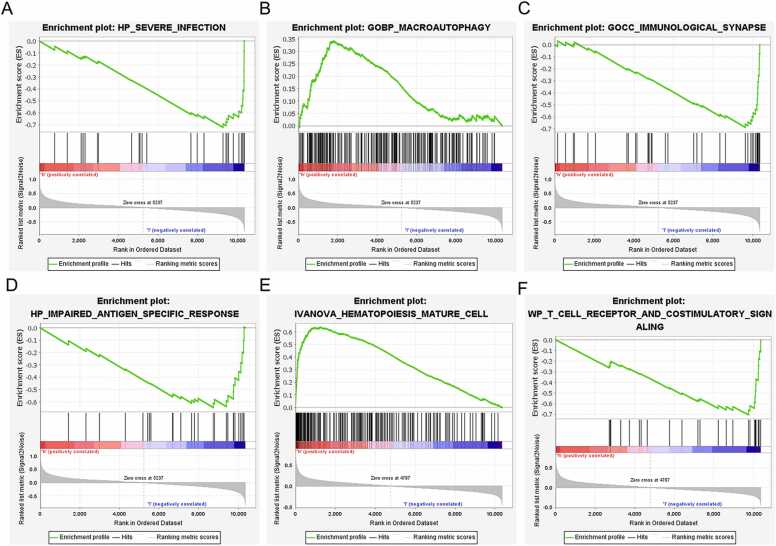
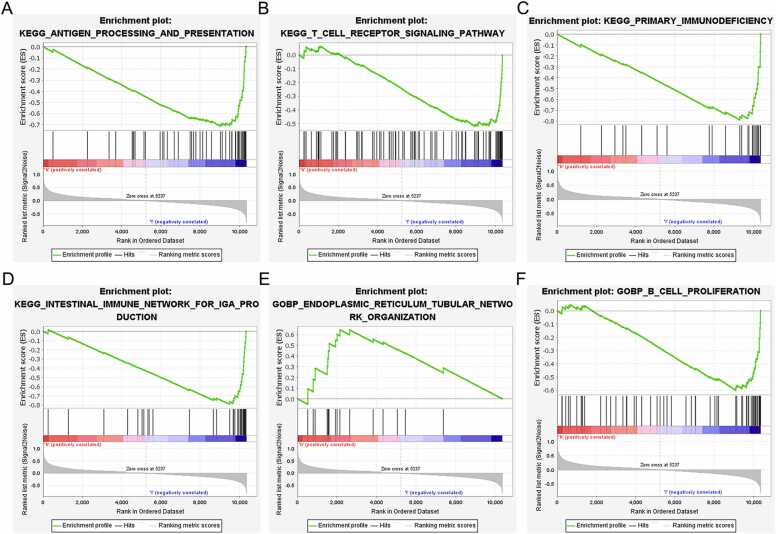
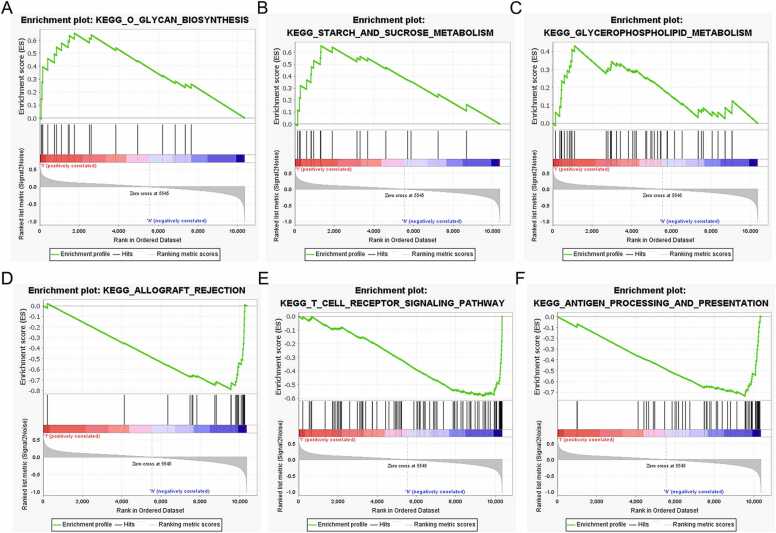
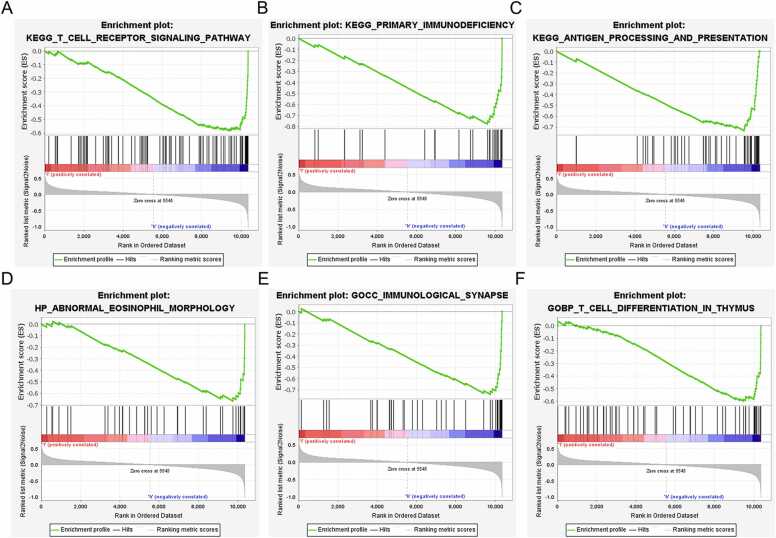
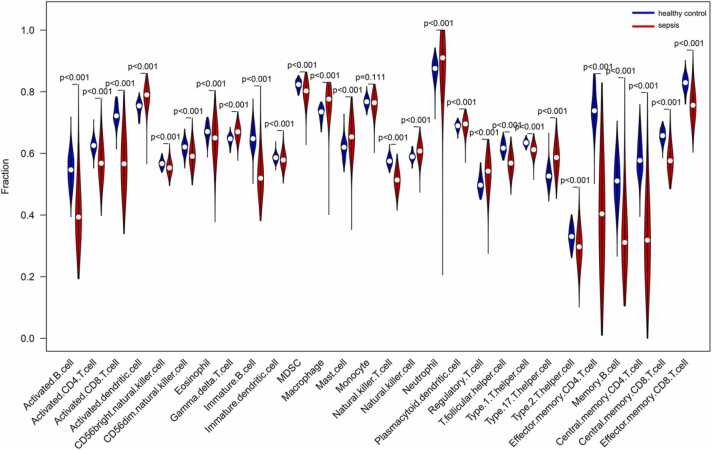
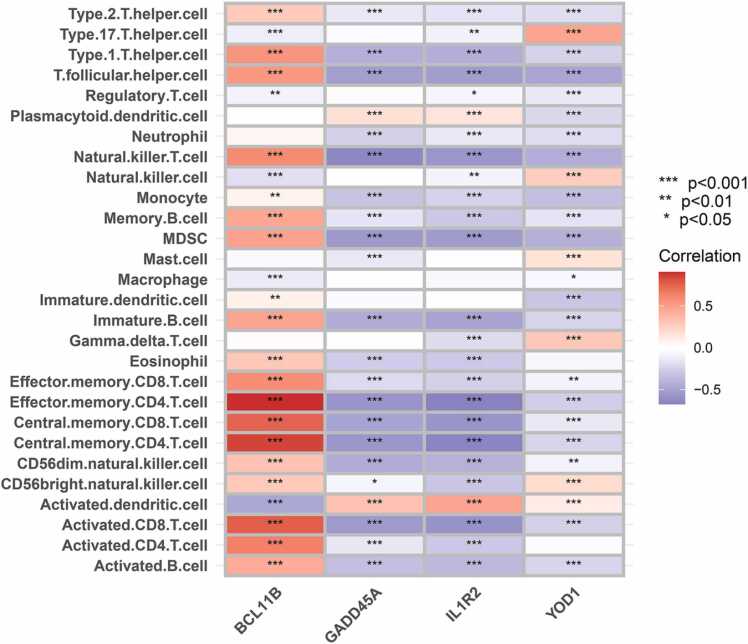
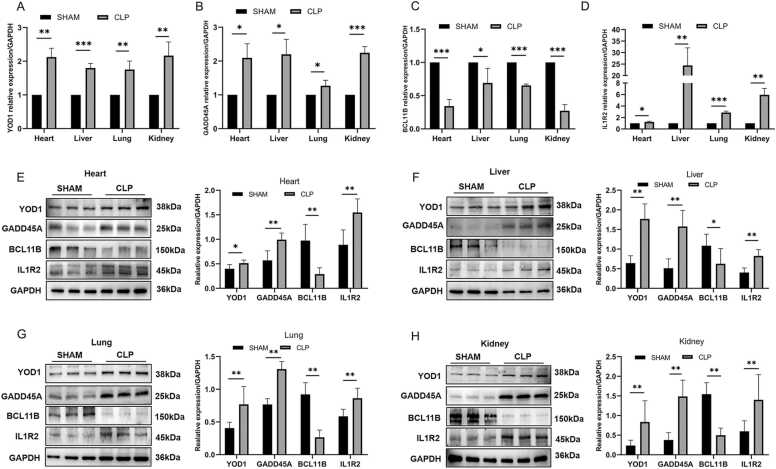
Results: Eleven DEGs were identified between the sepsis and control samples, including YOD1, GADD45A, BCL11B, IL1R2, UGCG, TLR5, S100A12, ITK, HP, CCR7 and C19orf59 (all AUC>0.9). Furthermore, the survival analysis identified YOD1, GADD45A, BCL11B and IL1R2 as the prognostic biomarkers of sepsis. According to GSEA, four DEGs were significantly associated with immune-related processes. In addition, ssGSEA demonstrated a significant difference in the enriched immune cell populations between the sepsis and control groups (all P < 0.05). Moreover, YOD1, GADD45A and IL1R2 were upregulated, and BCL11B was downregulated in the heart, liver, lungs, and kidneys of the septic mice model.
Conclusions: We identified four potential immune-releated diagnostic and prognostic gene markers for sepsis that offer new insights into its underlying mechanisms.
Keywords: Biomarker; Diagnosis; Machine learning; Prognosis; Sepsis.
© 2023 The Authors.
Conflict of interest statement
The authors declare that they have no conflicts of interest with the contents of this article.
Figures
Similar articles
-
Identification and validation of a novel mitochondrion-related gene signature for diagnosis and immune infiltration in sepsis.Front Immunol. 2023 Jun 15;14:1196306. doi: 10.3389/fimmu.2023.1196306. eCollection 2023. Front Immunol. 2023. PMID: 37398680 Free PMC article.
-
Identification and validation of novel biomarkers associated with immune infiltration for the diagnosis of osteosarcoma based on machine learning.Front Genet. 2023 Sep 4;14:1136783. doi: 10.3389/fgene.2023.1136783. eCollection 2023. Front Genet. 2023. PMID: 37732314 Free PMC article.
-
Identification of ferroptosis-related genes in male mice with sepsis-induced acute lung injury based on transcriptome sequencing.BMC Pulm Med. 2023 Apr 20;23(1):133. doi: 10.1186/s12890-023-02361-3. BMC Pulm Med. 2023. PMID: 37081490 Free PMC article.
-
Integrated multiple microarray studies by robust rank aggregation to identify immune-associated biomarkers in Crohn's disease based on three machine learning methods.Sci Rep. 2023 Feb 15;13(1):2694. doi: 10.1038/s41598-022-26345-1. Sci Rep. 2023. PMID: 36792688 Free PMC article.
-
Identification of immune-related genes in diagnosing retinopathy of prematurity with sepsis through bioinformatics analysis and machine learning.Front Genet. 2023 Nov 10;14:1264873. doi: 10.3389/fgene.2023.1264873. eCollection 2023. Front Genet. 2023. PMID: 38028617 Free PMC article.
Cited by
-
Machine learning-based transcriptmics analysis reveals BMX, GRB10, and GADD45A as crucial biomarkers and therapeutic targets in sepsis.Front Pharmacol. 2025 Mar 31;16:1576467. doi: 10.3389/fphar.2025.1576467. eCollection 2025. Front Pharmacol. 2025. PMID: 40230692 Free PMC article.
-
Identification of DNA damage repair-related genes in sepsis using bioinformatics and machine learning: An observational study.Medicine (Baltimore). 2025 Jan 31;104(5):e41354. doi: 10.1097/MD.0000000000041354. Medicine (Baltimore). 2025. PMID: 39889168 Free PMC article.
-
Role of Endoplasmic Reticulum Stress-Associated Genes in Septic Neonatal Foals.Antioxidants (Basel). 2025 Aug 21;14(8):1024. doi: 10.3390/antiox14081024. Antioxidants (Basel). 2025. PMID: 40867920 Free PMC article.
-
MTHFD2 stabilizes LOX expression through RNA methylation modification to promote sepsis-induced acute kidney injury progression.Hum Cell. 2025 Feb 26;38(2):62. doi: 10.1007/s13577-025-01189-9. Hum Cell. 2025. PMID: 40009304
-
Clinical manifestations of anxiety and depression in sepsis-associated encephalopathy and multi-omics identification of cluster of differentiation 38 as an early biomarker.World J Psychiatry. 2025 Jun 19;15(6):105889. doi: 10.5498/wjp.v15.i6.105889. eCollection 2025 Jun 19. World J Psychiatry. 2025. PMID: 40574780 Free PMC article.
References
LinkOut - more resources
Full Text Sources
Research Materials
Miscellaneous