. 2023 Mar 15:21:2228-2240.
doi: 10.1016/j.csbj.2023.03.019. eCollection 2023.

Identification of feature genes and key biological pathways in immune-mediated necrotizing myopathy: High-throughput sequencing and bioinformatics analysis

Affiliations

Identification of feature genes and key biological pathways in immune-mediated necrotizing myopathy: High-throughput sequencing and bioinformatics analysis

Kai Chen et al. Comput Struct Biotechnol J. .

Abstract

Background: Immune-mediated necrotizing myopathy (IMNM), a subgroup of idiopathic inflammatory myopathies (IIMs), is characterized by severe proximal muscle weakness and prominent necrotic fibers but no infiltration of inflammatory cells. IMNM pathogenesis is unclear. This study investigated key biomarkers and potential pathways for IMNM using high-throughput sequencing and bioinformatics technology.

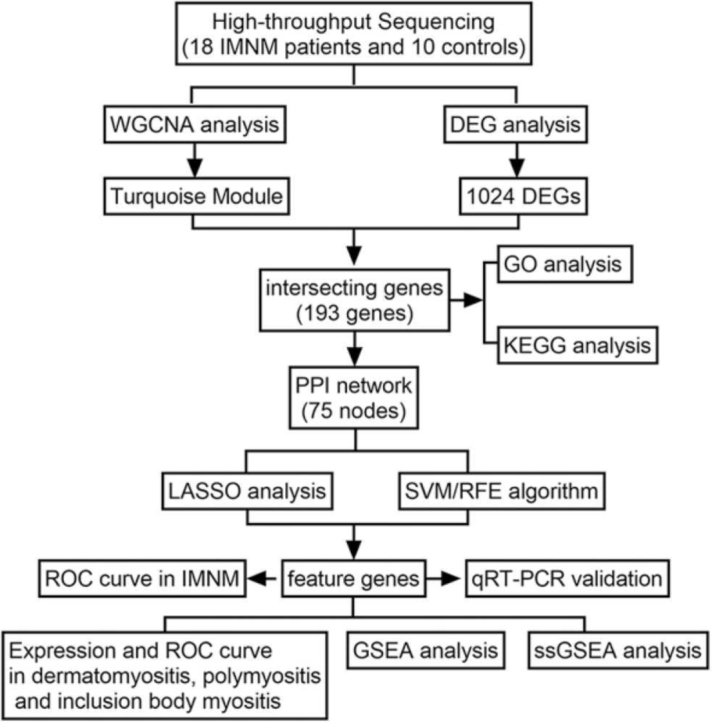
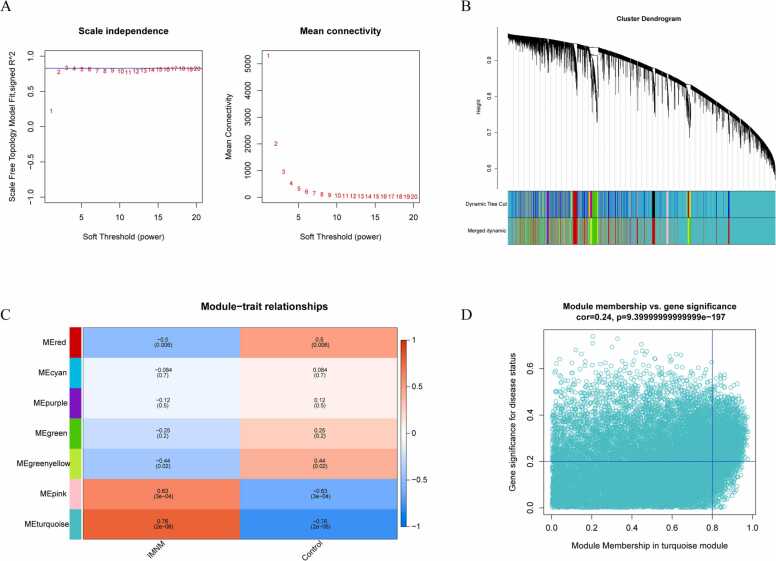
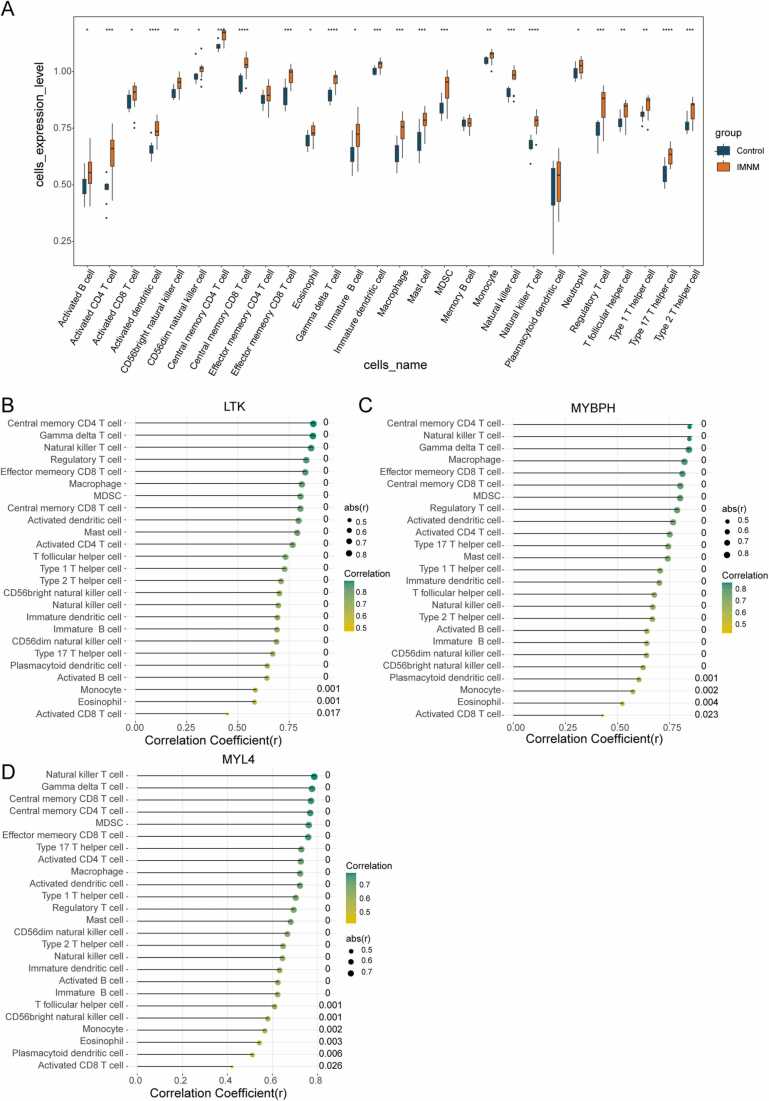
Methods: RNA sequencing was conducted in 18 IMNM patients and 10 controls. A combination of weighted gene coexpression network analysis (WGCNA) and differentially expressed gene (DEG) analysis was conducted to identify IMNM-related DEGs. Feature genes were screened out by employing the protein-protein interaction (PPI) network, support vector machine-recursive feature elimination (SVM-RFE), and least absolute shrinkage selection operator (LASSO). Quantitative real-time polymerase chain reaction (qRT-PCR) was performed to verify their differential expression, and the receiver operating characteristic curve (ROC) was used to evaluate their diagnostic efficiency. Functional enrichment analysis was applied to reveal the hidden functions of feature genes. Furthermore, 28 immune cell abundance patterns in IMNM samples were measured.

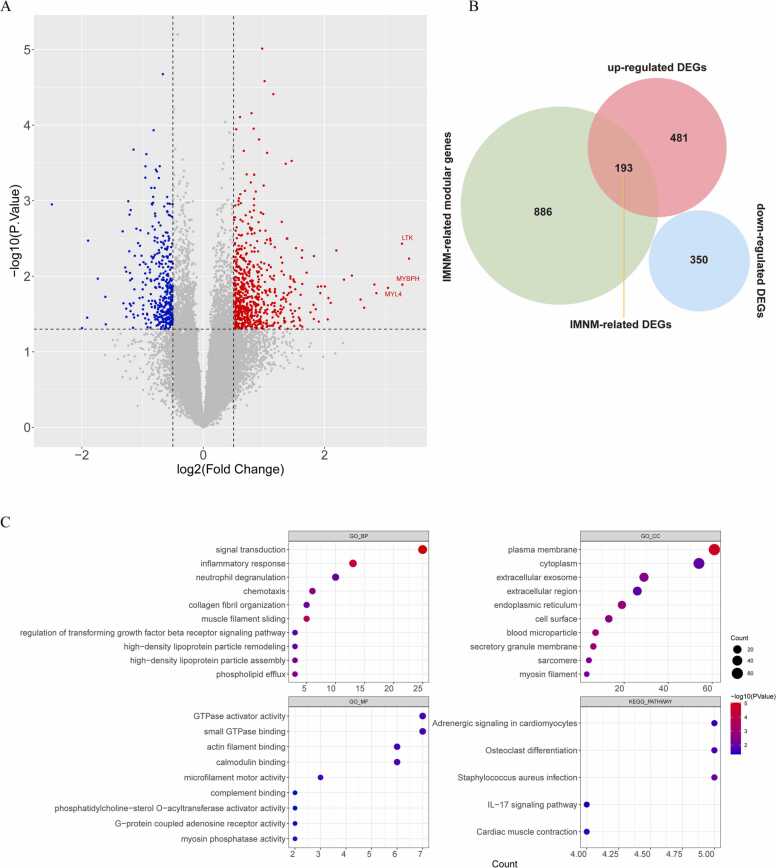
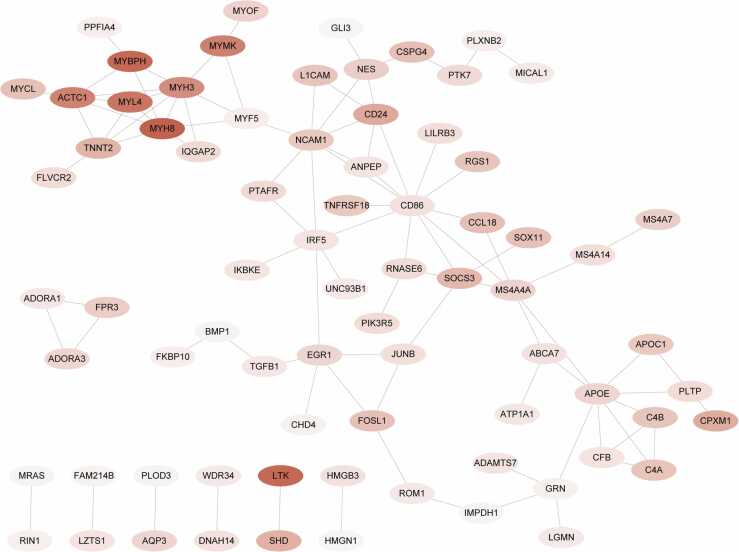
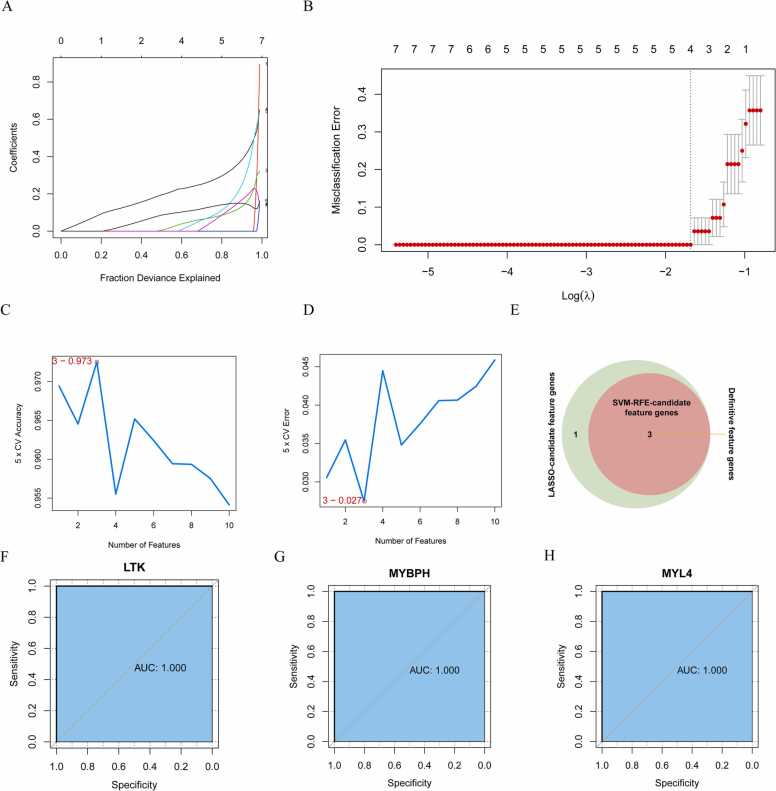
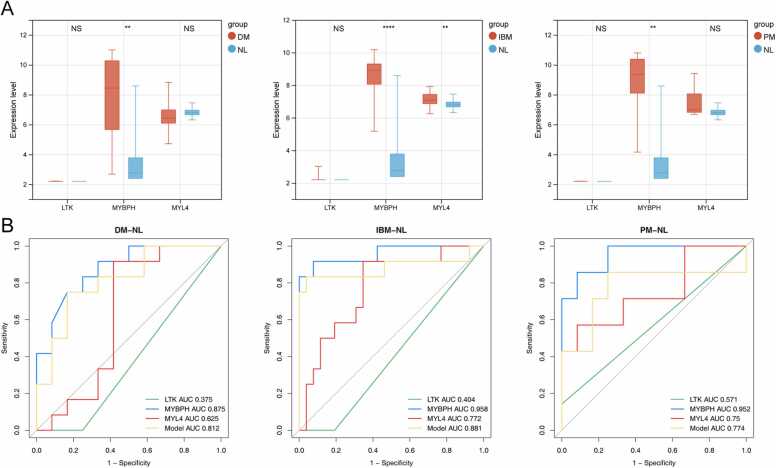
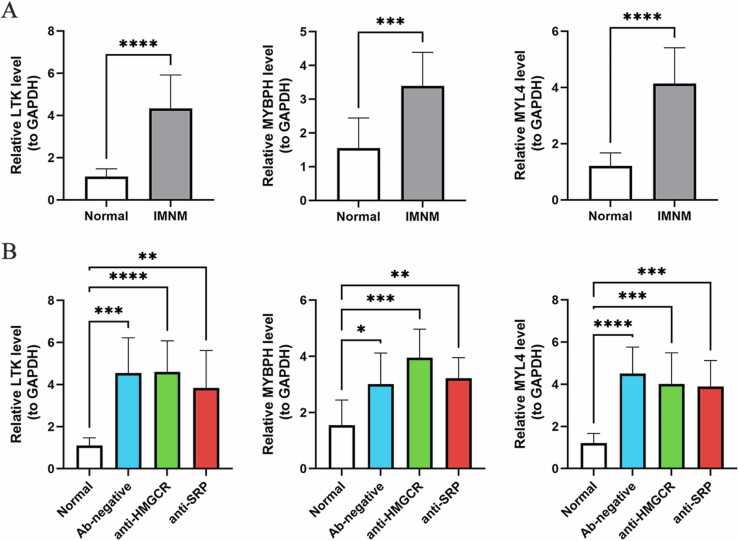
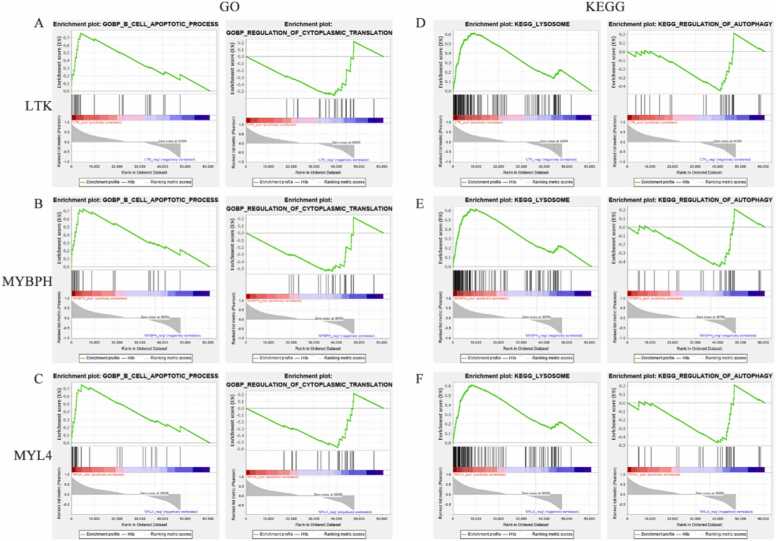
Results: We identified 193 IMNM-related DEGs that were aberrantly upregulated in the IMNM population and were closely associated with immune-inflammatory responses, regulation of skeletal and cardiac muscle contraction, and lipoprotein metabolism. With the help of the PPI network and the LASSO and SVM-RFE algorithms, three feature genes, LTK, MYBPH, and MYL4, were identified and further confirmed by qRT-PCR. ROC curves among IMNM, dermatomyositis (DM), inclusion body myositis (IBM), and polymyositis (PM) samples validated the LTK and MYL4 genes as IMNM-specific feature markers. In addition, all three genes had a notable association with the autophagy-lysosome pathway and immune-inflammatory responses. Ultimately, IMNM displayed a marked immune-cell infiltrative microenvironment. The most significant correlation was found between CD4 T cells, CD8 T cells, macrophages, natural killer (NK) cells, and dendritic cells (DCs).

Conclusions: LTK, MYBPH, and MYL4 were identified as potential key molecules for IMNM and are believed to play a role in the autophagy-lysosome pathway and muscle inflammation.

Keywords: Autophay-lysosome pathway; Biomarkers; IMNM; Immune cell infiltration; RNA sequencing.


Conflict of interest statement

The authors declare the following financial interests/personal relationships which may be considered as potential competing interests: Li Zeng reports article publishing charges was provided by National Natural Science Foundation of China. Qiao Zhou reports writing assistance was provided by Sichuan Science and Technology Bureau. Li Zeng reports a relationship with Chengdu Digidite Group Company that includes: non-financial support.

Figures

ga1
Graphical abstract
Fig. 1
Fig. 1
The research flowchart depicting the process of identifying IMNM-related feature genes. A combination of WGCNA and DEG analysis was used to identify IMNM-related DEGs. Shared feature genes were then screened out using LASSO and SVM algorithms and validated in vivo.
Fig. 2
Fig. 2
Weighted coexpression network analysis. (A) Soft-thresholding power calculation. The red line shows a correlation coefficient of 0.85 and a soft-thresholding power of three. The horizontal axes represent the power values of the weight parameters. The vertical axis of the left panel represents Scale Free Topology Model Fit (left), namely, the signed R^2; the higher the square of the coefficients, the more closely the network approximates a scale-free distribution. The vertical axis of the right panel represents the mean of all gene adjacency functions in the corresponding gene module. (B) The cluster dendrogram of the genes based on module eigengenes. Each branch represents one gene, and each color at the bottom represents one coexpression module. (C) Clinical phenotype and module gene correlation analysis. The vertical axis represents the different modules, and the horizontal axis represents the clinical phenotypes. The turquoise module was significantly correlated with IMNM. (D) Scatter plot showing the correlation between turquoise module genes and clinical phenotypes. A total of 1079 genes were associated with IMNM.
Fig. 3
Fig. 3
IMNM-related DEG screening and functional enrichment analysis. (A) A volcano plot showing DEGs between IMNM muscles and healthy controls. The red spots indicate upregulated genes, whereas the blue spots indicate downregulated genes. (B) Venn diagram showing the intersecting genes between the turquoise module and DEGs, which are defined as crucial IMNM-related DEGs. (C) GO terms and KEGG functional enrichment analysis of crucial IMNM-related DEGs.
Fig. 4
Fig. 4
PPI network of 193 IMNM-related DEGs.
Fig. 5
Fig. 5
Screening of feature genes. (A-B) Four candidate feature genes screened by LASSO regression analysis in 10-fold cross validations. (C-D) Three candidate feature genes screened by the SVM-RFE algorithm with maximal accuracy = 0.973 and minimal error = 0.027. (E) Three feature genes obtained from the LASSO and SVM-RFE algorithms. (F–H) ROC curve analysis of LTK (F), MYBPH (G) and MYL4 (H) to evaluate their diagnostic efficiency in IMNM.
Fig. 6
Fig. 6
Evaluation of the expression and diagnostic value of feature genes in DM, IBM and PM. (A) The expression of three feature genes among DM, IBM and PM in the GSE128470 dataset. (B) ROC analysis of the three feature genes individually and the gene-based diagnostic model in DM, IBM, and PM. **p < 0.01; ****p < 0.0001; NS, nonsignificance. DM, dermatomyositis; IBM, inclusion body myositis; PM, polymyositis; NL, normal.
Fig. 7
Fig. 7
The expression of feature genes in IMNM and its subgroups. (A) The expression of LTK, MYBPH and MYL4 in IMNM patients (n = 18) compared to controls (n = 10) by qRT—PCR. (B) The expression of LTK, MYBPH and MYL4 in different subgroups of IMNM patients. *p < 0.05; **p < 0.01; ***p < 0.001; ****p < 0.0001.
Fig. 8
Fig. 8
Enrichment plots from GSEA. (A–C) GO-BP entries most positively and negatively linked to LTK (A), MYBPH (B) and MYL4 (C). (D–E) KEGG entries most positively and negatively linked to LTK (D), MYBPH (E) and MYL4 (F). The green line represents the running enrichment scores for the feature gene, the middle part shows where the feature gene appears in the ranked list, and the bottom part shows the ranking metric value as it moves down the list.
Fig. 9
Fig. 9
Immune landscape analysis associated with IMNM. (A) Twenty-eight types of immune cells compared between IMNM patients and healthy controls in the local cohort. (B-D) Pearson correlation analysis of the infiltration levels of immune cells and the three feature genes. LTK (B), MYBPH (C), and MYL4 (D). *p < 0.05; **p < 0.01; ***p < 0.001.

Similar articles

Cited by

References

    1. Hoogendijk J.E., Amato A.A., Lecky B.R., Choy E.H., Lundberg I.E., Rose M.R., et al. 119th Enmc international workshop: trial design in adult idiopathic inflammatory myopathies, with the exception of inclusion body myositis, 10–12 october 2003, Naarden, the Netherlands. Neuromuscul Disord. 2004;14(5):337–345. doi: 10.1016/j.nmd.2004.02.006. [Epub 2004/04/22] - DOI - PubMed
    1. Allenbach Y., Benveniste O., Stenzel W., Boyer O. Immune-mediated necrotizing myopathy: clinical features and pathogenesis. Nat Rev Rheumatol. 2020;16(12):689–701. doi: 10.1038/s41584-020-00515-9. [Epub 2020/10/24] - DOI - PubMed
    1. Klein M., Mann H., Plestilova L., Zamecnik J., Betteridge Z., McHugh N., et al. Increasing incidence of immune-mediated necrotizing myopathy: single-centre experience. Rheumatology. 2015;54(11):2010–2014. doi: 10.1093/rheumatology/kev229. [Epub 2015/06/26] - DOI - PubMed
    1. Kassardjian C.D., Lennon V.A., Alfugham N.B., Mahler M., Milone M. Clinical features and treatment outcomes of necrotizing autoimmune myopathy. JAMA Neurol. 2015;72(9):996–1003. doi: 10.1001/jamaneurol.2015.1207. [Epub 2015/07/21] - DOI - PubMed
    1. Lim J., Rietveld A., De Bleecker J.L., Badrising U.A., Saris C.G.J., van der Kooi A.J., et al. Seronegative patients form a distinctive subgroup of immune-mediated necrotizing myopathy. Neurol Neuroimmunol Neuroinflamm. 2019;6(1) doi: 10.1212/NXI.0000000000000513. [Epub 2018/10/23] - DOI - PMC - PubMed