Concurrent validity of machine learning-classified functional upper extremity use from accelerometry in chronic stroke
- PMID: 37035665
- PMCID: PMC10073694
- DOI: 10.3389/fphys.2023.1116878
Concurrent validity of machine learning-classified functional upper extremity use from accelerometry in chronic stroke
Abstract
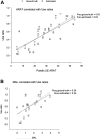
Objective: This study aims to investigate the validity of machine learning-derived amount of real-world functional upper extremity (UE) use in individuals with stroke. We hypothesized that machine learning classification of wrist-worn accelerometry will be as accurate as frame-by-frame video labeling (ground truth). A second objective was to validate the machine learning classification against measures of impairment, function, dexterity, and self-reported UE use. Design: Cross-sectional and convenience sampling. Setting: Outpatient rehabilitation. Participants: Individuals (>18 years) with neuroimaging-confirmed ischemic or hemorrhagic stroke >6-months prior (n = 31) with persistent impairment of the hemiparetic arm and upper extremity Fugl-Meyer (UEFM) score = 12-57. Methods: Participants wore an accelerometer on each arm and were video recorded while completing an "activity script" comprising activities and instrumental activities of daily living in a simulated apartment in outpatient rehabilitation. The video was annotated to determine the ground-truth amount of functional UE use. Main outcome measures: The amount of real-world UE use was estimated using a random forest classifier trained on the accelerometry data. UE motor function was measured with the Action Research Arm Test (ARAT), UEFM, and nine-hole peg test (9HPT). The amount of real-world UE use was measured using the Motor Activity Log (MAL). Results: The machine learning estimated use ratio was significantly correlated with the use ratio derived from video annotation, ARAT, UEFM, 9HPT, and to a lesser extent, MAL. Bland-Altman plots showed excellent agreement between use ratios calculated from video-annotated and machine-learning classification. Factor analysis showed that machine learning use ratios capture the same construct as ARAT, UEFM, 9HPT, and MAL and explain 83% of the variance in UE motor performance. Conclusion: Our machine learning approach provides a valid measure of functional UE use. The accuracy, validity, and small footprint of this machine learning approach makes it feasible for measurement of UE recovery in stroke rehabilitation trials.
Keywords: ADLs; accelerometry; disability evaluation; machine learning; paresis/rehabilitation; psychometrics; sensors; stroke rehabilitation.
Copyright © 2023 Geed, Grainger, Mitchell, Anderson, Schmaulfuss, Culp, McCormick, McGarry, Delgado, Noccioli, Shelepov, Dromerick and Lum.
Conflict of interest statement
The authors declare that the research was conducted in the absence of any commercial or financial relationships that could be construed as a potential conflict of interest.
Figures


References
Grants and funding
LinkOut - more resources
Full Text Sources
Research Materials

