Basal and inducible Osterix expression reflect equine mesenchymal progenitor cell osteogenic capacity
- PMID: 37035801
- PMCID: PMC10076790
- DOI: 10.3389/fvets.2023.1125893
Basal and inducible Osterix expression reflect equine mesenchymal progenitor cell osteogenic capacity
Abstract
Introduction: Mesenchymal stem cells are characterized by their capacities for extensive proliferation through multiple passages and, classically, tri-lineage differentiation along osteogenic, chondrogenic and adipogenic lineages. This study was carried out to compare osteogenesis in equine bone marrow-, synovium- and adipose-derived cells, and to determine whether osteogenic capacity is reflected in the basal expression of the critical osteogenic transcription factors Runx2 and Osterix.
Methods: Bone marrow, synovium and adipose tissue was collected from six healthy 2-year-old horses. Cells were isolated from these sources and expanded through two passages. Basal expression of Runx2 and Osterix was assessed in undifferentiated third passage cells, along with their response to osteogenic culture conditions.
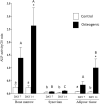
Results: Bone marrow-derived cells had significantly higher basal expression of Osterix, but not Runx2. In osteogenic medium, bone-marrow cells rapidly developed dense, multicellular aggregates that stained strongly for mineral and alkaline phosphatase activity. Synovial and adipose cell cultures showed far less matrix mineralization. Bone marrow cells significantly up-regulated alkaline phosphatase mRNA expression and enzymatic activity at 7 and 14 days. Alkaline phosphatase expression and activity were increased in adipose cultures after 14 days, although these values were less than in bone marrow cultures. There was no change in alkaline phosphatase in synovial cultures. In osteogenic medium, bone marrow cultures increased both Runx2 and Osterix mRNA expression significantly at 7 and 14 days. Expression of both transcription factors did not change in synovial or adipose cultures.
Discussion: These results demonstrate that basal Osterix expression differs significantly in progenitor cells derived from different tissue sources and reflects the osteogenic potential of the cell populations.
Keywords: Osterix; Runx2; bone formation; mesenchymal stem cells; osteogenesis.
Copyright © 2023 Andrietti, Durgam, Naumann and Stewart.
Conflict of interest statement
The authors declare that the research was conducted in the absence of any commercial or financial relationships that could be construed as a potential conflict of interest.
Figures


Similar articles
-
MicroRNA expression profiling of human bone marrow mesenchymal stem cells during osteogenic differentiation reveals Osterix regulation by miR-31.Gene. 2013 Sep 15;527(1):321-31. doi: 10.1016/j.gene.2013.06.021. Epub 2013 Jul 1. Gene. 2013. PMID: 23827457
-
Gene expression of runx2, Osterix, c-fos, DLX-3, DLX-5, and MSX-2 in dental follicle cells during osteogenic differentiation in vitro.Calcif Tissue Int. 2006 Feb;78(2):98-102. doi: 10.1007/s00223-005-0146-0. Epub 2006 Feb 6. Calcif Tissue Int. 2006. PMID: 16467978
-
Impact of zinc fingers and homeoboxes 3 on the regulation of mesenchymal stem cell osteogenic differentiation.Stem Cells Dev. 2011 Sep;20(9):1539-47. doi: 10.1089/scd.2010.0279. Epub 2011 Feb 24. Stem Cells Dev. 2011. PMID: 21174497
-
Inhibitory effect of alcohol on osteogenic differentiation in human bone marrow-derived mesenchymal stem cells.Alcohol Clin Exp Res. 2004 Mar;28(3):468-79. doi: 10.1097/01.alc.0000118315.58404.c1. Alcohol Clin Exp Res. 2004. PMID: 15084905
-
Donor age effects on in vitro chondrogenic and osteogenic differentiation performance of equine bone marrow- and adipose tissue-derived mesenchymal stromal cells.BMC Vet Res. 2022 Nov 3;18(1):388. doi: 10.1186/s12917-022-03475-2. BMC Vet Res. 2022. PMID: 36329434 Free PMC article.
Cited by
-
SS-31 Targets NOS2 to Enhance Osteogenic Differentiation in Aged BMSCs by Restoring Mitochondrial Function.Organogenesis. 2025 Dec;21(1):2519649. doi: 10.1080/15476278.2025.2519649. Epub 2025 Jun 26. Organogenesis. 2025. PMID: 40570323 Free PMC article.
References
LinkOut - more resources
Full Text Sources

