. 2023 Aug;90(2):444-457.
doi: 10.1002/mrm.29652. Epub 2023 Apr 10.

Fat mitigation strategies to improve image quality of radial 4D flow MRI in obese subjects

Affiliations

Fat mitigation strategies to improve image quality of radial 4D flow MRI in obese subjects

A M K Muntasir Shamim et al. Magn Reson Med. 2023 Aug.

Abstract

Purpose: This study addresses the challenges in obtaining abdominal 4D flow MRI of obese patients. We aimed to evaluate spectral saturation and inner volume excitation as methods to mitigating artifacts originating from adipose signals, with the goal of enhancing image quality and improving quantification.

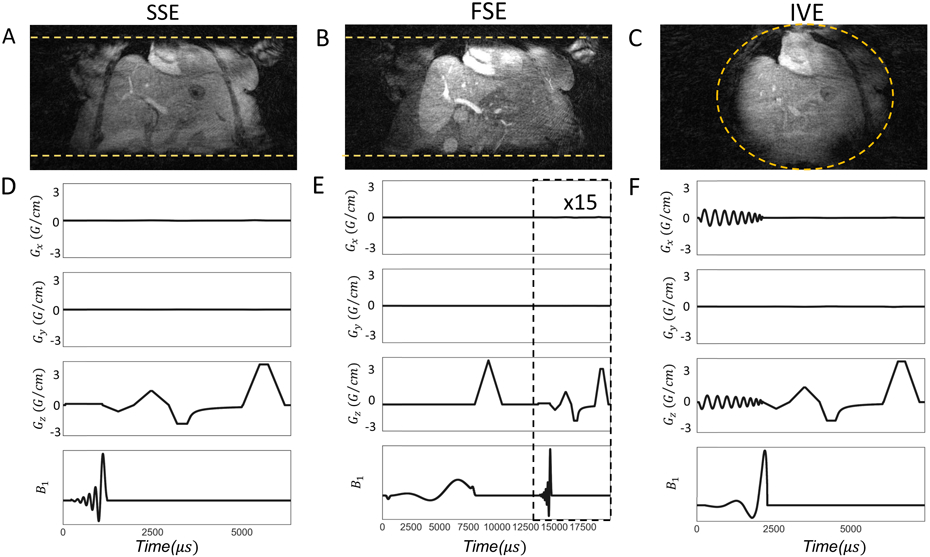
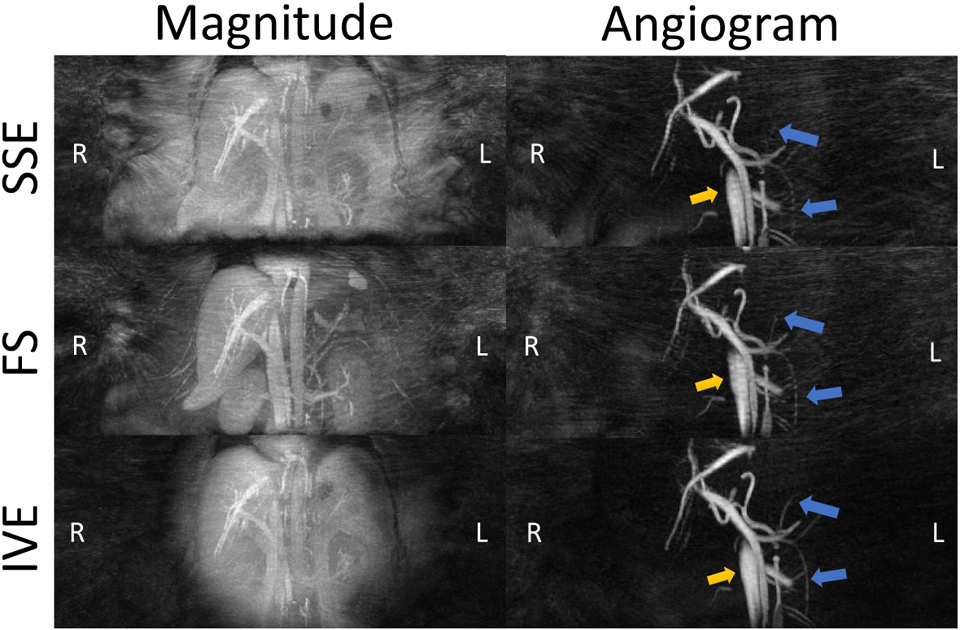
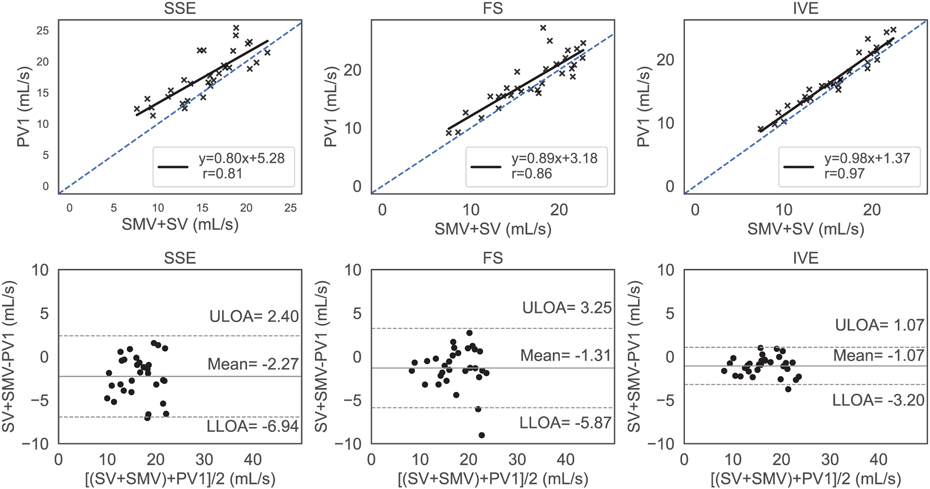
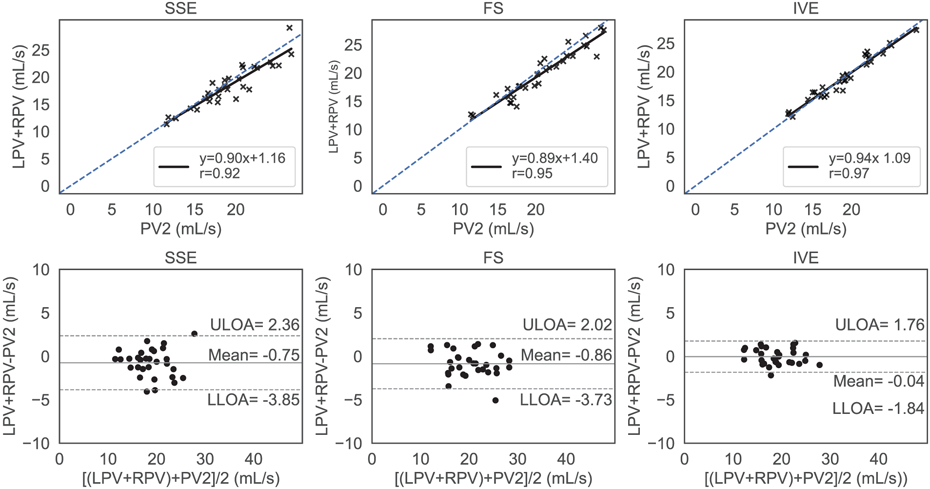
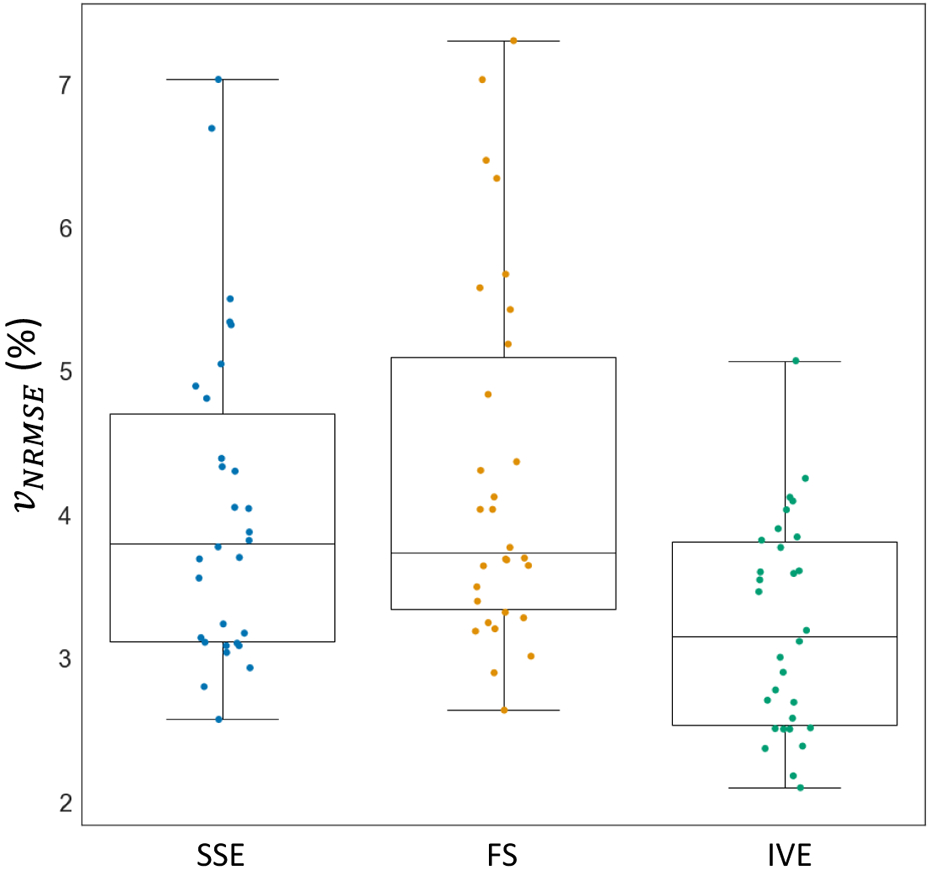
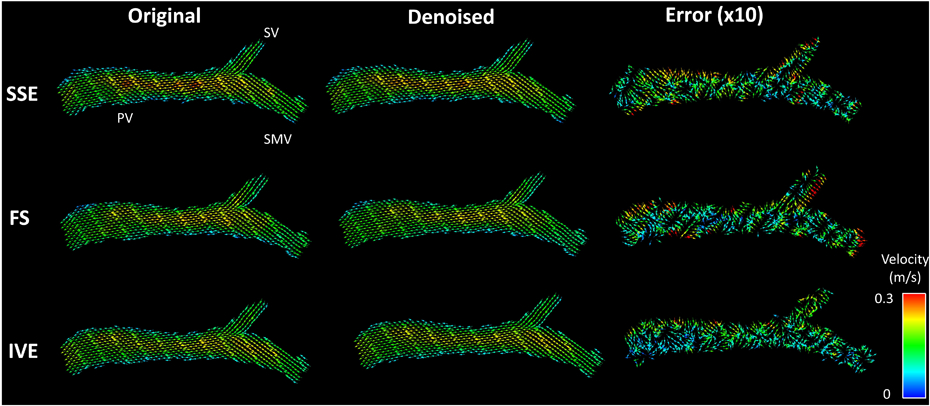
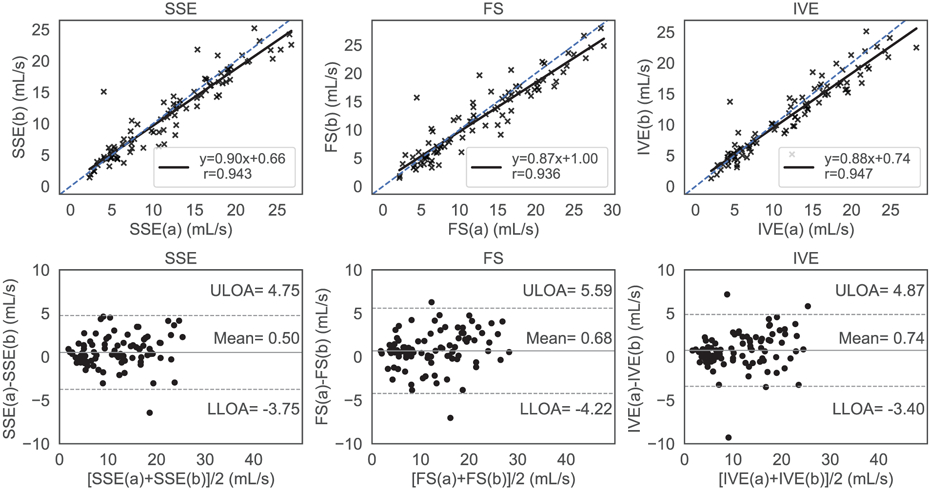
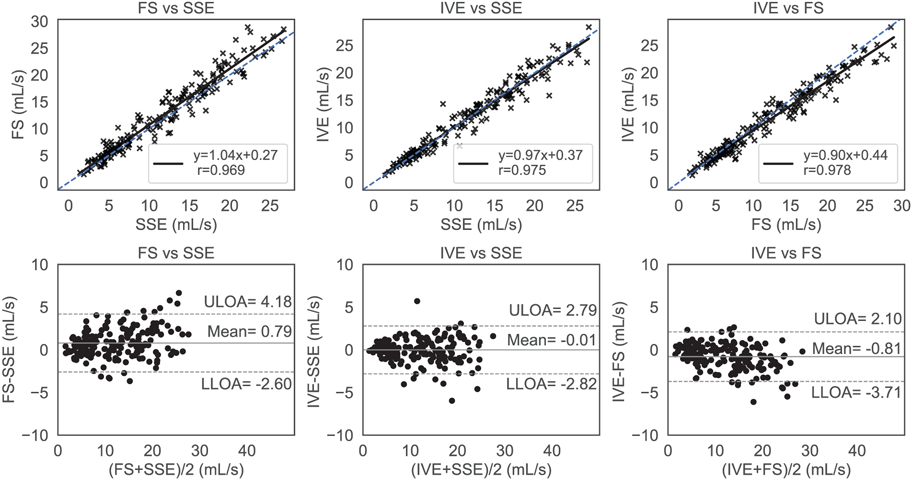
Methods: Radial 4D flow MRI acquisitions with fat mitigation (inner volume excitation [IVE] and intermittent fat saturation [FS]) were compared to a standard slab selective excitation (SSE) in a test-retest study of 15 obese participants. IVE selectively excited a cylindrical region of interest, avoiding contamination from peripheral adipose tissue, while FS globally suppressed fat based on spectral selection. Acquisitions were evaluated qualitatively based on expert ratings and quantitatively based on conservation of mass, test-retest repeatability, and a divergence free quality metric. Errors were evaluated statistically using the absolute and relative errors, regression, and Bland-Altman analysis.

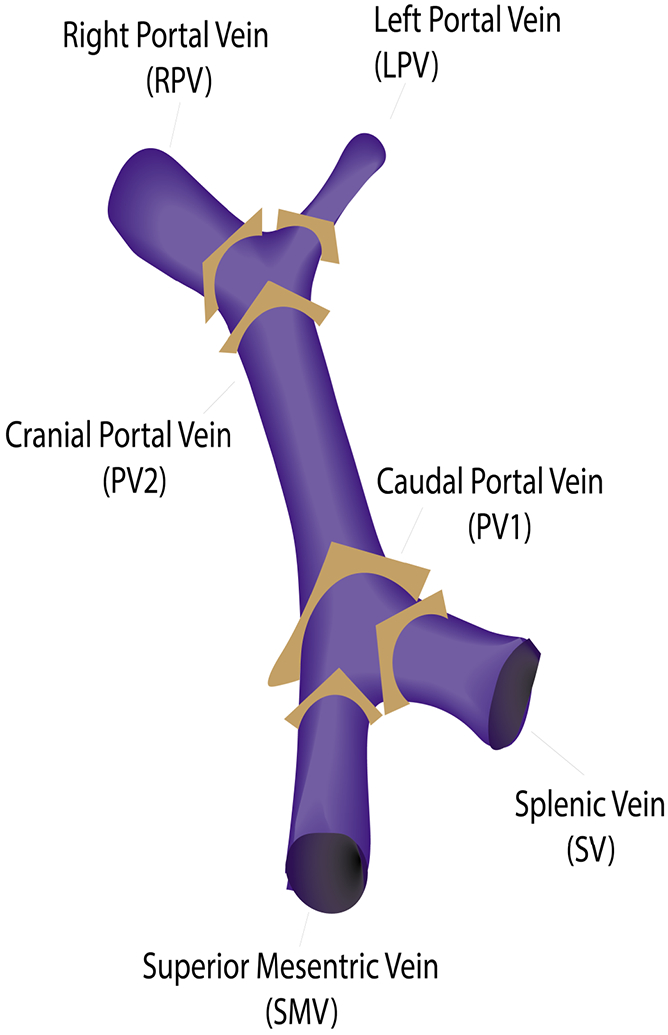
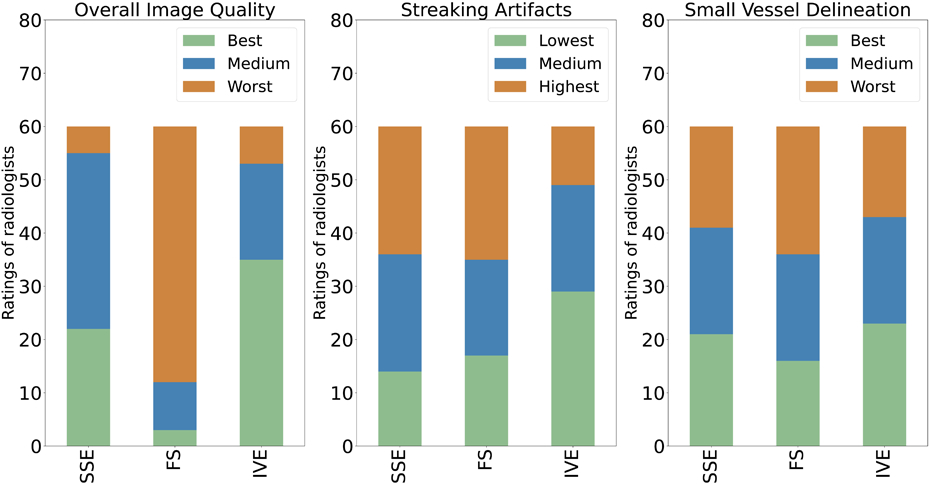
Results: IVE demonstrated superior performance quantitatively in the conservation of mass analysis in the portal vein, with higher correlation and lower bias in regression analysis. IVE also produced flow fields with the lowest divergence error and was rated best in overall image quality, delineating small vessels, and producing the least streaking artifacts. Evaluation results did not differ significantly between FS and SSE. Test-retest reproducibility was similarly high for all sequences, with data suggesting biological variations dominate the technical variability.

Conclusion: IVE improved hemodynamic assessment of radial 4D flow MRI in the abdomen of obese participants while FS did not lead to significant improvements in image quality or flow metrics.


Figures

Figure 1.
Figure 1.
Coronal reformats acquired by each excitation scheme are depicted in 1(A)-1(C). The yellow horizontal lines in 1(A),1(B) and the circle in 1(C) represent the excited imaging volume. Gradient waveforms (Gx, Gy, Gz) and B1 pulse sequences for SSE, FS and IVE are illustrated in 1(D)-1(F) respectively. For representative purposes, a single projection along the z axis is shown with flow compensation. Sequence diagrams with additional details can be found in the Supporting Figure S1-3.
Figure 2.
Figure 2.
Orthogonal cut-planes were positioned closely to the splenomesenteric confluence [superior mesenteric vein (SMV), splenic vein (SV), caudal portal vein (PV1)], and the portal bifurcation [cranial portal vein (PV2), right portal vein (RPV) and left portal vein (LPV)].
Figure 3.
Figure 3.
Maximum Intensity Projected (MIP) magnitude images and complex difference angiograms of a volunteer (mass =129kg and BMI = 42.7) acquired with Standard (SSED), Fat Saturation (FS) and Inner Volume Excitation (IVE). Background streaking artifacts are significantly less prevalent in IVE compared to the other sequences. In addition, IVE demonstrates minimal streaking artifacts in the vessel (yellow arrows) and delineates the smaller vessels clearly (blue arrows). Source images can be found in Supporting Figures S4.
Figure 4
Figure 4
Ratings of radiologists based on Overall image quality (left), Streaking Artifacts (middle), Small Vessel Delineation (right). Rating criteria for overall image quality and small vessel delineation were best, medium, and worst. Streaking artifacts were rated as lowest, medium, and highest. SSE: Standard; FS: Fat Saturated; IVE: Inner Volume Excitation.
Figure 5.
Figure 5.
Conservation of mass at the confluence analyzed with regression analysis (top row) and Bland Altman plots (lower row) for standard (SSE), fat saturated (FS) and inner volume excitation (IVE) 4D flow sequences. The blue dashed line represents identity with the solid black line representing the linear fit. The top, bottom dashed horizontal black lines and the center horizontal solid black line represent the upper limits of agreement (ULOA) and lower limits of agreement (LLOA) and the mean line in the Bland Altman plots (bottom row). The IVE acquisition had the highest level of agreement between inbound and outbound flow with the lowest limits of agreement and the highest correlation.
Figure 6.
Figure 6.
Conservation of mass at the bifurcation analyzed with regression analysis (top row) and Bland Altman plots (bottom row) for standard (SSE), fat saturated (FS) and inner volume excitation (IVE) 4D flow sequences, respectively. The blue dashed line represents identity with the solid black line representing the linear fit. The top, bottom dashed horizontal black lines and the center horizontal solid black line represent the upper limits of agreement (ULOA) and lower limits of agreement (LLOA) and the mean line in the Bland Altman plots (bottom row). IVE exhibited the highest level of agreement between inbound and outbound flow with lowest limits of agreements in the Bland Altman plots
Figure 7.
Figure 7.
Divergence-free error metric analysis to compare the normalized root mean squared velocity error (vNRMSE) among Standard (SSE), Fat Saturation (FS), and Inner Volume Excitation (IVE) acquisitions. IVE exhibited significantly lower error rates in both measures compared to SSE and FS, while SSE and FS showed no significant differences in the metrics.
Figure 8.
Figure 8.
Visualization of divergent free denoising: Original, Denoised represents the vector flow fields before and after finite difference method (FDM) denoising. The error between the original and denoised flow field is magnified ten times before plotting. Inner Volume Excitation (IVE) acquisition demonstrates least errors with the sparsest error flow vector field followed by standard (SSE) and Fat Saturation (FS) acquisitions, respectively. SV, SMV and PV denote splenic vein, superior mesenteric vein and portal vein, respectively.
Figure 9.
Figure 9.
Test-retest repeatability analysis with regression analysis and Bland Altman plots for Standard (SSE), Fat Saturation (FS) and Inner Volume Excitation (IVE), respectively. The blue dashed line represents the ideal regression line with slope=1, bias=0, whereas the solid black line represents the sequence’s performance in the regression plots (top row). The top, bottom dashed horizontal black lines and the center horizontal solid black line represent the upper limits of agreement (ULOA) and lower limits of agreement (LLOA) and the mean line in the Bland Altman plots (bottom row). All methods exhibited a similar level of agreement between the first (a) and the second (b) acquisition with consistently lower velocity values in the second (b) acquisition.
Figure 10.
Figure 10.
Regression and Bland Altman analysis for comparing the cross-sequence flow rates. The blue dashed line represents the ideal regression line with slope=1, bias=0, whereas the solid black line represents the sequence’s performance in the regression plots (top row). The top, bottom dashed horizontal black lines and the center horizontal solid black line represent the upper limits of agreement (ULOA) and lower limits of agreement (LLOA) and the mean line in the Bland Altman plots (bottom row). There was overall a high level of agreement among the acquisitions, with Fat Saturation (FS) trending to have slightly higher flow values.

Similar articles

References

    1. Ioannou GN, Weiss NS, Kowdley KV, Dominitz JA. Is obesity a risk factor for cirrhosis-related death or hospitalization? a population-based cohort study. Gastroenterology. 2003;125(4):1053–1059. doi:10.1016/S0016-5085(03)01200-9 - DOI - PubMed
    1. Schiavo L, Busetto L, Cesaretti M, Zelber-Sagi S, Deutsch L, Iannelli A. Nutritional issues in patients with obesity and cirrhosis. World J Gastroenterol. 2018;24(30):3330–3346. doi:10.3748/wjg.v24.i30.3330 - DOI - PMC - PubMed
    1. Tsochatzis EA, Bosch J, Burroughs AK. Liver cirrhosis. The Lancet. 2014;383(9930):1749–1761. doi:10.1016/S0140-6736(14)60121-5 - DOI - PubMed
    1. Oechtering T, Roberts G, Panagiotopoulos N, Wieben O, Reeder S, Roldán-Alzate A. Clinical Applications of 4D Flow MRI in the Portal Venous System. Magnetic Resonance in Medical Sciences. 2022;21. doi:10.2463/mrms.rev.2021-0105 - DOI - PMC - PubMed
    1. Bannas P, Roldán-Alzate A, Johnson KM, et al. Longitudinal Monitoring of Hepatic Blood Flow before and after TIPS by Using 4D-Flow MR Imaging. Radiology. 2016;281(2):574–582. doi:10.1148/radiol.2016152247 - DOI - PMC - PubMed

Publication types

MeSH terms