. 2023 Jul-Aug;94(4):e197-e214.
doi: 10.1111/cdev.13922. Epub 2023 Apr 10.

Preschoolers rely on rich speech representations to process variable speech

Affiliations

Preschoolers rely on rich speech representations to process variable speech

Margaret Cychosz et al. Child Dev. 2023 Jul-Aug.

Abstract

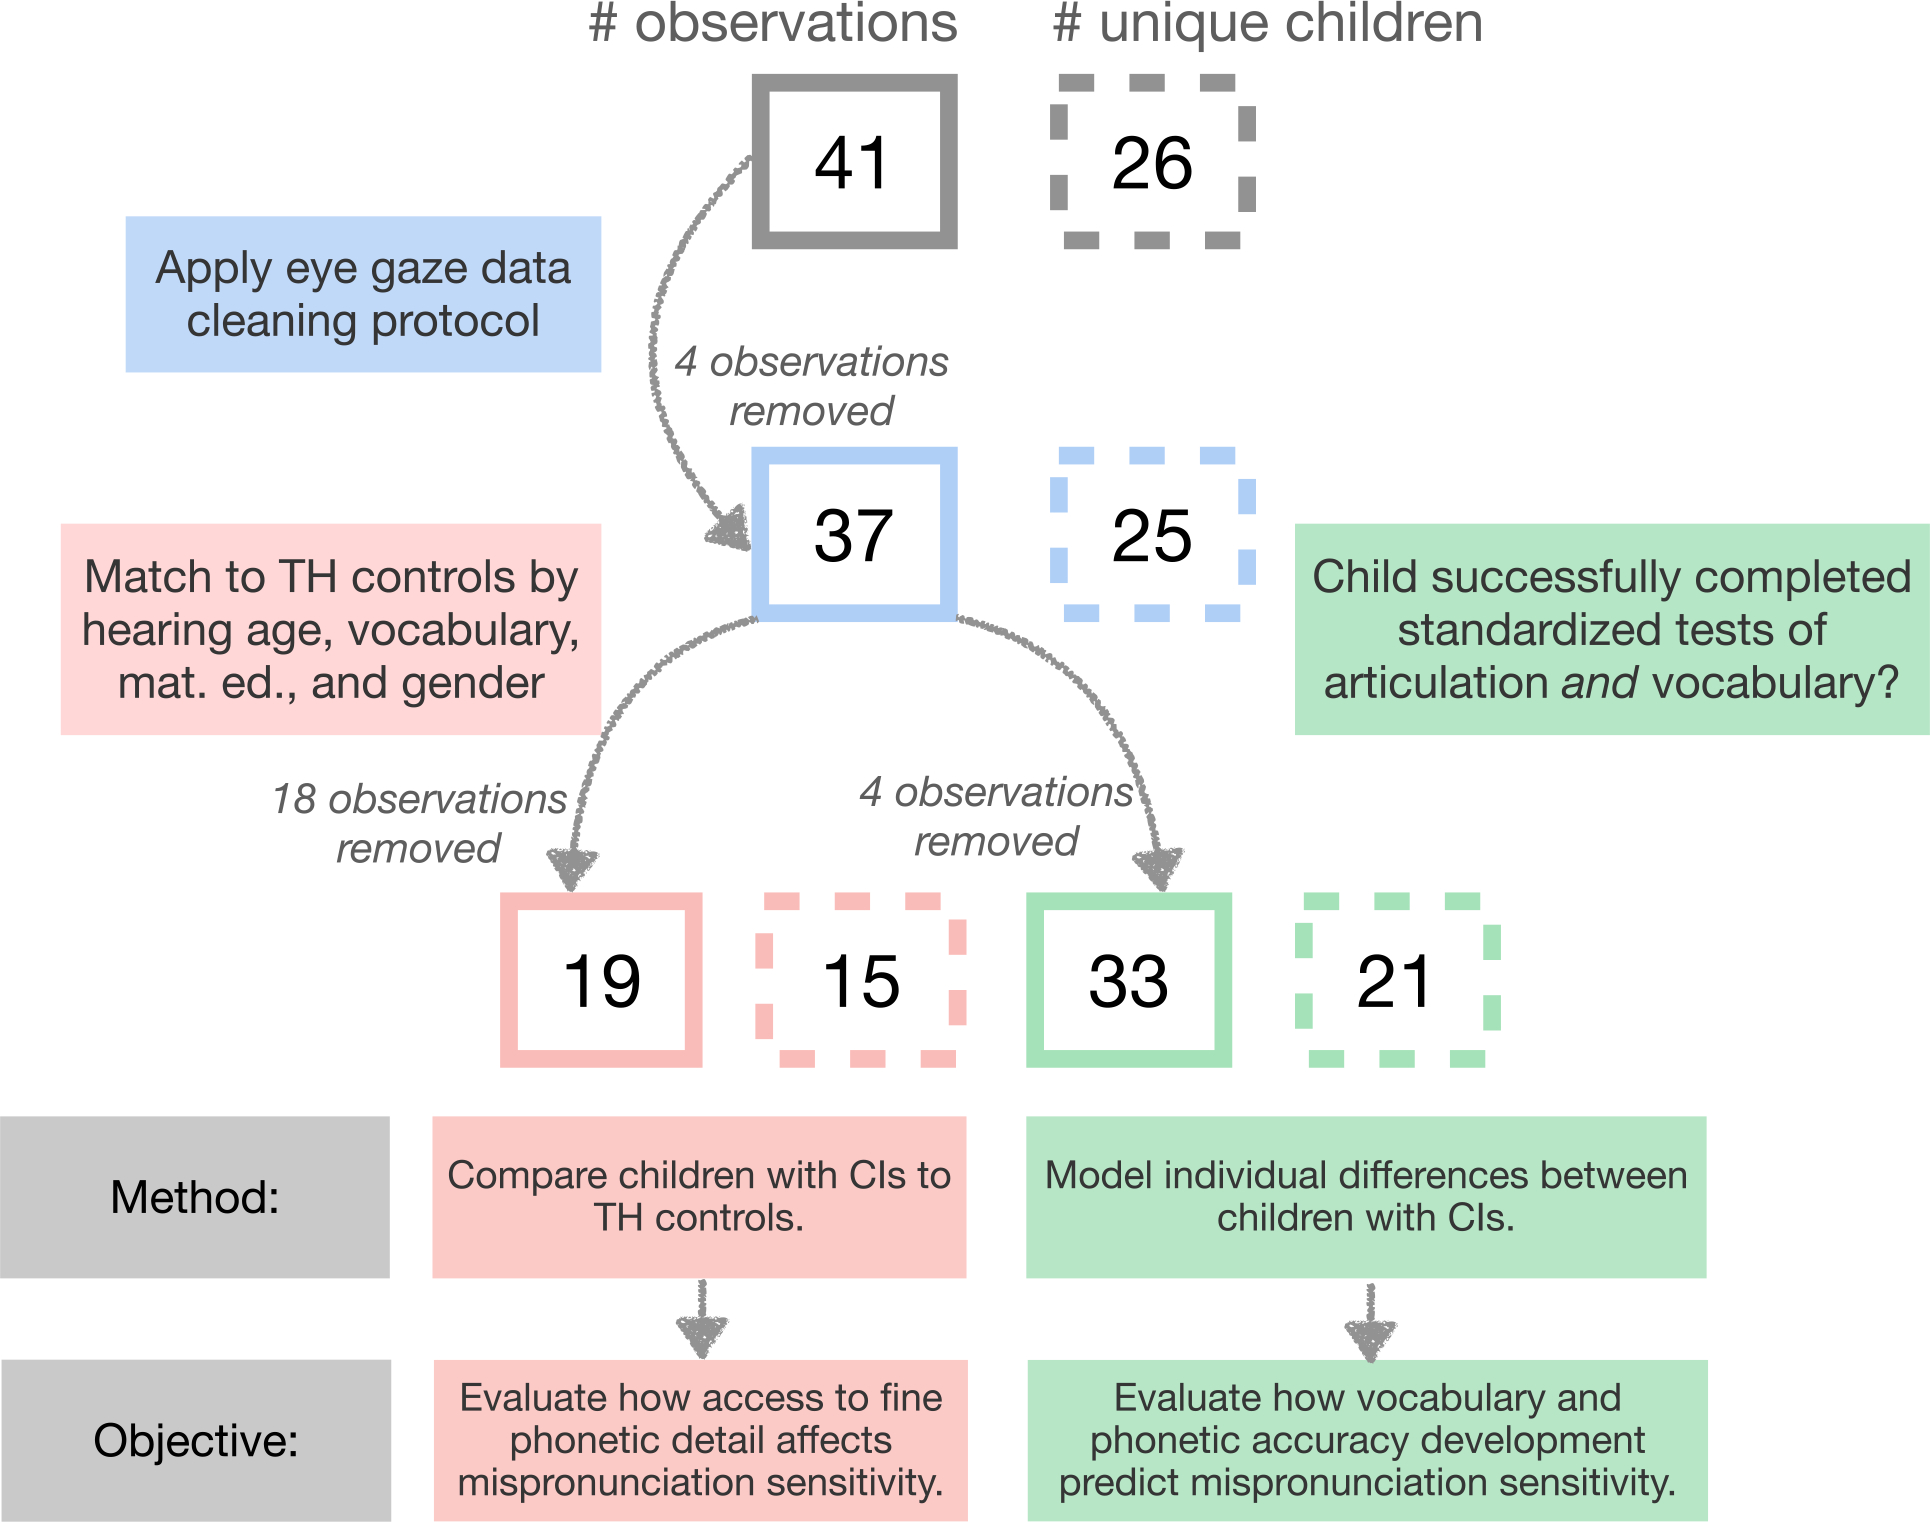
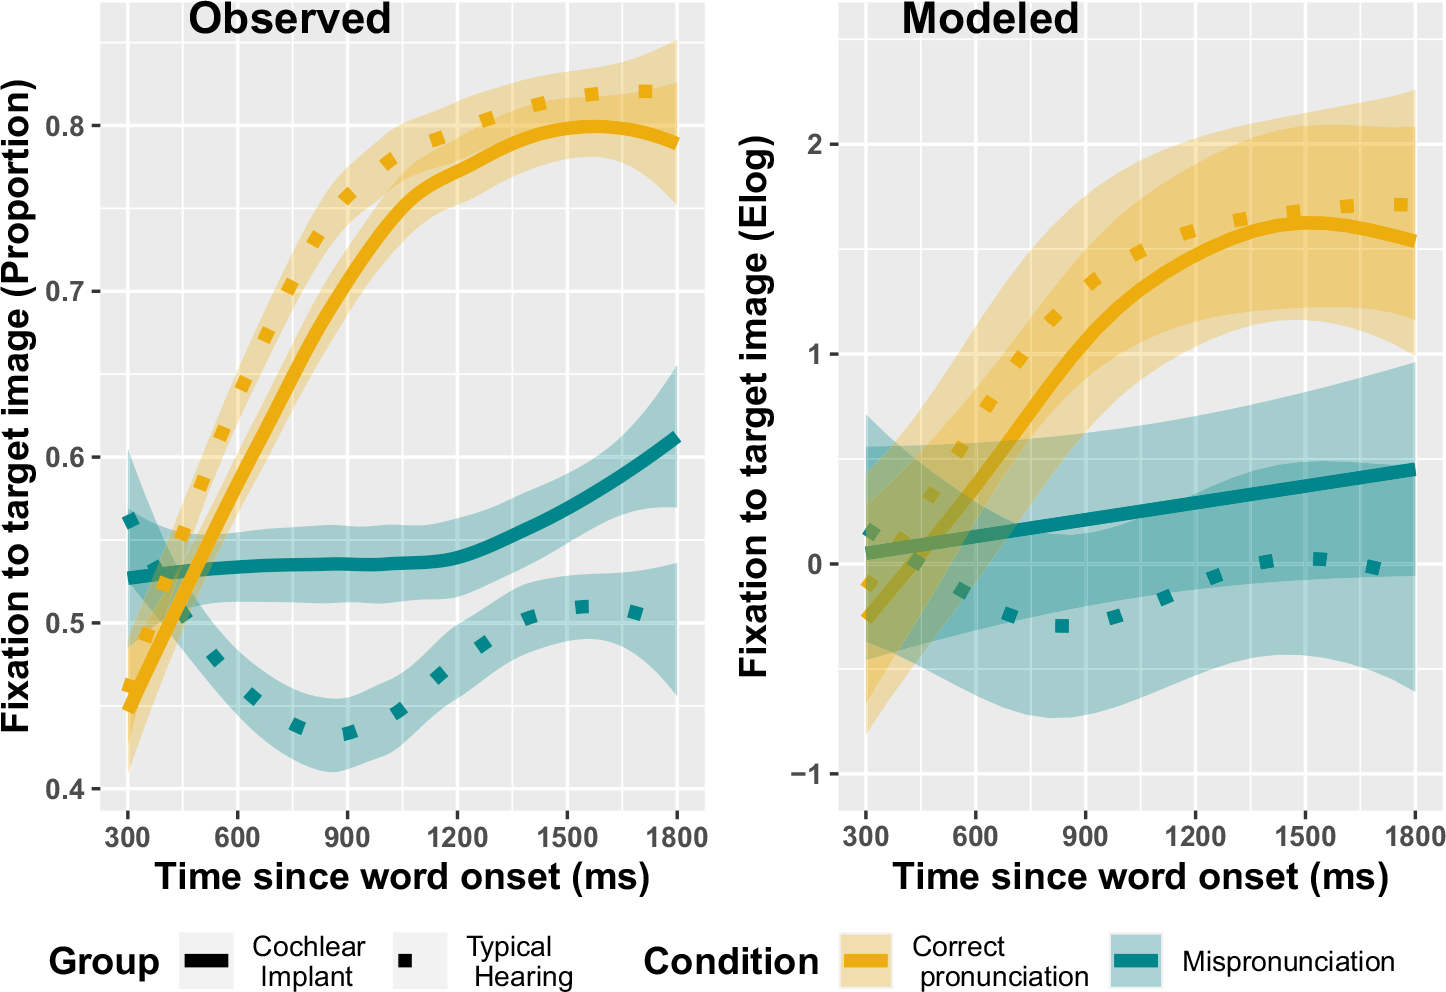
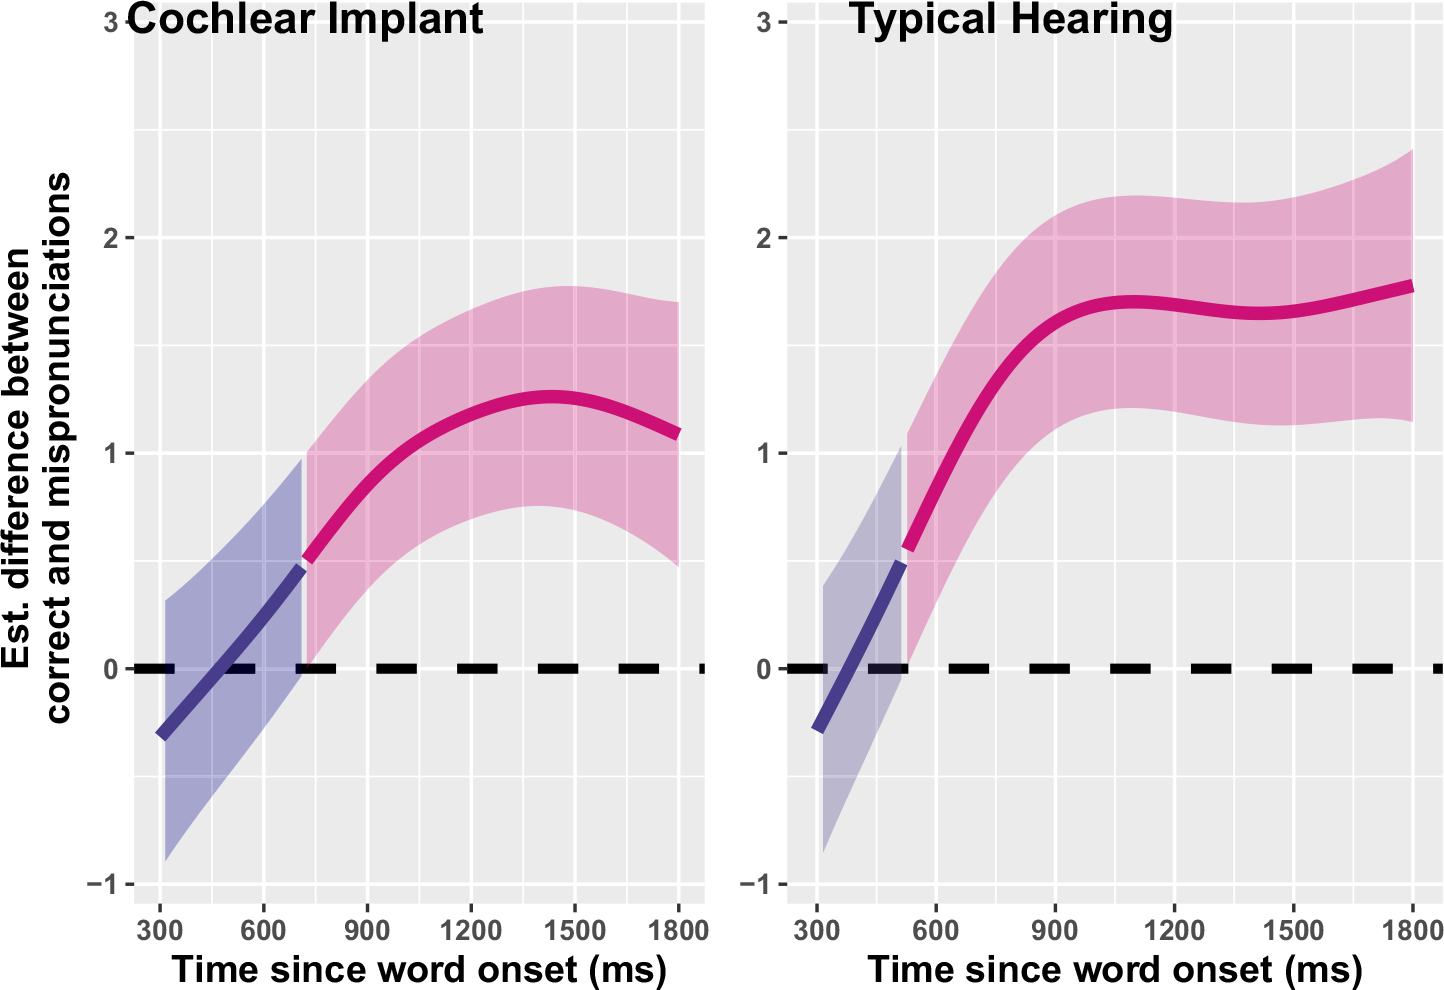
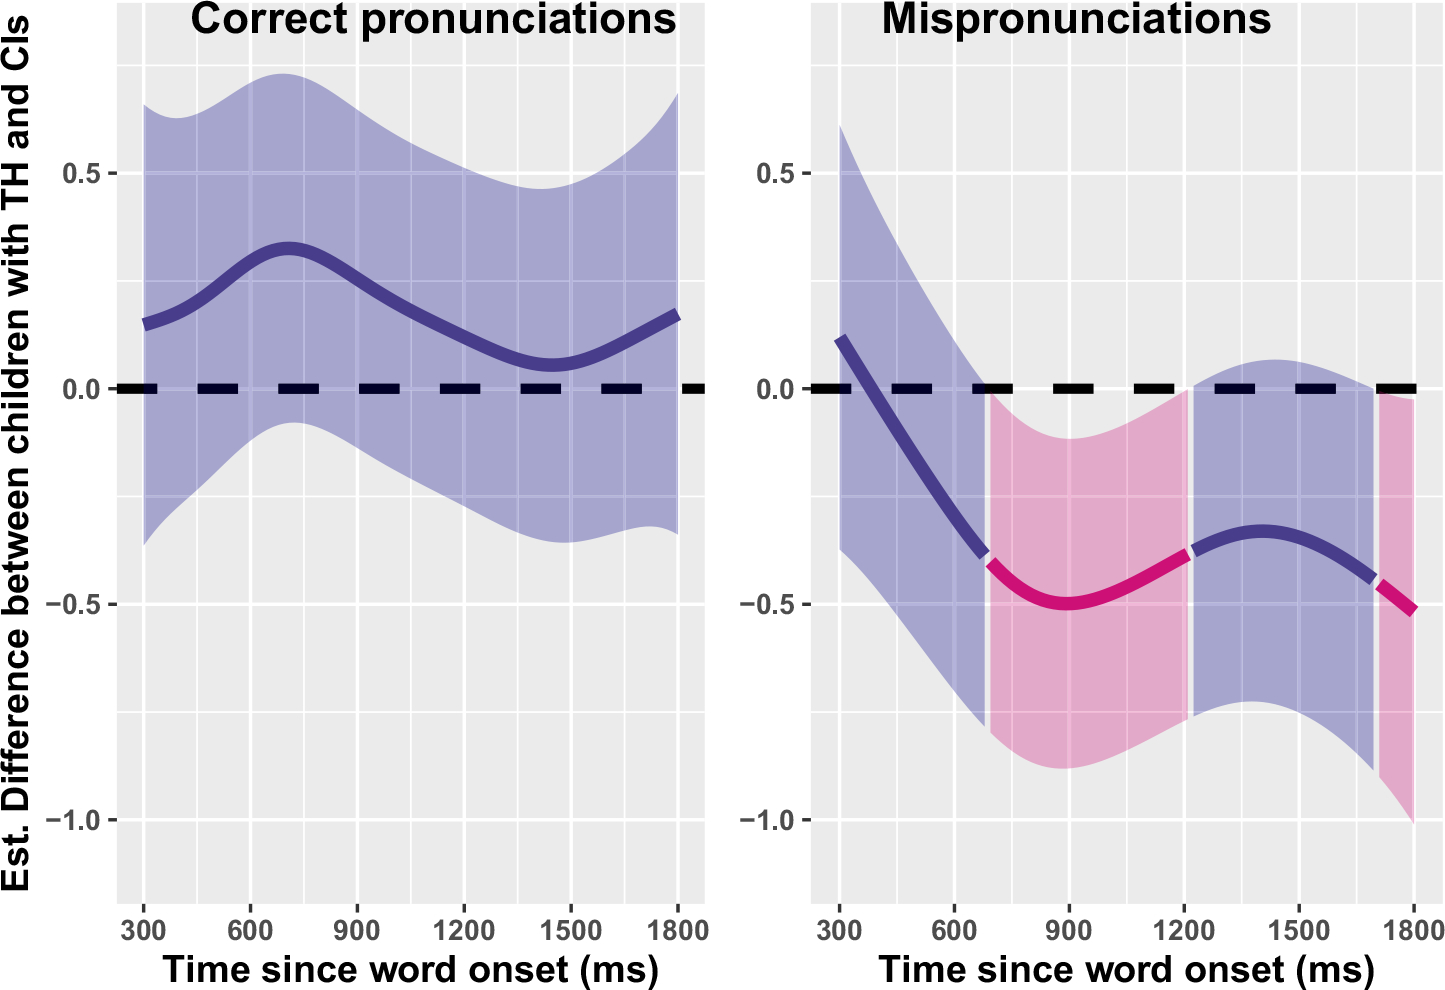
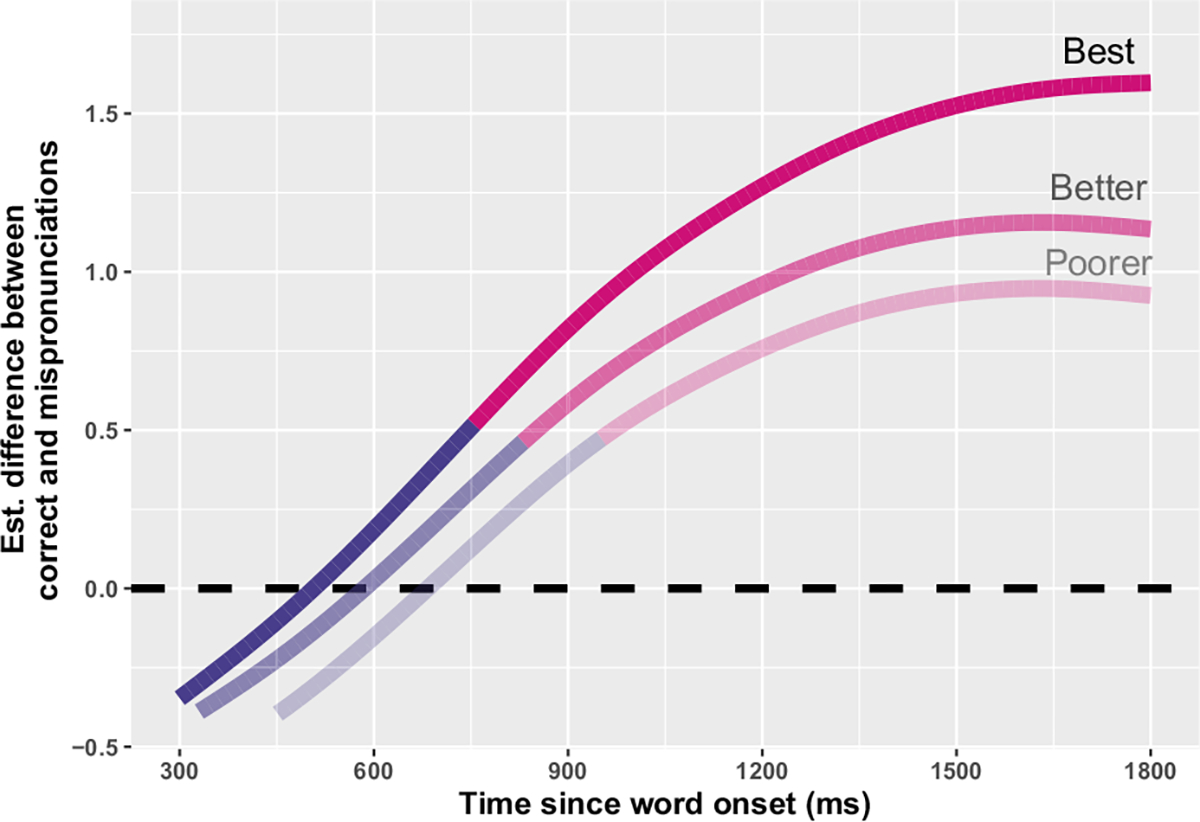
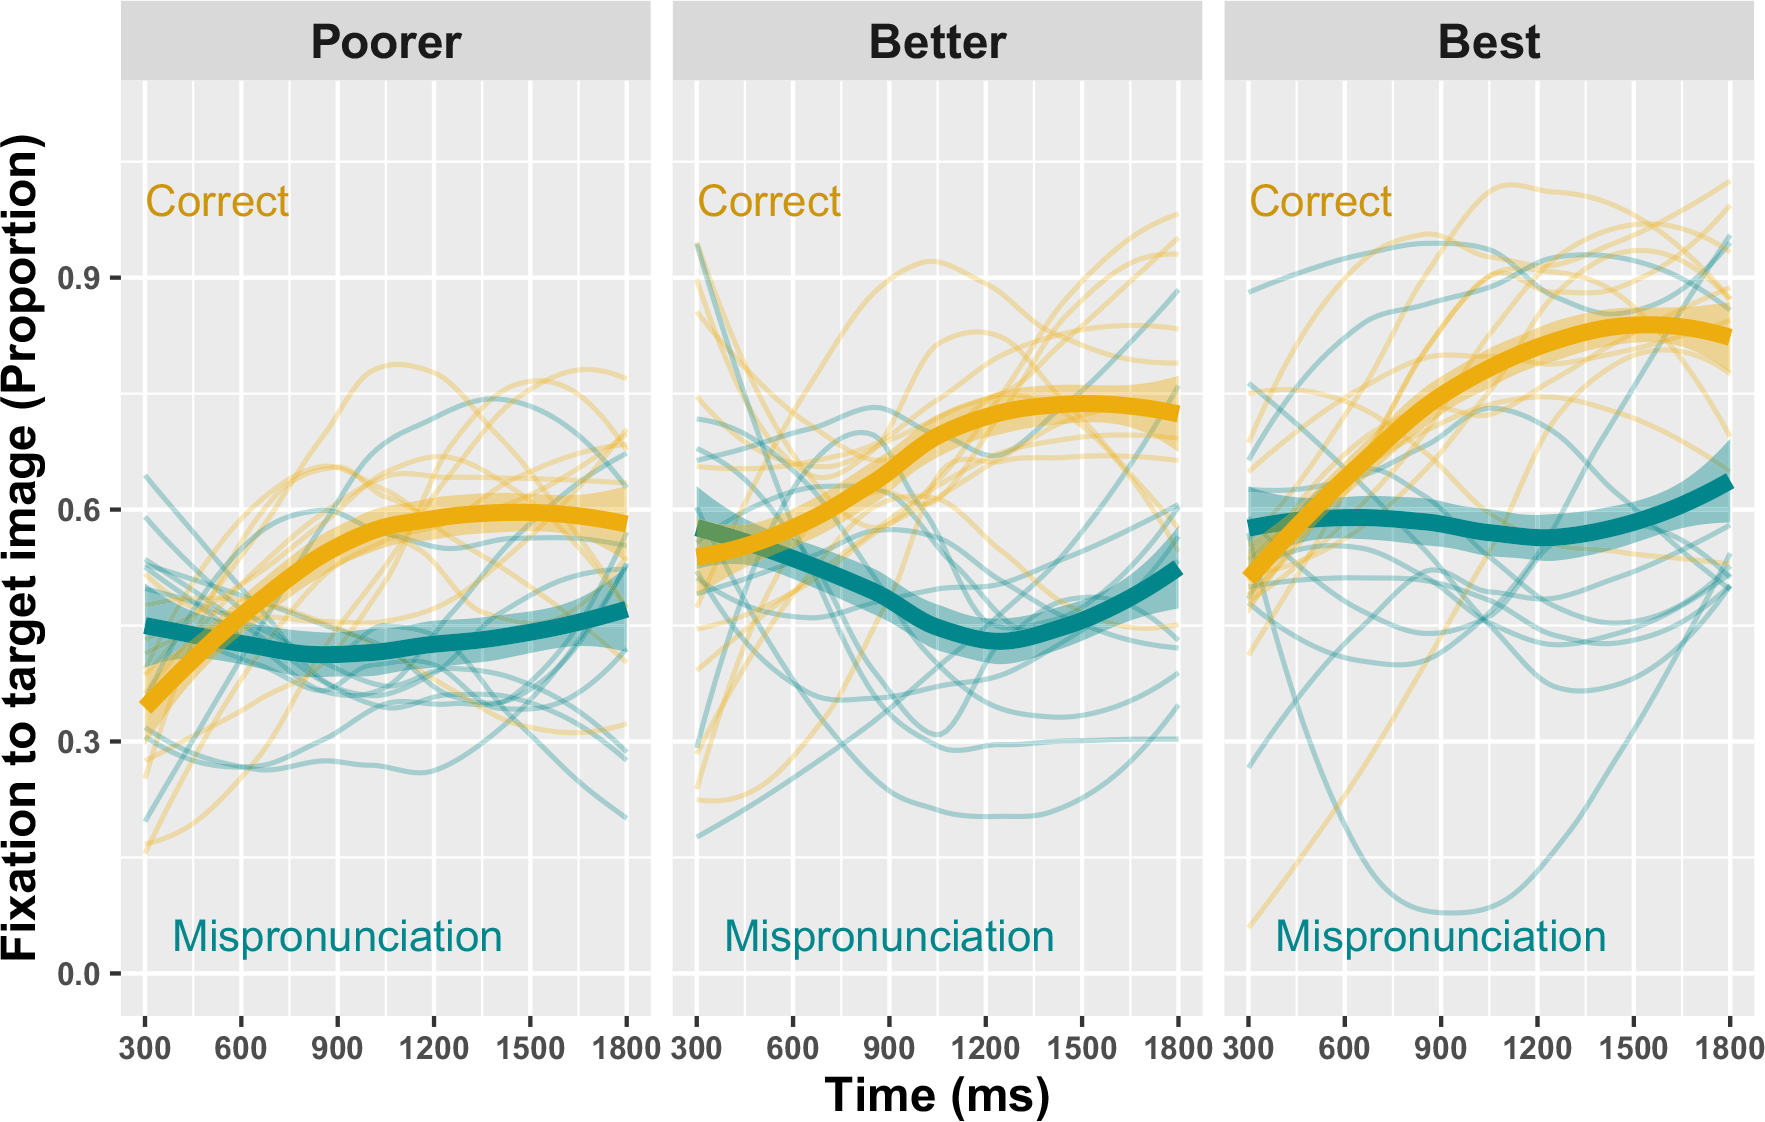
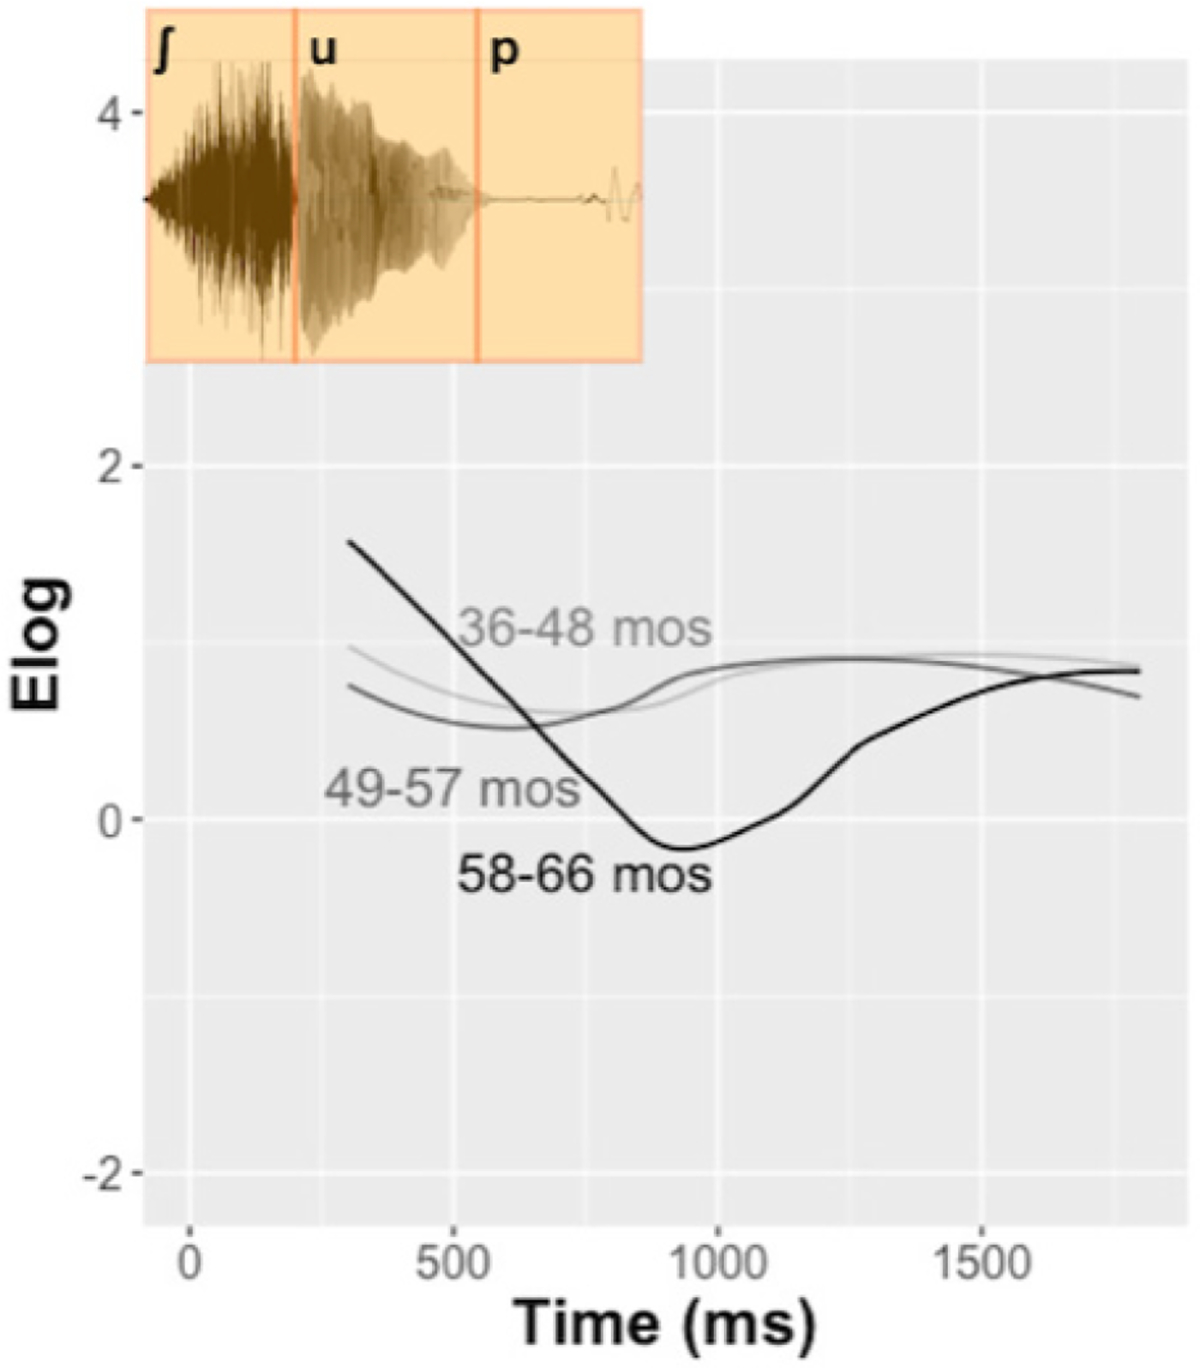
To learn language, children must map variable input to categories such as phones and words. How do children process variation and distinguish between variable pronunciations ("shoup" for soup) versus new words? The unique sensory experience of children with cochlear implants, who learn speech through their device's degraded signal, lends new insight into this question. In a mispronunciation sensitivity eyetracking task, children with implants (N = 33), and typical hearing (N = 24; 36-66 months; 36F, 19M; all non-Hispanic white), with larger vocabularies processed known words faster. But children with implants were less sensitive to mispronunciations than typical hearing controls. Thus, children of all hearing experiences use lexical knowledge to process familiar words but require detailed speech representations to process variable speech in real time.


Conflict of interest statement

CONFLICT OF INTEREST STATEMENT

None declared.

Figures

FIGURE 1
FIGURE 1
Flowchart to illustrate the effects of data cleaning and matching upon a number of children with cochlear implants examined at each analysis stage. Boxes with solid lines correspond to a number of unique observations and boxes with dotted lines to a number of unique children since observations include some children who were observed twice, 1 year apart.
FIGURE 2
FIGURE 2
Generalized Additive Mixed Model predictions for the proportion of looks to a familiar object, by word condition and hearing status. Fixations on the y-axis are plotted as the empirical logit values (elog). Shaded ribbons represent 95% confidence intervals.
FIGURE 3
FIGURE 3
Difference smooths (Generalized Additive Mixed Model predictions) by condition (correct-vs. mis-pronunciations) for children with CIs (L) and TH (R). Pink smooths represent the point when correct- and mispronunciation smooths differ (i.e., the reliable effect of condition) for each group. Shaded ribbons represent 95% confidence intervals. A higher difference value indicates greater discrepancies between correct- and mispronunciations or greater mispronunciation sensitivity: there is a larger difference between correct- (see also difference between yellow lines in Figure 2) and mispronunciation responses (see also the difference between turquoise lines in Figure 2) for children with TH than CIs. CI, cochlear implant; TH, typical hearing.
FIGURE 4
FIGURE 4
Difference smooths (Generalized Additive Mixed Model predictions) by hearing status for correct pronunciations (L) and mispronunciations (R). Pink smooths represent the point when the smoothness for children with CIs differs from children with TH (i.e., the reliable effect of the group). Shaded ribbons represent 95% confidence intervals. A higher difference value indicates larger differences between children with TH and CIs: there is an effect of the group upon mispronunciations, but not correct pronunciations. CI, cochlear implant; TH, typical hearing.
FIGURE 5
FIGURE 5
Difference smooths (Generalized Additive Mixed Model predictions) between correct- and mis-pronunciations for children with cochlear implants, by standardized articulation score. Pink smooths represent the point when correct- and mis-pronunciations smooths significantly differ (i.e., reliable effect of condition). Children were divided into tertiles by score, with smooths representing the median score for children with poorer (median score = 57), better (72), and best (96) articulation scores.
FIGURE 6
FIGURE 6
Raw response trajectories for the proportion of looks to familiar objects for children with cochlear implants, by word condition and standardized articulation score. Children were divided into tertiles by score: poorer (median score = 57), better (72), and best (96) articulation scores.
FIGURE 7
FIGURE 7
Raw response trajectories and audio stimulus for the proportion of looks to soup upon hearing the mispronunciation “shoup” for children with typical hearing. Children were divided into tertiles by chronological age.

References

    1. Ambrose SE, Fey ME, & Eisenberg LS (2012). Phonological awareness and print knowledge of preschool children with cochlear implants. Journal of Speech, Language, and Hearing Research, 55, 811–823. - PMC - PubMed
    1. Bailey TM, & Plunkett K (2002). Phonological specificity in early words. Cognitive Development, 17, 1265–1282. 10.1016/S0885-2014(02)00116-8 - DOI
    1. Ballem KD, & Plunkett K (2005). Phonological specificity in children at 1;2. Journal of Child Language, 32, 159–173. 10.1017/S0305000904006567 - DOI - PubMed
    1. Barr DJ (2008). Analyzing ‘visual world’ eyetracking data using multilevel logistic regression. Journal of Memory and Language, 59, 457–474. 10.1016/j.jml.2007.09.002 - DOI
    1. Bent T, Baese- Berk M, Borrie SA, & McKee M (2016). Individual differences in the perception of regional, nonnative, and disordered speech varieties. The Journal of the Acoustical Society of America, 140, 3775–3786. 10.1121/1.4966677 - DOI - PubMed

Publication types