

A gene-level test for directional selection on gene expression
- PMID: 37036411
- PMCID: PMC10213495
- DOI: 10.1093/genetics/iyad060
A gene-level test for directional selection on gene expression
Abstract
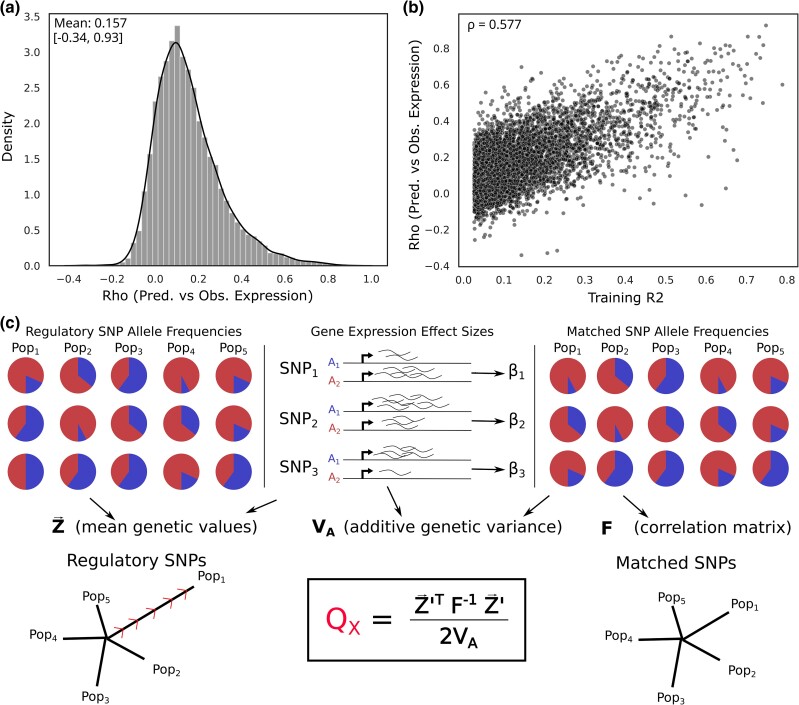
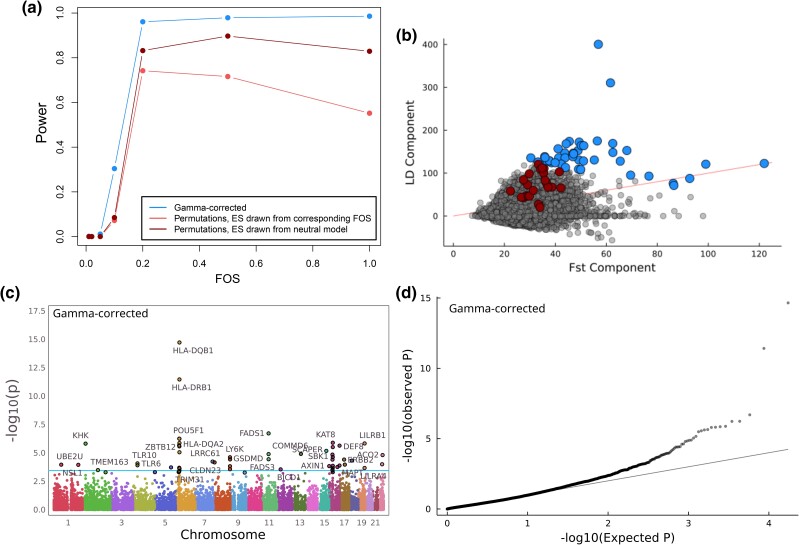
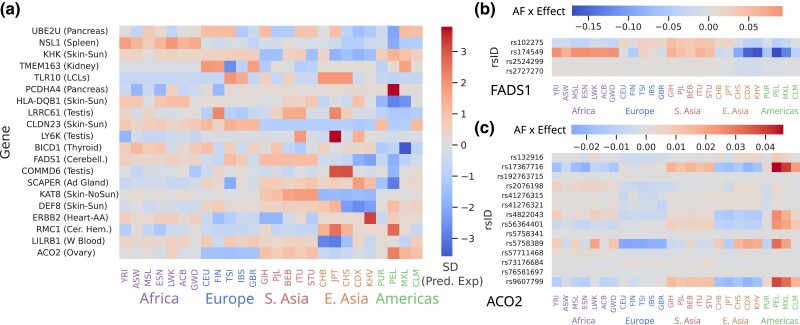
Most variants identified in human genome-wide association studies and scans for selection are noncoding. Interpretation of their effects and the way in which they contribute to phenotypic variation and adaptation in human populations is therefore limited by our understanding of gene regulation and the difficulty of confidently linking noncoding variants to genes. To overcome this, we developed a gene-wise test for population-specific selection based on combinations of regulatory variants. Specifically, we use the QX statistic to test for polygenic selection on cis-regulatory variants based on whether the variance across populations in the predicted expression of a particular gene is higher than expected under neutrality. We then applied this approach to human data, testing for selection on 17,388 protein-coding genes in 26 populations from the Thousand Genomes Project. We identified 45 genes with significant evidence (FDR<0.1) for selection, including FADS1, KHK, SULT1A2, ITGAM, and several genes in the HLA region. We further confirm that these signals correspond to plausible population-level differences in predicted expression. While the small number of significant genes (0.2%) is consistent with most cis-regulatory variation evolving under genetic drift or stabilizing selection, it remains possible that there are effects not captured in this study. Our gene-level QX score is independent of standard genomic tests for selection, and may therefore be useful in combination with traditional selection scans to specifically identify selection on regulatory variation. Overall, our results demonstrate the utility of combining population-level genomic data with functional data to understand the evolution of gene expression.
Keywords: evolution; gene regulation; human evolution; quantitative genetics; selection.
© The Author(s) 2023. Published by Oxford University Press on behalf of The Genetics Society of America.
Conflict of interest statement
The authors report no conflicts of interest.
Figures
Similar articles
-
Predicting Functional Consequences of Recent Natural Selection in Britain.Mol Biol Evol. 2024 Mar 1;41(3):msae053. doi: 10.1093/molbev/msae053. Mol Biol Evol. 2024. PMID: 38466119 Free PMC article.
-
Conditional entropy in variation-adjusted windows detects selection signatures associated with expression quantitative trait loci (eQTLs).BMC Genomics. 2015;16 Suppl 8(Suppl 8):S8. doi: 10.1186/1471-2164-16-S8-S8. Epub 2015 Jun 18. BMC Genomics. 2015. PMID: 26111110 Free PMC article.
-
Natural Selection and Functional Potentials of Human Noncoding Elements Revealed by Analysis of Next Generation Sequencing Data.PLoS One. 2015 Jun 8;10(6):e0129023. doi: 10.1371/journal.pone.0129023. eCollection 2015. PLoS One. 2015. PMID: 26053627 Free PMC article.
-
The molecular signature of selection underlying human adaptations.Am J Phys Anthropol. 2006;Suppl 43:89-130. doi: 10.1002/ajpa.20518. Am J Phys Anthropol. 2006. PMID: 17103426 Review.
-
Genetics of Inflammatory Bowel Diseases.Gastroenterology. 2015 Oct;149(5):1163-1176.e2. doi: 10.1053/j.gastro.2015.08.001. Epub 2015 Aug 7. Gastroenterology. 2015. PMID: 26255561 Free PMC article. Review.
Cited by
-
Insights into trait-association of selection signatures and adaptive eQTL in indigenous African cattle.BMC Genomics. 2024 Oct 19;25(1):981. doi: 10.1186/s12864-024-10852-8. BMC Genomics. 2024. PMID: 39425030 Free PMC article.
-
Predicting functional consequences of recent natural selection in Britain.bioRxiv [Preprint]. 2023 Oct 19:2023.10.16.562549. doi: 10.1101/2023.10.16.562549. bioRxiv. 2023. Update in: Mol Biol Evol. 2024 Mar 1;41(3):msae053. doi: 10.1093/molbev/msae053. PMID: 37904954 Free PMC article. Updated. Preprint.
-
Predicting Functional Consequences of Recent Natural Selection in Britain.Mol Biol Evol. 2024 Mar 1;41(3):msae053. doi: 10.1093/molbev/msae053. Mol Biol Evol. 2024. PMID: 38466119 Free PMC article.
References
-
- Agresti A, Coull BA. Approximate is better than “exact” for interval estimation of binomial proportions. Am Stat. 1998;52(2):119–126.
-
- Ameur A, Enroth S, Johansson Å, Zaboli G, Igl W, Johansson ACV, Rivas MA, Daly MJ, Schmitz G, Hicks AA, et al. Genetic adaptation of fatty-acid metabolism: a human-specific haplotype increasing the biosynthesis of long-chain omega-3 and omega-6 fatty acids. Am J Hum Genet. 2012;90(5):809–820. doi:10.1016/j.ajhg.2012.03.014 - DOI - PMC - PubMed
Publication types
MeSH terms
Grants and funding
LinkOut - more resources
Full Text Sources
Medical
Research Materials
