. 2023 May 19;30(6):1079-1090.
doi: 10.1093/jamia/ocad055.

ENRICHing medical imaging training sets enables more efficient machine learning

Affiliations

ENRICHing medical imaging training sets enables more efficient machine learning

Erin Chinn et al. J Am Med Inform Assoc. .

Abstract

Objective: Deep learning (DL) has been applied in proofs of concept across biomedical imaging, including across modalities and medical specialties. Labeled data are critical to training and testing DL models, but human expert labelers are limited. In addition, DL traditionally requires copious training data, which is computationally expensive to process and iterate over. Consequently, it is useful to prioritize using those images that are most likely to improve a model's performance, a practice known as instance selection. The challenge is determining how best to prioritize. It is natural to prefer straightforward, robust, quantitative metrics as the basis for prioritization for instance selection. However, in current practice, such metrics are not tailored to, and almost never used for, image datasets.

Materials and methods: To address this problem, we introduce ENRICH-Eliminate Noise and Redundancy for Imaging Challenges-a customizable method that prioritizes images based on how much diversity each image adds to the training set.

Results: First, we show that medical datasets are special in that in general each image adds less diversity than in nonmedical datasets. Next, we demonstrate that ENRICH achieves nearly maximal performance on classification and segmentation tasks on several medical image datasets using only a fraction of the available images and without up-front data labeling. ENRICH outperforms random image selection, the negative control. Finally, we show that ENRICH can also be used to identify errors and outliers in imaging datasets.

Conclusions: ENRICH is a simple, computationally efficient method for prioritizing images for expert labeling and use in DL.

Keywords: data efficiency; data quality; deep learning; information theory; instance selection; medical imaging.


Conflict of interest statement

None declared.

Figures

Figure 1.
Figure 1.
Similarity in imaging datasets and experimental approach. A, Schematic of the dataset diversity plot, a cumulative density plot of maximum pairwise similarities. Dataset diversity scores are indicated. B, Dataset diversity plots and scores for ECHO-F, OCT, STL10, and ECHO-F-SEG datasets. Also, included are the total images available for the ECHO-F segmentation task, ECHO-F-SEG-ALL. C, Pairwise image similarities in a handful of images drawn from OCT, STL10, and ECHO-F. Red-, orange-, and yellow-bordered squares indicate similarities within the OCT, STL, and ECHO datasets, respectively. D, Schematic summary of ENRICH. From all available images in a dataset, an initial training set is chosen at random. The remaining images comprise a candidate pool of images from which additional images can be selected. A matrix of pairwise image similarities (step 1 of ENRICH) is constructed. From this matrix, an algorithm is used to choose additional images to add to the initial training set; this is step 2 of ENRICH. This process is repeated, iteratively adding images to an initial subset.
Figure 2.
Figure 2.
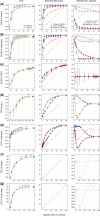
Performance of ENRICHed training datasets compared to randomly selected training datasets. (A) ECHO-F binary, (B) ECHO-F multiclass, (C) ECHO-F-SEG segmentation, (D) OCT binary, (E) OCT multiclass, (F) STL10 binary, and (G) STL10 multiclass. Each panel shows test performance on top, representativeness of images in the middle, and effective class size on the bottom. Performance testing, top: from a common initial random starting dataset (gray), additional images were added to grow increasingly larger training subsets using ENRICH (blue circle) versus random addition (yellow triangle). Each datapoint represents mean AUCROC on the test set from 30 replicates; error bars for each datapoint show one standard deviation around the mean. Asterisks for each training data subset represent statistical differences between ENRICH and random according to the standard convention (ns = P >.05; * = P .05; ** = P .01; *** = P .001; **** = P .0001). Empty symbols are statistically indistinguishable from model performance using the full training set (100% of training images; black dot). Representativeness, middle: for ENRICH (cool colors, circles) and random selection (warm colors, triangles), for each training subset, the percentage of the total training set is shown at an image (light blue circle, light yellow triangle), clip (medium blue circle, orange triangle), and patient (dark blue circle, red triangle) levels where applicable). Effective number of classes, bottom: for ENRICH (cool colors, circles) and random selection (warm colors, triangles), for each training subset, the effective number of classes is shown at an image (light blue circle, light yellow triangle), clip (medium blue circle, orange triangle), and patient (dark blue circle, red triangle ) levels where applicable). For representativeness and effective size as well, error bars are shown but are small, and relevant P-values are summarized in the text.
Figure 3.
Figure 3.
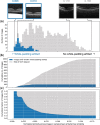
ENRICH aids in screening medical datasets for artifacts. A pairwise-similarity matrix was constructed from a sample of 1000 images in OCT. For each image in the matrix, a mean of the similarities to all other images (one row of the matrix) was calculated and normalized by the maximum similarity across the entire matrix. A, A stacked-bar histogram of these values, where images most different from the others are to the left, and most similar images are to the right. Blue (darker color) indicates images known to have a white-padding artifact; two examples are shown above, with their mean/max ratio as indicated. (B) Stacked cumulative distribution and (C) cumulative fraction of images in the sample, demonstrating how mean/max ratio of image similarities facilitates identification of images with artifacts. For example, in this thousand-image sample, about 10% of images have the white-padding artifact.

References

    1. Madani A, Arnaout R, Mofrad M, Arnaout R.. Fast and accurate view classification of echocardiograms using deep learning. NPJ Digit Med 2018; 1. - PMC - PubMed
    1. Kornblith AE, Addo N, Dong R, et al.Development and validation of a deep learning strategy for automated view classification of pediatric focused assessment with sonography for trauma. J Ultrasound Med 2022; 41 (8): 1915–24. - PMC - PubMed
    1. Arnaout R, Curran L, Zhao Y, et al.An ensemble of neural networks provides expert-level prenatal detection of complex congenital heart disease. Nat Med 2021; 27 (5): 882–91. - PMC - PubMed
    1. Lee G, Fujita H, eds. Deep Learning in Medical Image Analysis: Challenges and Applications. Switzerland: Springer International Publishing; 2020. doi:10.1007/978-3-030-33128-3. - DOI
    1. Esteva A, Kuprel B, Novoa RA,. et al. Dermatologist-level classification of skin cancer with deep neural networks. Nature 2017; 542 (7639): 115–8. 10.1038/nature21056. - DOI - PMC - PubMed

Publication types