. 2023 Apr 18;120(16):e2216811120.
doi: 10.1073/pnas.2216811120. Epub 2023 Apr 10.

Lipid droplets are intracellular mechanical stressors that impair hepatocyte function

Affiliations

Lipid droplets are intracellular mechanical stressors that impair hepatocyte function

Abigail E Loneker et al. Proc Natl Acad Sci U S A. .

Abstract

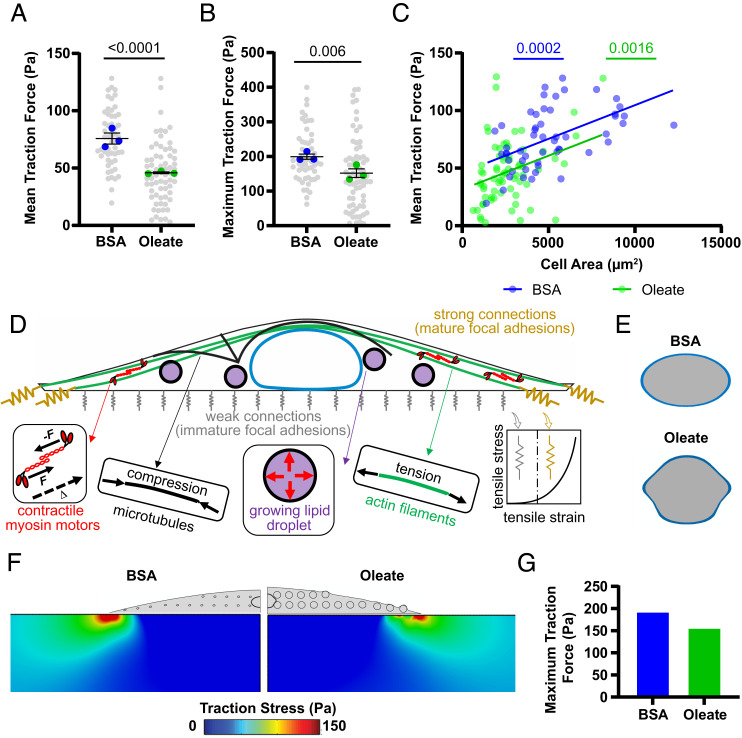
Matrix stiffening and external mechanical stress have been linked to disease and cancer development in multiple tissues, including the liver, where cirrhosis (which increases stiffness markedly) is the major risk factor for hepatocellular carcinoma. Patients with nonalcoholic fatty liver disease and lipid droplet-filled hepatocytes, however, can develop cancer in noncirrhotic, relatively soft tissue. Here, by treating primary human hepatocytes with the monounsaturated fatty acid oleate, we show that lipid droplets are intracellular mechanical stressors with similar effects to tissue stiffening, including nuclear deformation, chromatin condensation, and impaired hepatocyte function. Mathematical modeling of lipid droplets as inclusions that have only mechanical interactions with other cellular components generated results consistent with our experiments. These data show that lipid droplets are intracellular sources of mechanical stress and suggest that nuclear membrane tension integrates cell responses to combined internal and external stresses.

Keywords: HNF4α; chromatin condensation; cytoskeleton; mechanobiology; nuclear deformation.


Conflict of interest statement

The authors declare no competing interest.

Figures

Fig. 1.
Fig. 1.
Lipid droplet accumulation decreases nuclear size and disrupts nuclear/cytoplasmic volume ratios. (A) Cell volume (n = 3), (B) cell area (n = 5), (C) nuclear volume (n = 5), and (D) nuclear area (n = 6) in control and oleate-treated cells on soft PAA, stiff PAA, and glass. (E) Scatterplot comparing cell volume and nuclear volume in individual cells, pooled across stiffnesses, fit with linear regression. (F) Scatterplot comparing estimated cytoplasmic volume and nuclear volume in individual cells, pooled across stiffnesses, fit with linear regression. Statistics: (AD) Data are mean ± SE of n independent experiments; P values were calculated using two-way ANOVA. (E and F) Data are values for individual cells from n = 3 independent experiments. P value was calculated with an F test.
Fig. 2.
Fig. 2.
Lipid droplets indent hepatocyte nuclei, impairing hepatocyte-specific functions. (A) Nuclei of oleate-treated cells are indented by lipid droplets. Under each heading for stiffness, left column images show representative cells with lipid droplets, and right column images are zoomed-in views of the same cell nucleus with white arrowheads used to emphasize areas of indentation and red arrowheads used to emphasize areas of acute positive curvature. Bottom row shows examples of deformation in the YZ plane. Scale is the same for first two rows of images, with the bar = 25 μm. YZ cross-sections have individual scale bars representing 10 μm. DAPI (blue), BODIPY (green), and lamin A/C (red). (B) Schematic representation of nuclear irregularity, the parameter used to quantify nuclear deformation in the XY plane. (C) Nuclear irregularity (n = 5) and (D) YZ aspect ratio (n = 3) in control and oleate-treated cells. (E) Histograms of radii of curvature of nuclear membrane indentations. (F) HNF4α mean intensity (n = 6, normalized to control on soft) in nuclei of control and oleate-treated cells. (G) Concentration of human albumin (n = 3) produced by PHH as measured in media of control and oleate-treated cells. (H) Scatterplot with linear regression of nuclear irregularity vs. nuclear HNF4α intensity in individual cells on soft substrates. Statistics: (C, D, F, and G) Data are mean ± SE of n independent experiments. P values were calculated using two-way ANOVA with multiple comparisons. (E) Data are individual dent radii pooled across cells from n = 3 independent experiments. On each stiffness, control and oleate-treated distributions compared with the K–S test. (H) Data are values for individual cells on soft gels from n = 3 independent experiments. P value was calculated with an F test.
Fig. 3.
Fig. 3.
Lipid loading condenses chromatin and can promote DNA damage. (A) Chromatin condensation parameter (n = 5) of control and oleate-treated cells. (B) Quantification and (C) visualization of modeled chromatin phase separation in response to mechano-osmotic forces. Circular images represent heterochromatin domain size and organization within simulated cell nuclei for control and oleate-treated cells (red representing compact heterochromatin and blue uncompact euchromatin). The average size of heterochromatin domains over repeated simulations is quantified in B. (D) Scatterplot with linear regression of chromatin condensation parameter vs. nuclear HNF4α intensity in individual cells on soft substrates. (E) Scatterplot with linear regression of nuclear irregularity vs. chromatin condensation parameter in individual cells on soft substrates. (F) γH2AX foci (n = 3) normalized to nuclear cross-sectional area in control and oleate-treated cells. (G) Percentage of cells staining fully positive for γH2AX. (H) Nuclear irregularity and (I) cross-sectional area of oleate-treated cells depending on γH2AX staining. Statistics: (A and F) Data are mean ± SE of n independent experiments. P values were calculated using two-way ANOVA with multiple comparisons. (D and E) Data are values for individual cells from n = 3 independent experiments. P value was calculated with an F test. (G) Data are percentage of total cells from n = 3 independent experiments. P values were calculated with the chi-squared test. (H and I) Data points represent individual cells from the two experiments where fully positive γH2AX nuclei were observed. This subset of cells was compared to the others with an unpaired t test.
Fig. 4.
Fig. 4.
Lipid droplets disrupt cytoskeletal fibers. (A) Representative images of actin organization (phalloidin) in control and oleate-treated cells on soft PAA, stiff PAA, and glass. Oleate-treated cells shown with (bottom row) and without (middle row) lipid droplets. Images are maximum Z projections. Scale bar is 25 μm and the same for all images. DAPI (blue), BODIPY (green), and phalloidin (red). (B) Mean phalloidin intensity (normalized to mean of control on soft) for control and oleate-treated cells. (C) Mean fiber length and (D) junction density of actin fibers. (E) Frequency of aligned actin fiber directions in control and oleate-treated cells. (F) Representative images of microtubule organization (α-tubulin) in control and oleate-treated cells. Oleate-treated cells are shown with (bottom row) and without (middle row) lipid droplets. Images are maximum Z projections. Scale bar is 50 μm and applies to all images. DAPI (blue), BODIPY (green), and α-tubulin (red). (G) Mean α-tubulin intensity (normalized to mean of control on glass) for control and oleate-treated cells. (H) Mean fiber length and (I) junction density of microtubules. (J) Mean lamin A/C staining (normalized to mean of control on glass) for control and oleate-treated cells. Statistics: (BD and GI). Data are mean ± SE of n = 3 independent experiments. P values were calculated using two-way ANOVA with multiple comparisons.(E) Data are percentage of total cells from n = 3 independent experiments. P values were calculated with a chi-squared test comparing control to oleate-treated distribution on each stiffness. (J) Data are mean ± SE of n = 4 independent experiments. P values were calculated using two-way ANOVA with multiple comparisons.
Fig. 5.
Fig. 5.
Experimental and modeling approaches show that lipid droplets reduce cell force generation. (A) Mean and (B) maximum traction forces for control and oleate-treated cells on stiff PAA gels. (C) Scatterplot with linear regression of cell area vs. mean traction force in individual cells for control and oleate-treated cells. (D) Schematic of chemomechanical model of lipid droplet cytoskeletal interactions in the generation of traction forces. Adapts previously published model (45) and adds lipid droplet growth in the cytoplasm. (E) Visualization of lipid droplet–associated nuclear deformation predicted by our mathematical model. (F) Visualization and (G) quantification of reduced traction forces in lipid-loaded cells as predicted by our mathematical model. Statistics: (A and B) Data are mean ± SE of n = 3 independent experiments. P values were calculated using two-way ANOVA with multiple comparisons. (C) Data are individual cells from n = 3 independent experiments. P value was calculated with an F test.
Fig. 6.
Fig. 6.
Altering contractility modulates HNF4α expression. (A) Nuclear area, (B) YZ cross-sectional nuclear aspect ratio, (C) nuclear irregularity, (D) mean nuclear HNF4α intensity (normalized to control on soft), and (E) chromatin condensation parameter in control and oleate-treated cells with or without addition of cytoskeletal drugs on soft PAA. Blebbistatin (Bleb), latrunculin A (Lat), and nocodazole (Noc). (F) Representative images of HNF4α staining in wild-type and ob/ob mouse liver tissues. DAPI (blue) and HNF4α (white). Scale bar is 50 μm and is the same for all images. (G) Nuclear area, (H) nuclear irregularity, and (I) mean nuclear HNF4α intensity (normalized to wild type) of all cells in wild-type and ob/ob mouse livers. (J) Mean nuclear HNF4α intensity (normalized to wild type) of hepatocytes (gated based on HNF4α intensity) in wild-type and ob/ob mouse livers. (K) Scatterplot with linear regression of nuclear irregularity vs. mean HNF4α intensity of hepatocytes from wild-type and ob/ob mouse livers. Statistics: (AE) Data are mean ± SE of n = 3 for each drug treatment and n = 8 for the untreated. P values were calculated using two-way ANOVA that applied a main effects model with multiple comparisons. Colored significance values indicate changes due to cytoskeletal drugs, while black significance values are due to lipid loading within a drug treatment group. (GJ) Data are mean ± SE of n = 3 animals. P values were calculated with a two-way ANOVA using a main effects model. (K) P values were calculated with an F test.

Similar articles

Cited by

References

    1. Paik J. M., Golabi P., Younossi Y., Mishra A., Younossi Z. M., Changes in the global burden of chronic liver diseases from 2012 to 2017: The growing impact of NAFLD. Hepatology 72, 1605–1616 (2020). - PubMed
    1. Farrell A., Ryan M., Howell J., Epidemiology of non-alcoholic fatty liver disease-related hepatocellular carcinoma: A western perspective. Hepatoma Res. 6, 18 (2020).
    1. Villanueva A., Hepatocellular carcinoma. N. Engl. J. Med. 380, 1450–1462 (2019). - PubMed
    1. Zhang D. Y., Friedman S. L., Fibrosis-dependent mechanisms of hepatocarcinogenesis. Hepatology 56, 769–775 (2012). - PMC - PubMed
    1. Nahon P., et al. , Liver stiffness measurement in patients with cirrhosis and hepatocellular carcinoma: A case-control study. Eur. J. Gastroenterol. Hepatol. 21, 214–219 (2009). - PubMed

Publication types

MeSH terms