. 2023 Jun:62:102697.
doi: 10.1016/j.redox.2023.102697. Epub 2023 Apr 6.

Acetylated tau exacerbates learning and memory impairment by disturbing with mitochondrial homeostasis

Affiliations

Acetylated tau exacerbates learning and memory impairment by disturbing with mitochondrial homeostasis

Qian Liu et al. Redox Biol. 2023 Jun.

Abstract

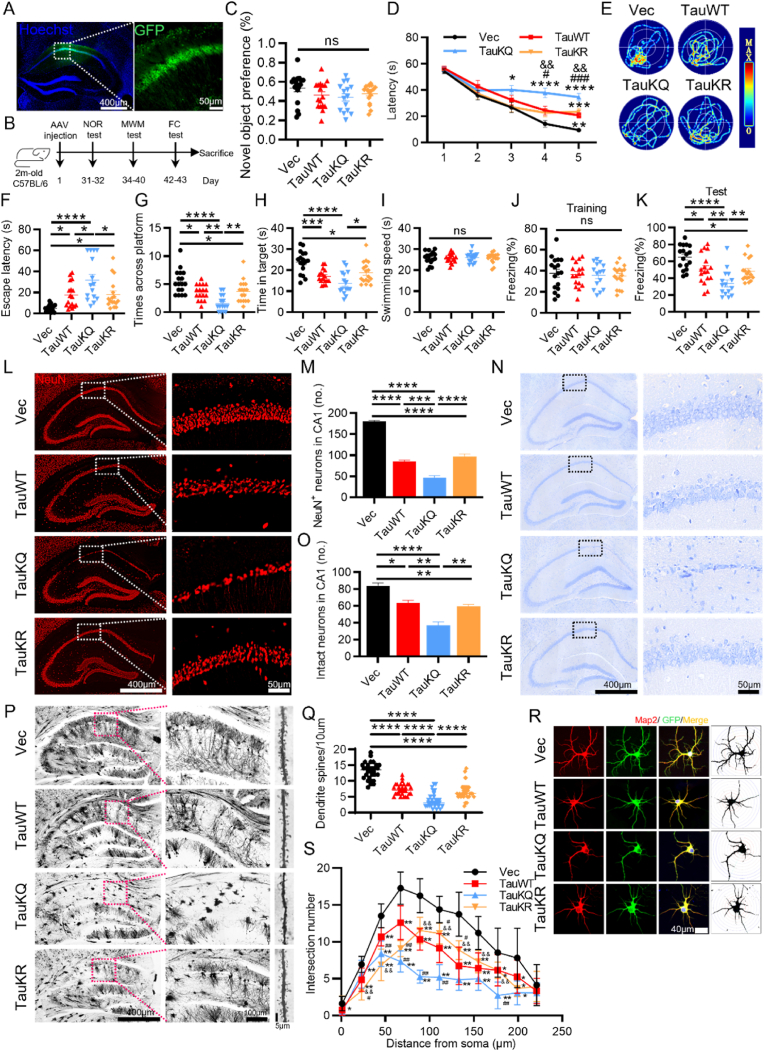
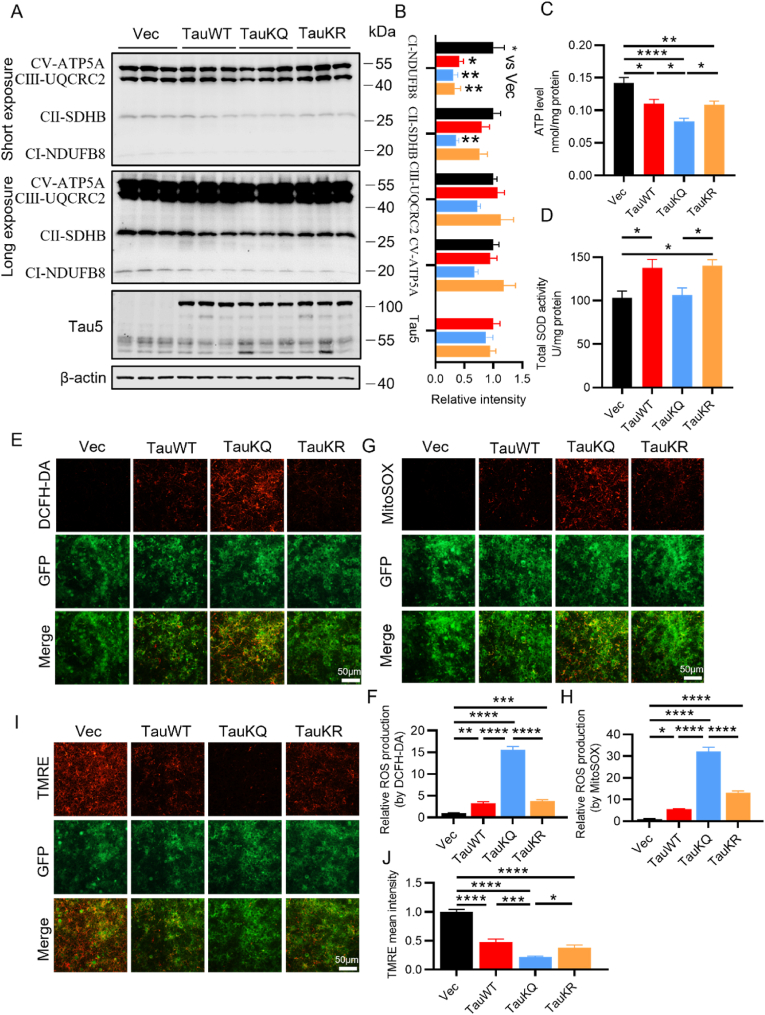
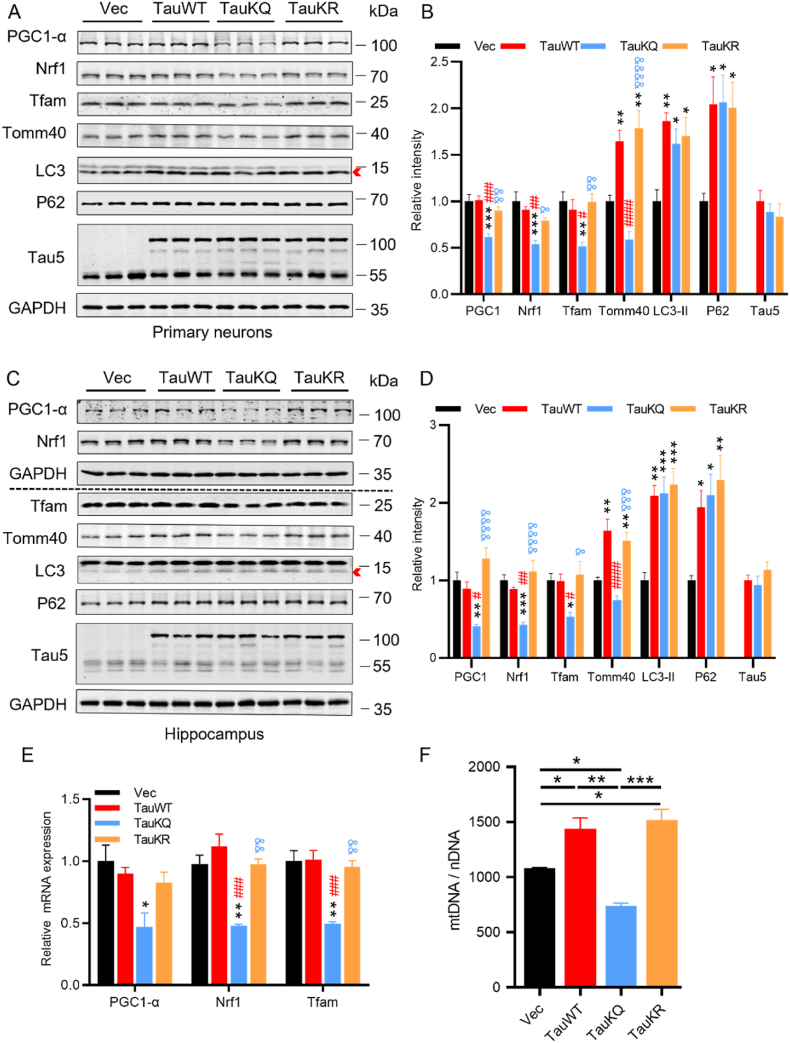
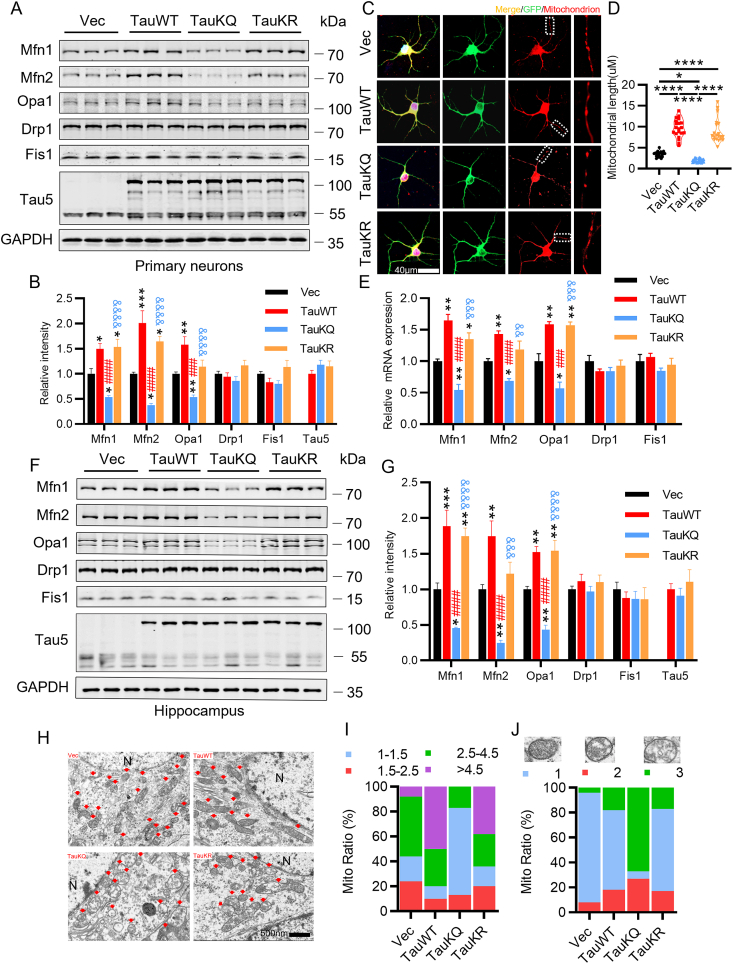
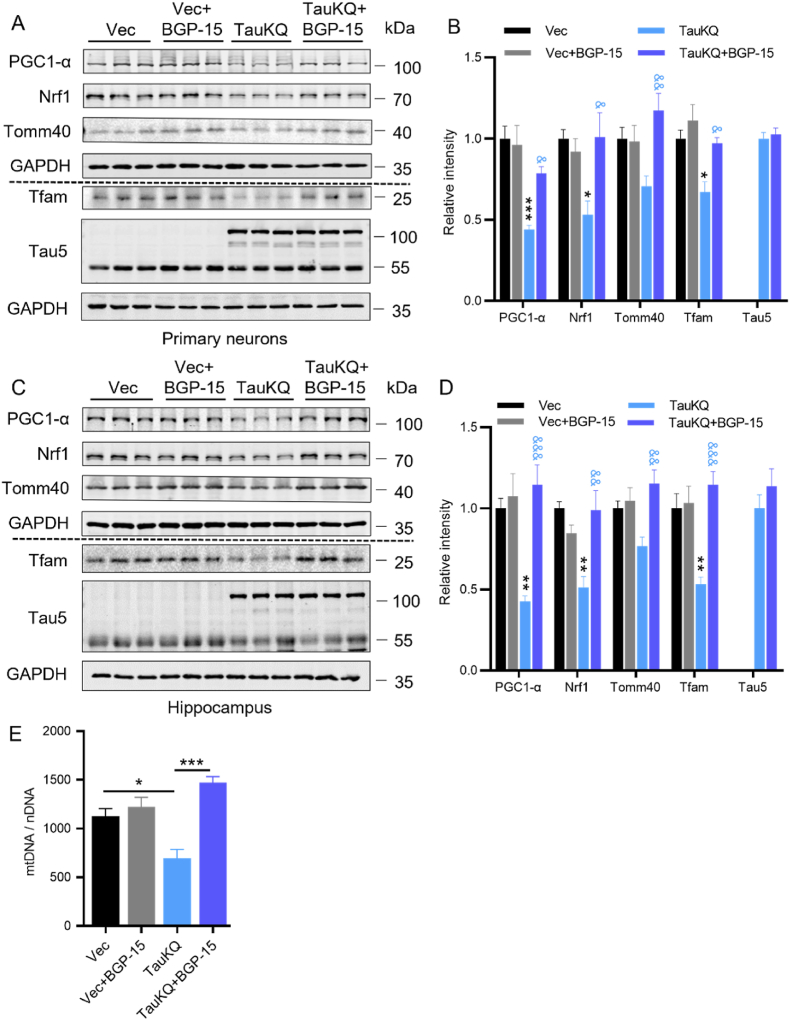
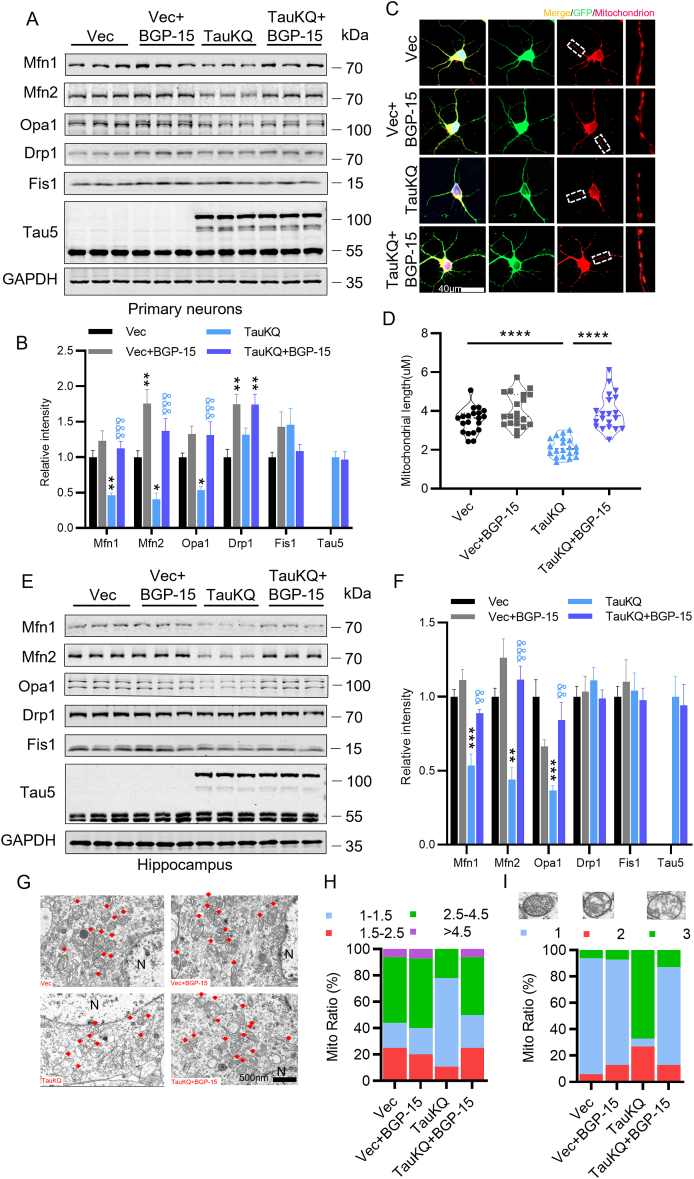
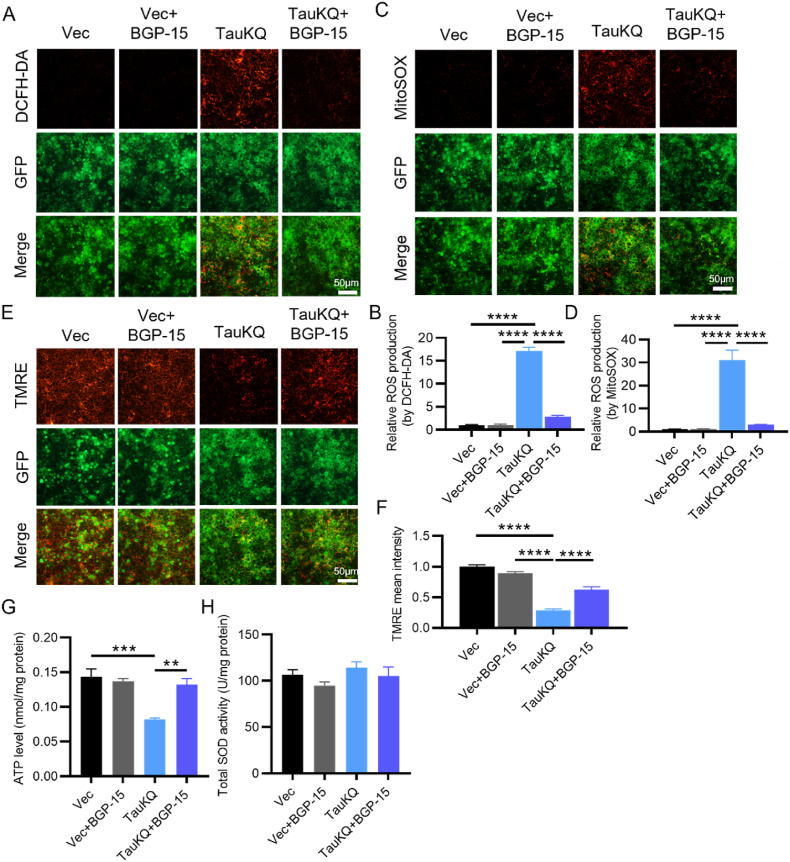
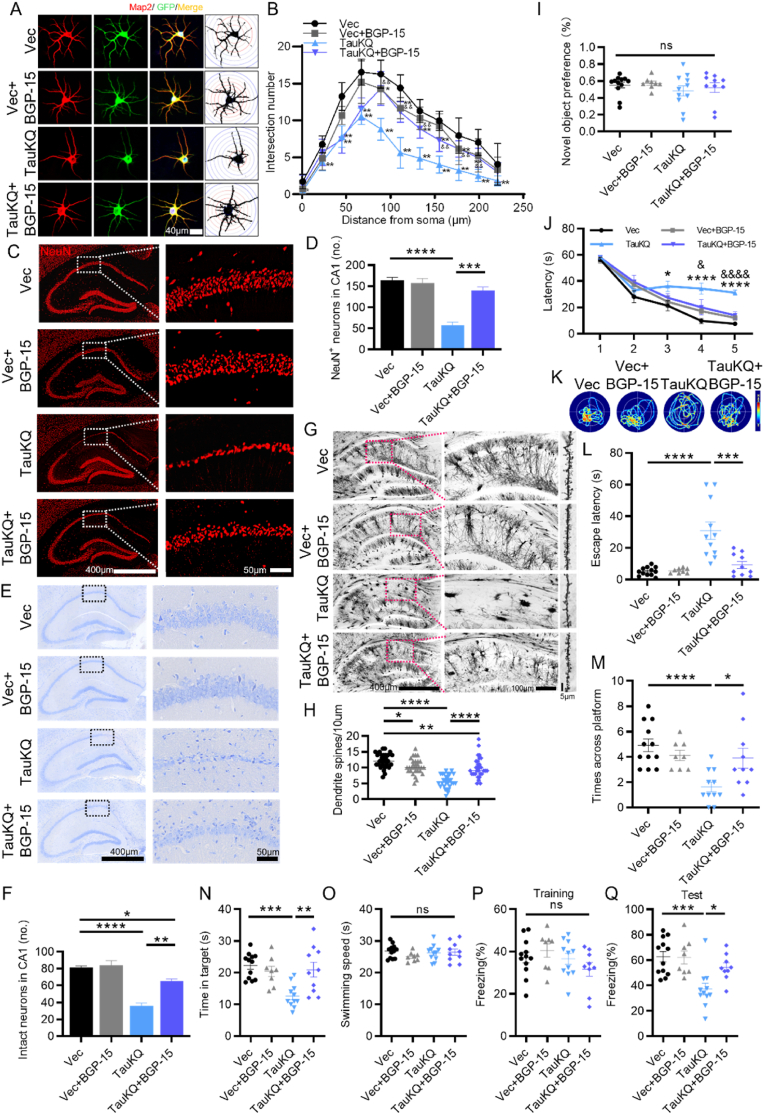
Increased tau acetylation at K274 and K281 has been observed in the brains of Alzheimer's disease (AD) patients and animal models, and mitochondrial dysfunction are noticeable and early features of AD. However, the effect of acetylated tau on mitochondria has been unclear until now. Here, we constructed three type of tau forms, acetylated tau mutant by mutating its K274/K281 into Glutamine (TauKQ) to mimic disease-associated lysine acetylation, the non-acetylation tau mutant by mutating its K274/K281 into Arginine (TauKR) and the wild-type human full-length tau (TauWT). By overexpression of these tau forms in vivo and in vitro, we found that, TauKQ induced more severe cognitive deficits with neuronal loss, dendritic plasticity damage and mitochondrial dysfunctions than TauWT. Unlike TauWT induced mitochondria fusion, TauKQ not only induced mitochondria fission by decreasing mitofusion proteins, but also inhibited mitochondrial biogenesis via reduction of PGC-1a/Nrf1/Tfam levels. TauKR had no significant difference in the cognitive and mitochondrial abnormalities compared with TauWT. Treatment with BGP-15 rescued impaired learning and memory by attenuation of mitochondrial dysfunction, neuronal loss and dendritic complexity damage, which caused by TauKQ. Our data suggested that, acetylation at K274/281 was an important post translational modification site for tau neurotoxicity, and BGP-15 is a potential therapeutic drug for AD.

Keywords: Acetylation; Alzheimer's disease; Dynamic homeostasis; Mitochondria biogenesis; Tau.


Conflict of interest statement

Declaration of competing interest We all authors stated that we have no conflicts of interest. Qian Liu, Xin Wang, Yu Hu, Jun-Ning Zhao, Chun-Hui Huang, Ting Li, Bing-Ge Zhang, Ye He, Yan-Qing Wu, Zai-Jun Zhang, Guo-Ping Wang, Gong-Ping Liu.

Figures

Fig. 1
Fig. 1
Overexpressing TauKQ exacerbated cognitive impairments with neuronal loss, reduced dendritic spines, and decreased neuronal dendritic complexity. (A–K) The virus constructs including AAV-hSyn-EGFP-tau (wild-type total human tau441)-3flag (TauWT), acetylation mimic tau mutant AAV-hSyn-EGFP-tau (Lys mutated to Gln at K274 and K281)-3flag (TauKQ), the acetylablation mimic tau mutant AAV-hSyn-EGFP-tau (Lys mutated to Arg at K274 and K281)-3flag (TauKR), or the empty vector, AAV-hSyn-EGFP-MCS-3flag (Vec) were infused respectively into the hippocampal CA1 subset of 2-month-old C57 mice for one month, respectively, and then the behavior tests were carried out. (A) The expression of virus was confirmed by immunofluorescence image. (B) Experimental processes of virus injection and paradigms used for testing the cognition: NOR: Novel object recognition, MWM: Morris water maze, FC: Fear conditioning. (C) Overexpressing three tau forms in hippocampal CA1 for one month have no significant difference of novel object recognition preference (n = 15–17 mice each group). (D) During 5 days learning test by MWM, mice of TauWT, TauKQ or TauKR group showed increased latency to find the hidden platform, and the degree was more significant in mice of TaukQ than TauWT or TauKR group (n = 15–17 mice each group). (E) Representative swimming path of mice in each group during the MWM probe test. (F–I) Overexpressing all three types of tau in hippocampal CA1 for one month significantly impaired spatial memory during probe trial carried out at day 7 by removing the platform, shown as the increased latency to reach the site where the platform put before (F), the decreased crosses in the previous platform area (G) and the decreased time stayed in the target quadrant (H). No significant difference in swimming speed among four groups (I) (n = 15–17 mice each group). (J, K) In Fear conditioning (FC) test, overexpressing three tau forms in hippocampal CA1 for one month showed decreased freezing time at second day compared with the empty vector controls, the decrease was more significant in mice of TauKQ than TauWT or TauKR group (n = 15–17 mice each group). (L, M) Representative images of NeuN immunofluorescence staining (L), and the quantitative analysis (M) (n = 3 from three independent experiments). (N, O) Representative images of Nissl staining (N), and the quantitative analysis. Neurons with visible nuclei, distinctive nucleolus, and cytoplasmic Nissl staining were regarded as intact neurons and counted (O) (n = 3 from three independent experiments). (P, Q) Representative images of Golgi Staining in the hippocampus of mice (P). Quantitative analysis of spine density in the CA1 subset of mice. 30 neurons from three mice per group were analyzed. (R, S) The primary cultured hippocampal neurons were infected with the lenti-TauWT, lenti- TauKQ, lenti-TauKR, or lenti-vector-EGFP (Vec) at 2 div (days in vitro). Neurons were stained using anti-MAP2 antibody and the dendrite complexity was analyzed at 8 div. The representative images show changed dendrite complexity by overexpressing all three types of tau in cultured hippocampal neurons at 8 div (R). Sholl analyses of the numbers of dendritic crossings in hippocampal neurons (S). 15 neurons from six independent cultures were analyzed for each group. All data were presented as mean ± SEM. Two-way repeated measures ANOVA test followed by Tukey's post hoc test for D and S, and One-way ANOVA test followed by Tukey's post hoc test for others. D and S: *, p < 0.05, **, p < 0.01, ***, p < 0.001, ****, p < 0.0001, vs Vec; #, p < 0.05, ##, p < 0.01, ###, p < 0.001, vs TauWT; &&, p < 0.01, vs TauKQ. Others: *, p < 0.05, **, p < 0.01, ***, p < 0.001, ****, p < 0.0001.
Fig. 2
Fig. 2
Overexpressing TauKQ exacerbated mitochondrial dysfunctions. (A, B) The expression levels of mitochondrial respiratory complex I (NDUFB8), II (SDHB), III (UQCRC2), V (ATP5A) protein and total Tau (Tau5) were detected by Western blotting (A) and quantitative analysis (B) (n = 6 biological replicates each group). (C) The change of ATP level in four groups of mice (n = 5 biological replicates each group). (D) The change of total SOD activity in four groups of mice (n = 6 biological replicates each group). (E, F) The primary cultured hippocampal neurons were infected with the lenti-TauWT, lenti-TauKQ, lenti-TauKR, or lenti-vector-EGFP (Vec) at 2 div, stained with DCFH-DA (red) at 8 div. The image showing the intracellular ROS levels after the indicated treatments (E), and the quantification of relative ROS level (red) (F) (n = 6 each group). (G, H) The primary cultured hippocampal neurons were infected with the lenti-TauWT, lenti-TauKQ, lenti-TauKR, or lenti-vector-EGFP (Vec) at 2 div, stained with MitoSOX (red) at 8 div. The image showing the mitochondrial ROS levels after the indicated treatments (G), and the quantification of relative ROS level (red) (H) (n = 6 each group). (I, J) The primary cultured hippocampal neurons were infected with the lenti-TauWT, lenti-TauKQ, lenti-TauKR, or lenti-vector-EGFP (Vec) at 2 div, stained with TMRE (red) at 8 div. The image showing the mitochondrial membrane potential (MMP) in neurons with indicated treatments (I), and the quantification of relative MMP level (red) (J) (n = 6 each group). All data were presented as mean ± SEM. One-way ANOVA test followed by Tukey's post hoc test. *, p < 0.05, **, p < 0.01, ***, p < 0.001, ****, p < 0.0001. (For interpretation of the references to colour in this figure legend, the reader is referred to the Web version of this article.)
Fig. 3
Fig. 3
Overexpressing TauKQ attenuated mitochondrial biogenesis. (A, B) The expression levels of mitochondrial biogenesis pathway proteins, such as PGC-1α, Nrf1 and Tfam, autophagy-related proteins p62, LC3, the mitochondrial outer membrane protein Tomm40, and total Tau (Tau5) were detected by Western blotting (A) and quantitative analysis (B) in primary cultured hippocampal neurons with expression of all three types of tau lentivirus. For the quantification of LC3, we used LC3-II, the band marked by the arrow (n = 6 biological replicates each group). (C, D) The protein expression levels of PGC-1α, Nrf1, Tfam, Tomm40, LC3, P62 and total Tau (Tau5) were detected by Western blotting (C) and quantitative analysis (D) in hippocampal CA1 extracts of the three types of tau overexpressing mice. For the quantification of LC3, we used LC3-II, the band marked by the arrow (n = 6 biological replicates each group). (E) The mRNA expression levels of PGC-1α, Nrf1, and Tfam were detected by qRT–PCR in the hippocampal CA1 of the three types of tau overexpressing mice. The fold change was normalized with the loading control GAPDH and expressed relative to the Vec group (n = 3–5 each group). (F) The change of relative mtDNA copy number (mtDNA/nDNA) in hippocampal CA1 of the four groups mice detected by qRT-PCR (n = 3 each group). All data were presented as mean ± SEM. One-way ANOVA test followed by Tukey's post hoc test. B, D and E: *, p < 0.05, **, p < 0.01, ***, p < 0.001, vs Vec; #, p < 0.05, ##, p < 0.01, ###, p < 0.001, ####, p < 0.0001, vs TauWT; &, p < 0.05, &&, p < 0.01, &&&, p < 0.001, &&&&, p < 0.0001, vs TauKQ. F: *, p < 0.05, **, p < 0.01, ***, p < 0.001.
Fig. 4
Fig. 4
Overexpression of TauKQ disrupted mitochondrial dynamics by reducing mitochondrial fusion. (A, B) The expression levels of mitochondrial dynamic proteins were detected by Western blotting (A) and quantitative analysis (B) in primary cultured hippocampal neurons with expression of three types of tau lentivirus (n = 6 biological replicates each group). (C, D) The primary cultured hippocampal neurons were infected with three types of tau lentivirus at 2 div. Mitochondria were labeled by MitoTracker Red at 8 div. The representative images were shown (C). The mitochondrial length (counted in the neuronal processes 100–200 μm away from the cell body) were measured and quantified (D). 15–20 neurons from six independent cultures were analyzed for each group. (E) Overexpression of three types of tau changed the mRNA levels of Mfn1, Mfn2, and Opa1 in the hippocampal CA1 detected by qRT-PCR (n = 3 each group). (F, G) Overexpression of three types of tau changed the protein levels of Mfn1, Mfn2, and Opa1 in the hippocampal CA1, detected by Western blotting (n = 6 biological replicates each group). (H–J) Overexpression of three types of tau changed the mitochondrial morphology detected by electron microscopy in the hippocampal CA1 subset. Typical mitochondrial images were presented (H). N, nucleus; arrow, mitochondria. The morphology of mitochondria was divided into four categories based on the value of mitochondria length/diameter (L/D), and the proportion of each category is shown (I). The mitochondria were divided into three categories based on the cristae morphology (blue, intact; red, a slight loss of cristae; and green, a severe loss of cristae). The proportion of each type of mitochondria is shown (J). At least 100 mitochondria from three mice per group were analyzed. All data were presented as mean ± SEM. One-way ANOVA test followed by Tukey's post hoc test. B, E and G: *, p < 0.05, **, p < 0.01, ***, p < 0.001, vs Vec; ###, p < 0.001, ####, p < 0.0001, vs TauWT; &&, p < 0.01, &&&, p < 0.001, &&&&, p < 0.0001, vs TauKQ. D: *, p < 0.05, ****, p < 0.0001. (For interpretation of the references to colour in this figure legend, the reader is referred to the Web version of this article.)
Fig. 5
Fig. 5
BGP-15 rescued TauKQ-induced reduction in mitochondrial biogenesis. (A, B) BGP-15 rescued TauKQ-induced reduction in PGC1-α/Nrf1/Tfam in primary cultured hippocampal neurons. After infected with the lenti-tau (Lys mutated to Gln at K274 and K281)-EGFP (TauKQ)at 2 div, the primary cultured hippocampal neurons were treated with 10 μM BGP-15 at 3 div for 5 d, half-change the culture medium every other day until sample collection at 8 div. The expression levels of PGC-1α, Nrf1, Tfam, Tomm40 and total Tau (Tau5) were detected by Western blotting (A) and quantitative analysis (B) (n = 6 biological replicates each group). (C, D) BGP-15 rescued TauKQ-induced reduction in PGC1-α/Nrf1/Tfam in the hippocampal CA1 subset. The virus constructs including AAV-hSyn-EGFP-tau (Lys mutated to Gln at K274 and K281)-3flag (TauKQ) was infused into the hippocampal CA1 subset of 2-month-old C57 mice for 20 d, followed by daily oral BGP-15 (28 mg/kg) for 10 d. The expression levels of PGC-1α, Nrf1, Tfam, Tomm40 and total Tau (Tau5) were detected by Western blotting (C) and quantitative analysis (D) (n = 6 biological replicates each group). (E) BGP-15 increased mtDNA copy number (mtDNA/nDNA) in the hippocampal CA1 subset of TauKQ-expressing mice. The relative mtDNA copy number detected by qRT-PCR (n = 3 each group). All data were presented as mean ± SEM. One-way ANOVA test followed by Tukey's post hoc test. B and D: *, p < 0.05, **, p < 0.01, ***, p < 0.001, vs Vec; &, p < 0.05, &&, p < 0.01, &&&, p < 0.001, vs TauKQ. E: *, p < 0.05, ***, p < 0.001.
Fig. 6
Fig. 6
BGP-15 reversed TauKQ-induced mitochondrial dynamic imbalance. (A, B) BGP-15 rescued TauKQ-induced reduction of mitochondrial fusion-associated proteins in primary hippocampal neurons. The expression levels of Mfn1, Mfn2, Opa1, Drp1, Fis1 and total Tau (Tau5) were detected by Western blotting (A) and quantitative analysis (B) (n = 6 biological replicates each group). (C, D) BGP-15 rescued TauKQ-induced mitochondrial fragmentation in primary hippocampal neurons. The representative images were shown (C). The mitochondrial length (counted in the neuronal processes 100–200 μm away from the cell body) were measured and quantified (D). 15–20 neurons from six independent cultures were analyzed for each group. (E, F) BGP-15 rescued TauKQ-induced reduction of mitochondrial fusion-associated proteins in the hippocampal CA1 subset. The expression levels of Mfn1, Mfn2, Opa1, Drp1, and Fis1 and total Tau (Tau5) were detected by Western blotting (E) and quantitative analysis (F) (n = 6 biological replicates each group). (G–I) BGP-15 treatment ameliorated the mitochondrial morphology in the hippocampal CA1 neurons of C57 mice detected by electron microscopy. Typical mitochondrial images were presented (G). N, nucleus; arrow, mitochondria. The morphology of mitochondria was divided into four categories based on the value of mitochondria length/diameter (L/D). The proportion of each category is shown (H). The mitochondria were divided into three categories based on the cristae morphology (blue, intact; red, a slight loss of cristae; and green, a severe loss of cristae). The proportion of each type of mitochondria inside the neurons of hippocampal CA1 is shown (I). At least 100 mitochondria from three mice per group were analyzed. All data were presented as mean ± SEM. One-way ANOVA test followed by Tukey's post hoc test. B and F: *, p < 0.05, **, p < 0.01, ***, p < 0.001, vs Vec; &&, p < 0.01, &&&, p < 0.001, vs TauKQ. D: ****, p < 0.0001. (For interpretation of the references to colour in this figure legend, the reader is referred to the Web version of this article.)
Fig. 7
Fig. 7
BGP-15 ameliorated TauKQ-induced mitochondrial dysfunctions. (A, B) BGP-15 decreased TauKQ-induced intracellular ROS level in primary hippocampal neurons. The present image showing the intracellular ROS levels (red) in primary neurons after the indicated treatments (A). The quantification of relative intracellular ROS generation (B) (n = 6 each group). (C, D) BGP-15 decreased TauKQ-induced mitochondrial ROS level in primary hippocampal neurons. The present image showing the mitochondrial ROS levels (red) in primary neurons after the indicated treatments (C). The quantification of relative mitochondrial ROS generation (D) (n = 6 each group). (E, F) BGP-15 prevented TauKQ-induced MMP (red) reduction in primary hippocampal neurons. The representative image after indicated treatments (E). The quantification of relative MMP (F) (n = 6 each group). (G) BGP-15 treatment reversed the decreased ATP levels in TauKQ-expressing mice (n = 4–5 biological replicates each group). (H) BGP-15 treatment did not affect the total SOD activity (n = 5 biological replicates each group). All data were presented as mean ± SEM. One-way ANOVA test followed by Tukey's post hoc test. **, p < 0.01, ***, p < 0.001, ****, p < 0.0001. (For interpretation of the references to colour in this figure legend, the reader is referred to the Web version of this article.)
Fig. 8
Fig. 8
BGP-15 ameliorated TauKQ-induced learning and memory impairments, with rescuing neuronal loss and dendritic spine reduction, and increasing neuronal dendritic complexity. (A, B) The primary cultured hippocampal neurons were infected with the lenti-tau (Lys mutated to Gln at K274 and K281)-EGFP (TauKQ) at 2 div, and thus treated with 10 μM BGP-15 at 3 div. Neurons were stained using anti-MAP2 at 8 div and the dendrite complexity was analyzed. The representative images of dendrite complexity (A). Sholl analyses showed that the number of dendrite crossings was reduced by overexpressing TauKQ, and BGP-15 reversed the reduction (B). 20 neurons from six independent cultures were analyzed for each group. (C, D) BGP-15 ameliorated hippocampal CA1 neuronal loss in TauKQ-expressing mice, exhibited by representative images of NeuN immunofluorescence staining (C). Quantitative analysis for the number of neurons with NeuN staining in area framed within white bordered rectangle (D) (n = 3 from three independent experiments). (E, F) Representative images of Nissl staining (E), and quantitative analysis (F) (n = 3 from three independent experiments). (G, H) Representative images of Golgi Staining in the hippocampal of mice (G), and quantitative analysis of spine density in the CA1 area of mice (H). 30 neurons from three mice per group were analyzed. (I–Q) The AAV-TauKQ were infused respectively into the hippocampal CA1 subset of 2-month-old C57 mice for 20 d, followed treatment with BGP-15 (28 mg/kg/d) by gavage for 10 d. (I) There was no significant difference of novel object recognition preference among the four groups mice detected by NOR test (n = 8–12 mice each group). (J) BGP-15 improved learning ability in TauKQ mice shown by shortened latency to find the hidden platform during training stage in the MMW test (n = 8–12 mice each group). (K) Representative swimming path of mice in each group during the MWM probe test. (L–O) BGP-15 improved memory ability of TauKQ mice shown as the decreased latency to reach the location of platform placed before (L), the increased crosses in the previous platform area (M) and the increased time stayed in the target quadrant (N) during the MWM probe test. No significant difference in swimming speed among the four groups during the MWM probe test (O) (n = 8–12 mice each group). (P, Q) In FC test, BGP-15 improved fear memory in TauKQ mice shown by increased freezing time at second day (n = 8–12 mice each group). All data were presented as mean ± SEM. Two-way repeated measures ANOVA test followed by Tukey's post hoc test for B and J, and One-way ANOVA test followed by Tukey's post hoc test for others. B and J: *, p < 0.05, **, p < 0.01, ****, p < 0.0001, vs Vec; &, p < 0.05, &&, p < 0.01, &&&&, p < 0.0001, vs TauKQ. Others: *, p < 0.05, **, p < 0.01, ***, p < 0.001, ****, p < 0.0001.

References

    1. Epelbaum S., Genthon R., Cavedo E., Habert M.O., Lamari F., Gagliardi G., Lista S., Teichmann M., Bakardjian H., Hampel H., Dubois B. Preclinical Alzheimer's disease: a systematic review of the cohorts underlying the concept. Alzheimers Dement. 2017;13:454–467. - PubMed
    1. Holtzman D.M., Carrillo M.C., Hendrix J.A., Bain L.J., Catafau A.M., Gault L.M., Goedert M., Mandelkow E., Mandelkow E.M., Miller D.S., Ostrowitzki S., Polydoro M., Smith S., Wittmann M., Tau Hutton M. From research to clinical development. Alzheimers Dement. 2016;12:1033–1039. - PubMed
    1. Mair W., Muntel J., Tepper K., Tang S., Biernat J., Seeley W.W., Kosik K.S., Mandelkow E., Steen H., Steen J.A. FLEXITau: quantifying post-translational modifications of tau protein in vitro and in human disease. Anal. Chem. 2016;88:3704–3714. - PMC - PubMed
    1. Zheng J., Tian N., Liu F., Zhang Y., Su J., Gao Y., Deng M., Wei L., Ye J., Li H., Wang J.Z. A novel dephosphorylation targeting chimera selectively promoting tau removal in tauopathies. Signal Transduct. Targeted Ther. 2021;6:269. - PMC - PubMed
    1. Zheng J., Li H.L., Tian N., Liu F., Wang L., Yin Y., Yue L., Ma L., Wan Y., Wang J.Z. Interneuron accumulation of phosphorylated tau impairs adult hippocampal neurogenesis by suppressing GABAergic transmission. Cell Stem Cell. 2020;26:331–345 e336. - PubMed

Publication types

LinkOut - more resources