. 2023 Jun;193(6):778-795.
doi: 10.1016/j.ajpath.2023.02.020. Epub 2023 Apr 8.

Identification of Spatial Proteomic Signatures of Colon Tumor Metastasis: A Digital Spatial Profiling Approach

Affiliations

Identification of Spatial Proteomic Signatures of Colon Tumor Metastasis: A Digital Spatial Profiling Approach

Joshua J Levy et al. Am J Pathol. 2023 Jun.

Abstract

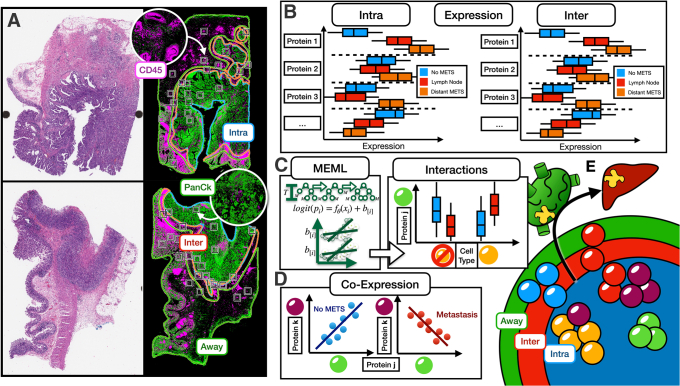
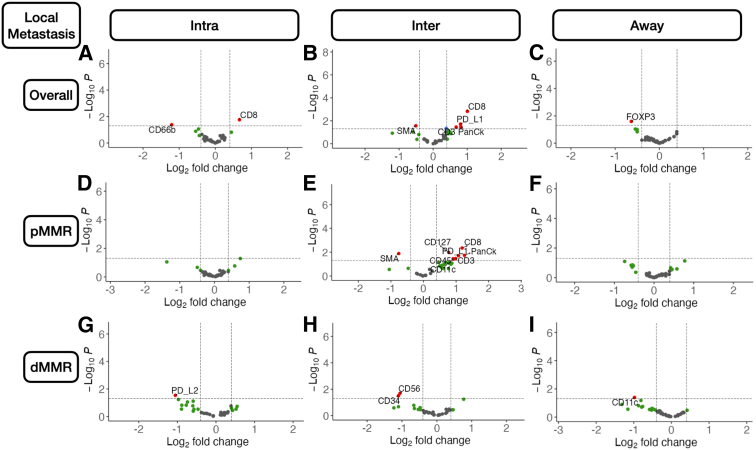
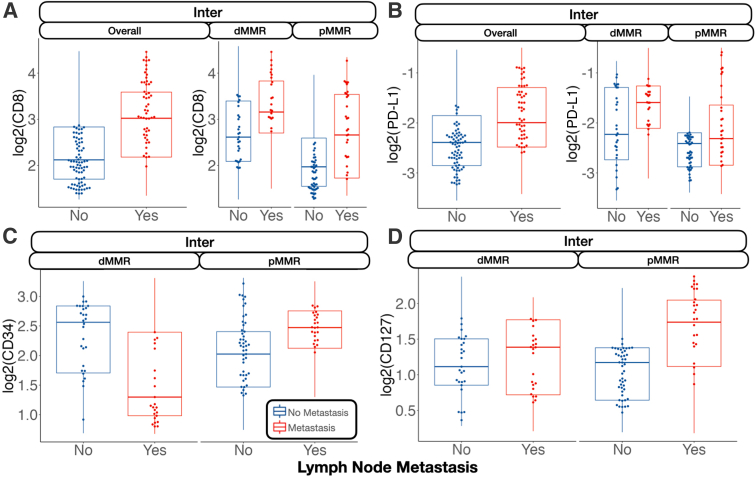
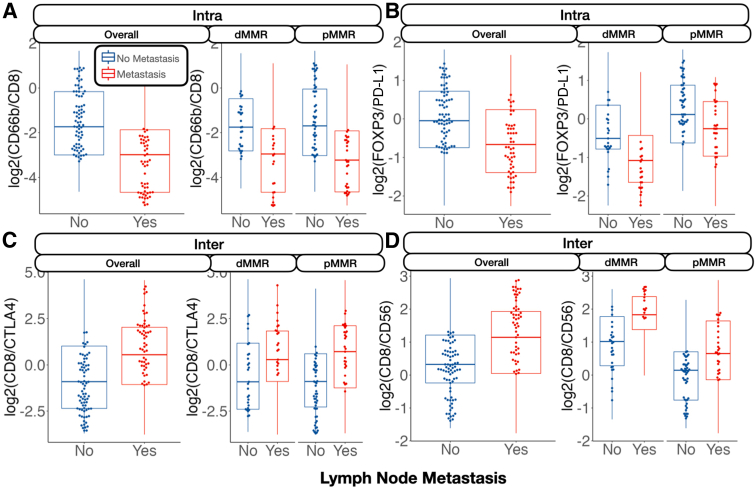
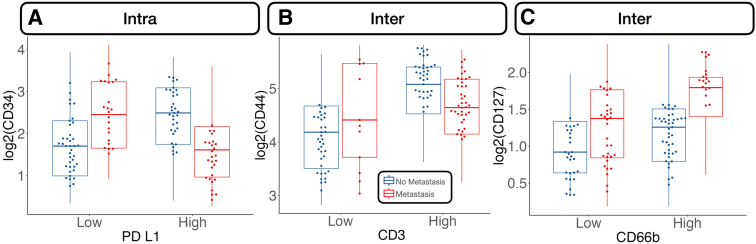
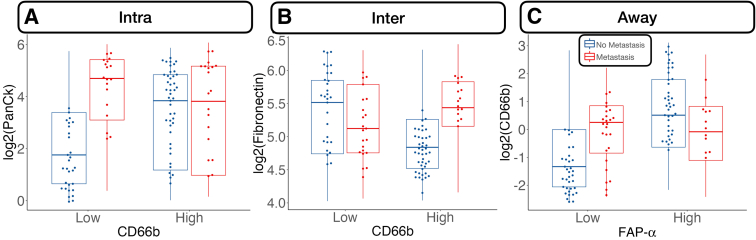
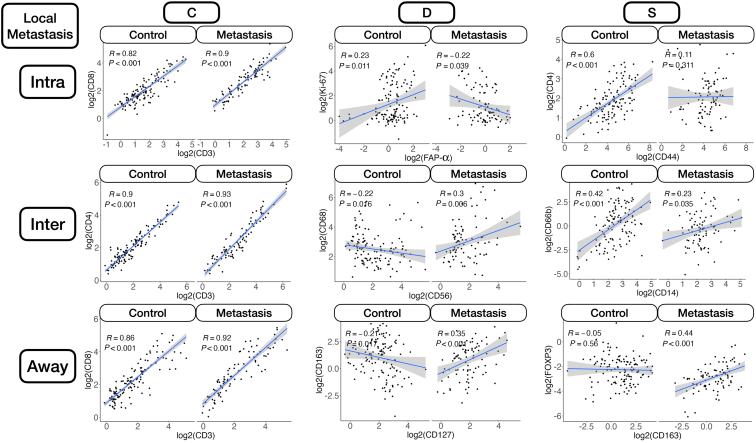
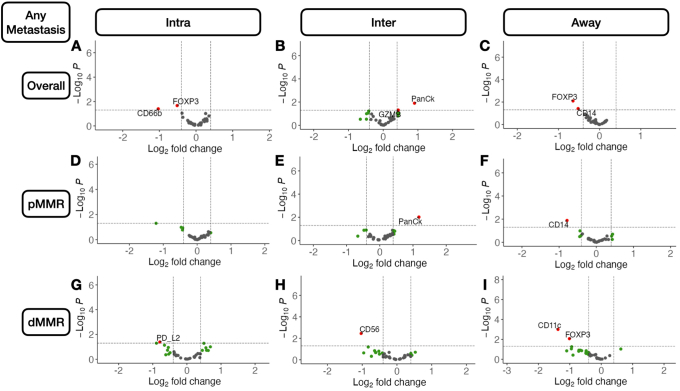
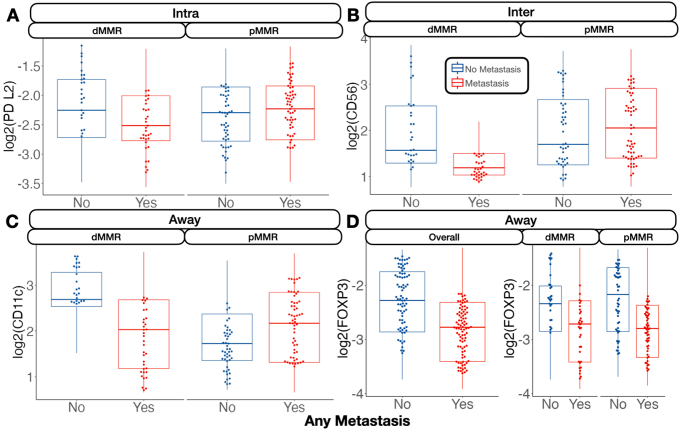
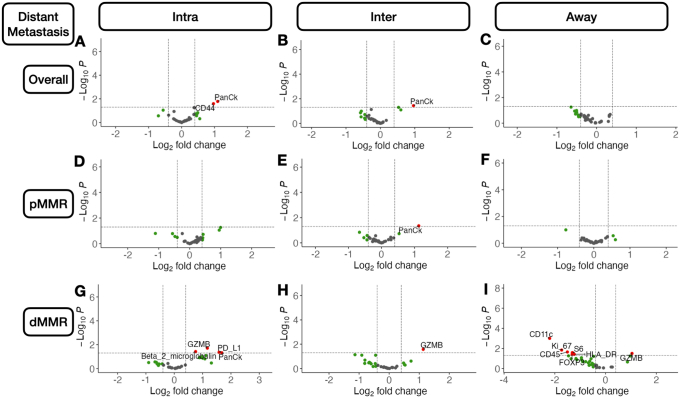
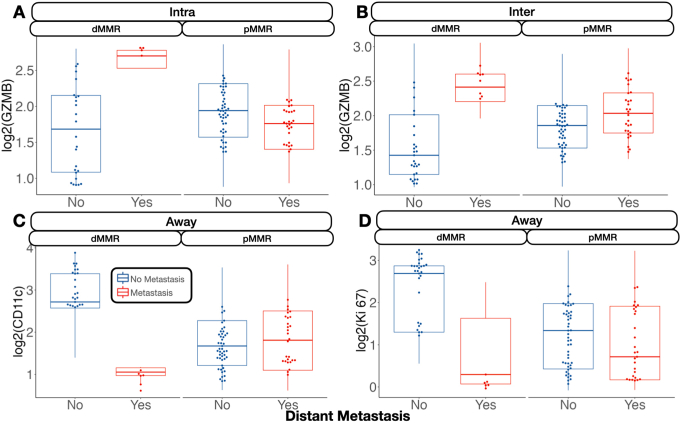
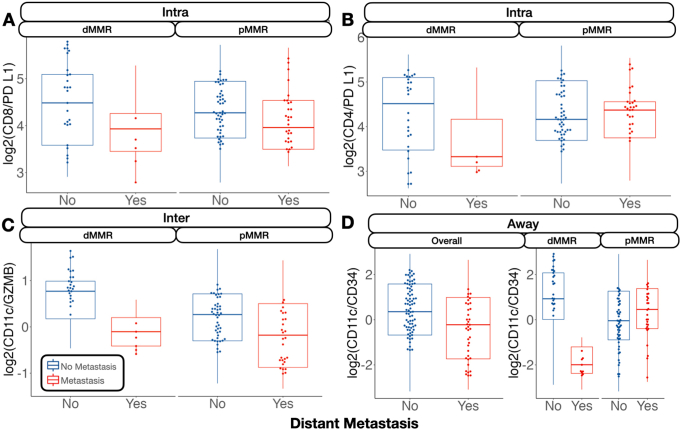
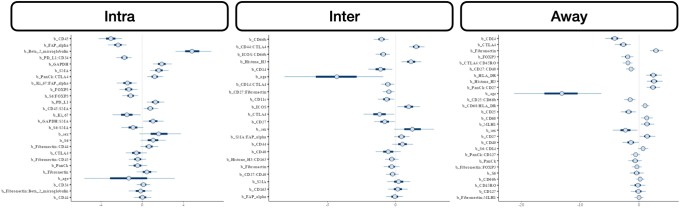
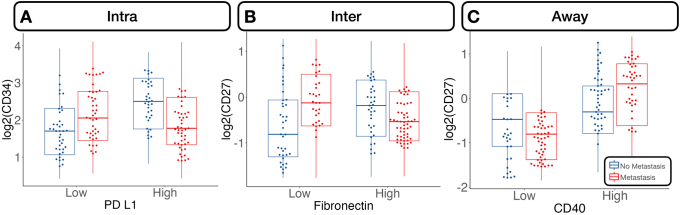
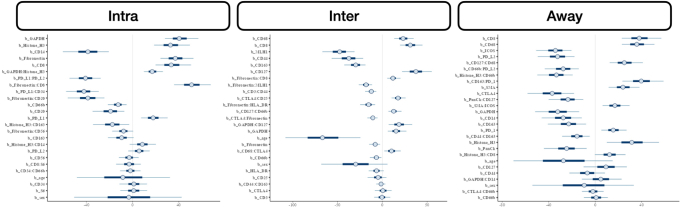
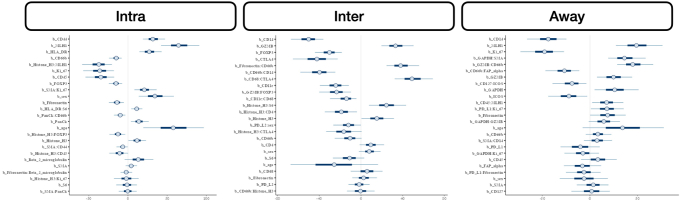
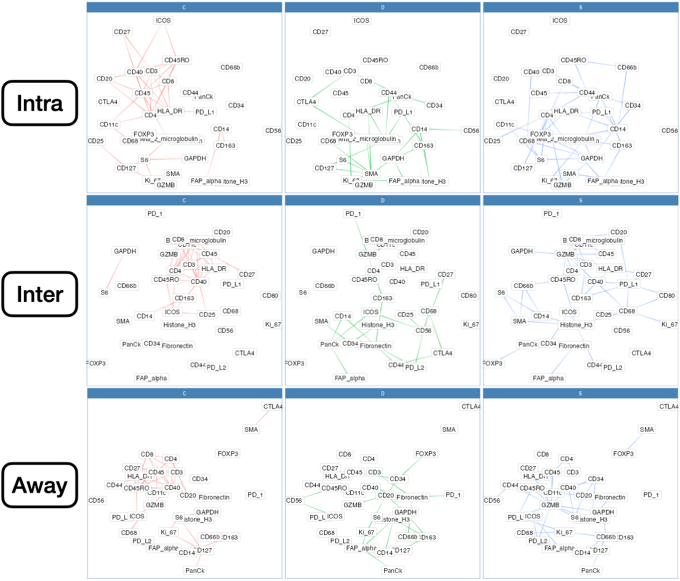
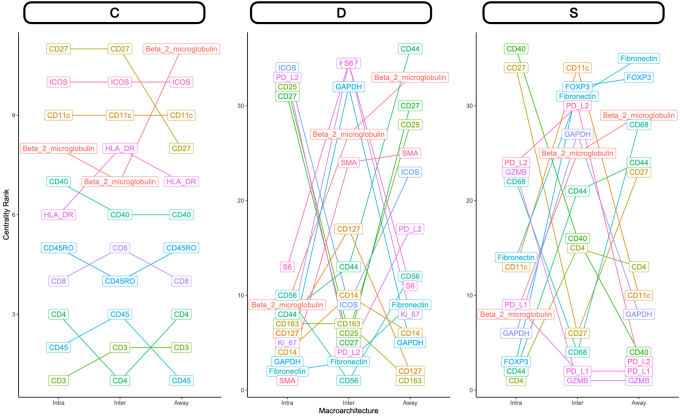
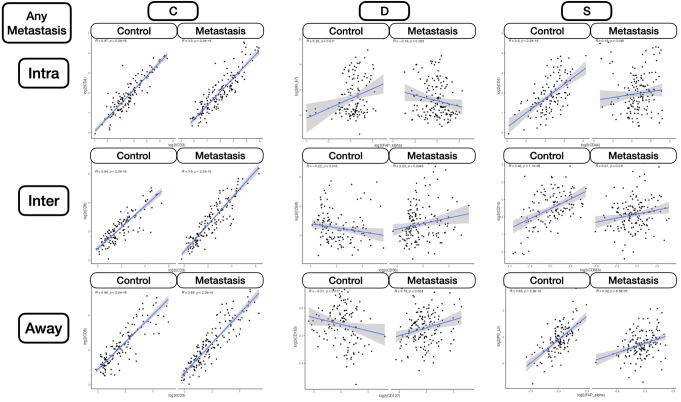
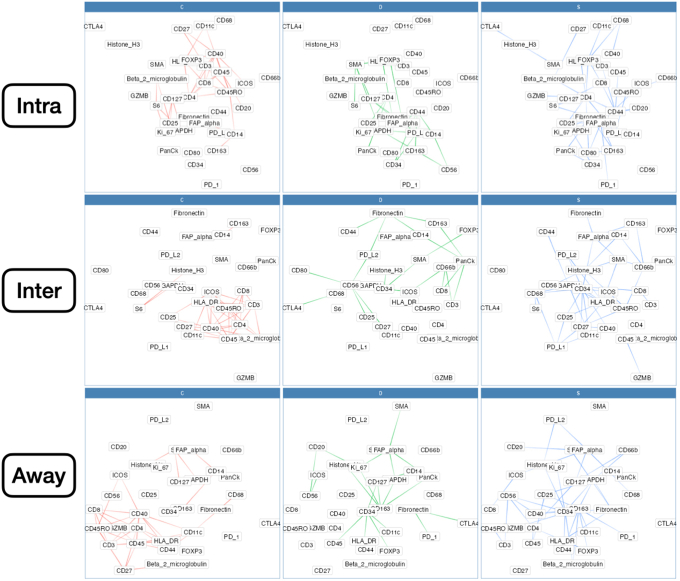
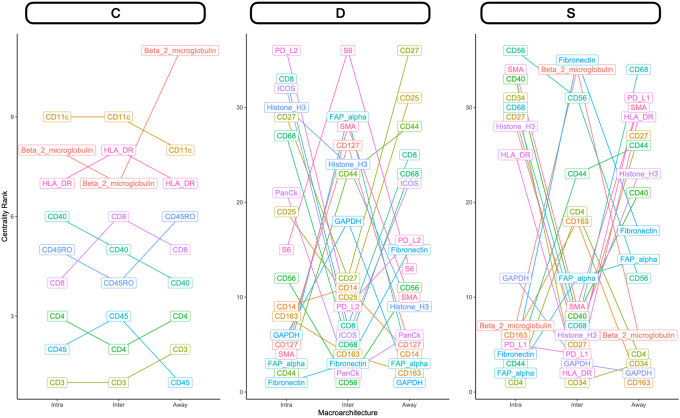
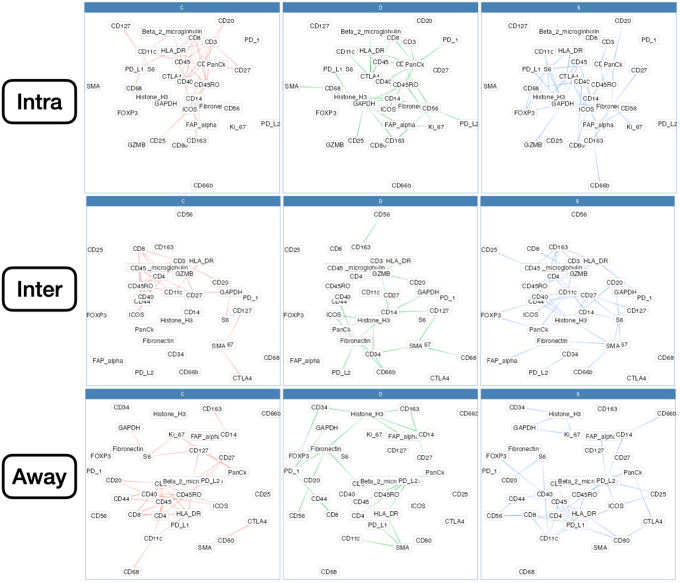
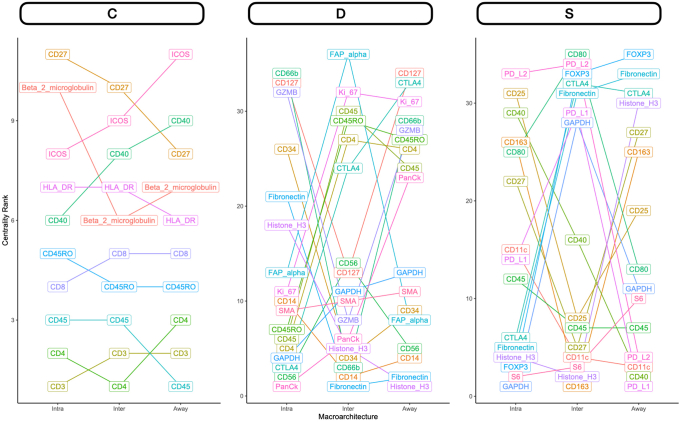
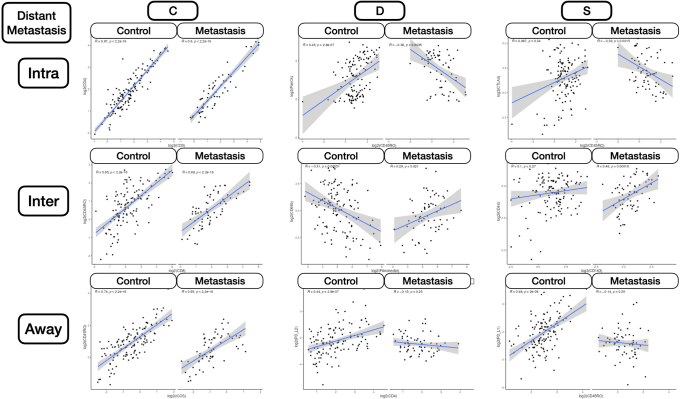
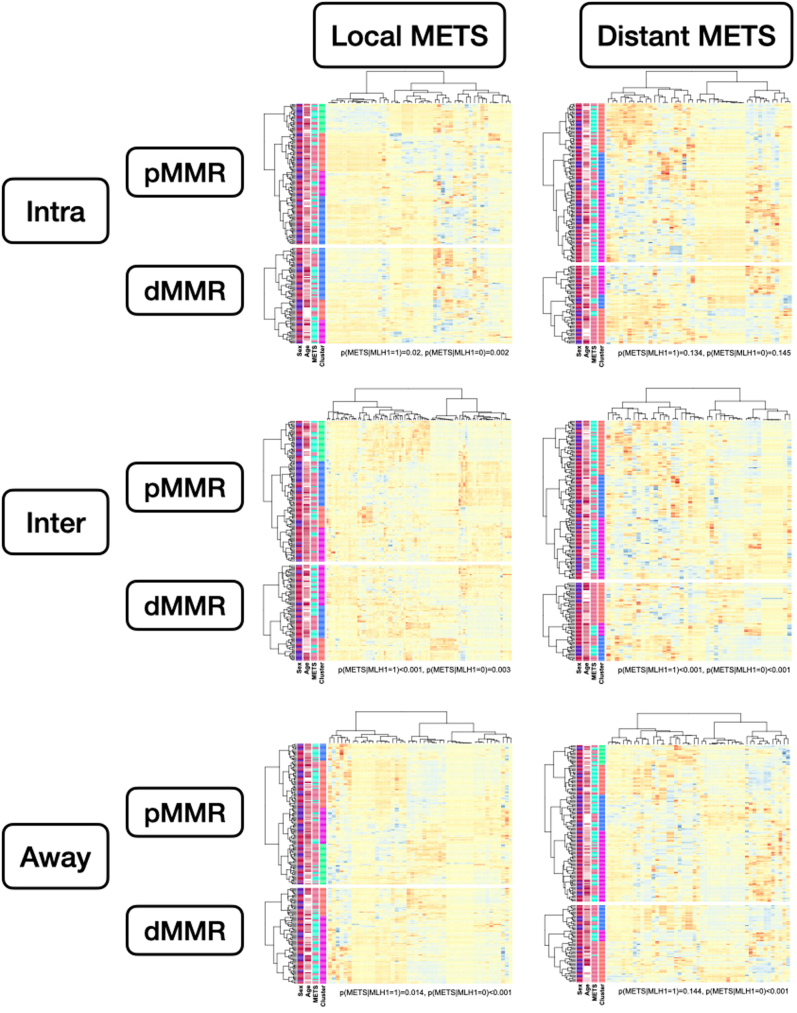
Over 150,000 Americans are diagnosed with colorectal cancer (CRC) every year, and annually >50,000 individuals are estimated to die of CRC, necessitating improvements in screening, prognostication, disease management, and therapeutic options. CRC tumors are removed en bloc with surrounding vasculature and lymphatics. Examination of regional lymph nodes at the time of surgical resection is essential for prognostication. Developing alternative approaches to indirectly assess recurrence risk would have utility in cases where lymph node yield is incomplete or inadequate. Spatially dependent, immune cell-specific (eg, tumor-infiltrating lymphocytes), proteomic, and transcriptomic expression patterns inside and around the tumor-the tumor immune microenvironment-can predict nodal/distant metastasis and probe the coordinated immune response from the primary tumor site. The comprehensive characterization of tumor-infiltrating lymphocytes and other immune infiltrates is possible using highly multiplexed spatial omics technologies, such as the GeoMX Digital Spatial Profiler. In this study, machine learning and differential co-expression analyses helped identify biomarkers from Digital Spatial Profiler-assayed protein expression patterns inside, at the invasive margin, and away from the tumor, associated with extracellular matrix remodeling (eg, granzyme B and fibronectin), immune suppression (eg, forkhead box P3), exhaustion and cytotoxicity (eg, CD8), Programmed death ligand 1-expressing dendritic cells, and neutrophil proliferation, among other concomitant alterations. Further investigation of these biomarkers may reveal independent risk factors of CRC metastasis that can be formulated into low-cost, widely available assays.


Figures

Figure 1
Figure 1
Study overview: A: Hematoxylin and eosin– and immunofluorescence-stained slide used to help place region of interest for profiling within three distinct architectures: intratumoral (Intra; blue), interface (Inter; red; invasive margin or peritumoral), and away (green); colors for outlined macroarchitectures correspond with colors used in Figure 1E to denote separate tissue architectures. B: Within distinct architectures, expression of specific lineages/protein markers predictive of metastasis (METS) status; box plots used to communicate center and spread of hypothetical expression of canonical protein markers correspondent to immune cell sublineages; box plots are compared for patients without metastasis (blue), patients with nodal metastasis (red), or patients with distant spread (orange); expression differences reported for each architecture (here intratumoral and interface). C: Mixed-effects machine learning (MEML) models uncover statistical interactions between specific immune cell types (ie, different risk of metastasis for specific cell type conditional on another cell type); illustrates how interaction (two crossing lines) are uncovered, invariant to batch/patient; association of protein j (corresponding to the green cell type, as denoted by the green sphere) with metastasis is reported separately for yellow cell types and for cell types that are not yellow. D: Differential co-expression patterns identify correlations between markers (proteins j and k corresponding to the green and purple cell types, respectively) that are metastasis specific. E: Identifying predictive protein biomarkers (ie, cell lineages, with different lineages denoted by different color spheres) for nodal and distant metastasis within these regions: intratumoral (blue), interface (red; invasive margin), and away (green); color assigned to each macroarchitecture similar to colors in Figure 1A. Intra, Inter, and Away are described in Data Acquisition and Preprocessing. PanCk, pancytokeratin.
Figure 2
Figure 2
Differentially expressed protein markers of local metastasis. Results stratified by tissue architecture: intratumoral (Intra; A, D, and G); interface/peritumoral (Inter; B, E, and H); and away/stroma (Away; C, F, and I); results also stratified by mismatch repair (MMR) status: MMR proficient (pMMR; DF) and MMR deficient (dMMR; GI); statistical significance cutoff at α=0.05; x-axis indicates effect size and directionality (positive x-value indicates metastasis-related marker; negative indicates decreased metastasis risk); y-axis indicates effect significance (positive y-value indicates lower P value). Intra, Inter, and Away are described in Data Acquisition and Preprocessing. FOXP3, forkhead box P3; PD-L, programmed death ligand; SMA, smooth muscle actin.
Figure 3
Figure 3
Select protein marker expression for biomarkers predictive of nodal metastasis, stratified by mismatch repair (MMR) status: CD8 at the interface (Inter; A); programmed death ligand 1 (PD-L1) at the interface (B); CD34 at the interface (C); and CD127 at the interface (D). Marker expression plotted in beeswarm plots was filtered on the basis of the detection of outliers using a modified Tukey outlier test—after this initial filtering, only points between the 10% and 90% quantiles for each stratum were included. Inter is described in Data Acquisition and Preprocessing. dMMR, MMR deficient; pMMR, MMR proficient.
Figure 4
Figure 4
Relative protein expression between markers predictive of nodal metastasis, stratified by mismatch repair (MMR) status: CD66b/CD8 inside the tumor (Intra; A); forkhead box P3 (FOXP3)/programmed death ligand 1 (PD-L1) inside the tumor (B); CD8/cytotoxic T-lymphocyte–associated antigen 4 (CTLA4) at the interface (Inter; C); and CD8/CD56 at the interface (D). Marker expression plotted in beeswarm plots was filtered on the basis of the detection of outliers using a modified Tukey outlier test—after this initial filtering, only points between the 10% and 90% quantiles for each stratum were included. Intra and Inter are described in Data Acquisition and Preprocessing. dMMR, MMR deficient; pMMR, MMR proficient.
Figure 5
Figure 5
Select protein marker expression, conditional on cell type (stratified by median expression), predictive of nodal metastasis: CD34 expression stratified by programmed death ligand 1 (PD-L1)–expressing cells inside the tumor (Intra; A), CD44 stratified by CD3 at the interface (Inter; B), and CD127 stratified by CD66b at the interface (C). Marker expression plotted in beeswarm plots was filtered on the basis of the detection of outliers using a modified Tukey outlier test—after this initial filtering, only points between the 10% and 90% quantiles for each stratum were included. Intra and Inter are described in Data Acquisition and Preprocessing.
Figure 6
Figure 6
Select protein marker expression predictive of distant metastasis, conditional on cell type (stratified by median expression): pancytokeratin (PanCk) expression stratified by CD66b-expressing cells inside the tumor (Intra; A), fibronectin stratified by CD66b at the interface (Inter; B), and CD66b stratified by fibroblast activation protein (FAP)-α away from the tumor (Away; C). Marker expression plotted in beeswarm plots was filtered on the basis of the detection of outliers using a modified Tukey outlier test—after this initial filtering, only points between the 10% and 90% quantiles for each stratum were included. Intra, Inter, and Away are described in Data Acquisition and Preprocessing.
Figure 7
Figure 7
Differential co-expression between select protein markers, stratified by lymph node metastasis status within three tissue architectures (Intra, Inter, and Away). C indicates whether co-expression was conserved between patients with and without metastasis; D indicates whether co-expression differed between patients with and without metastasis; and S indicates whether significant co-expression was specific to either patients with or without metastasis. Intra, Inter, and Away are described in Data Acquisition and Preprocessing. FAP, fibroblast activation protein.
Supplemental Figure S1
Volcano plots illustrating differentially expressed protein markers of any metastasis. Results stratified by tissue architecture: intratumoral (Intra; A, D, and G); peritumoral (Inter; B, E, and H); and away/stroma (Away; C, F, and I); results also stratified by mismatch repair (MMR) status: MMR proficient (pMMR; DF) and MMR deficient (dMMR; GI); statistical significance cutoff at α=0.05; x-axis indicates effect size and directionality (positive x-value indicates metastasis-related marker; negative indicates decreased metastasis risk); y-axis indicates effect significance (positive y-value indicates lower P value). Intra, Inter, and Away are described in Data Acquisition and Preprocessing.FOXP3, forkhead box P3; GZMB, granzyme B; PanCk, pancytokeratin; PD-L2, programmed death ligand 2.
Supplemental Figure S2
Box plots and beeswarm scatterplots of select protein marker expression for biomarkers predictive of any metastasis, stratified by mismatch repair (MMR) status: programmed death ligand 2 (PD-L2) inside the tumor (Intra; A); CD56 at the interface (Inter; B); CD11c away from tumor (Away; C); and forkhead box P3 (FOXP3) away from tumor (D). Marker expression plotted in beeswarm plots was filtered on the basis of detection of outliers using a modified Tukey outlier test—after this initial filtering, only points between the 10% and 90% quantiles for each stratum were included. Intra, Inter, and Away are described in Data Acquisition and Preprocessing. dMMR, MMR deficient; pMMR, MMR proficient.
Supplemental Figure S3
Volcano plots illustrating differentially expressed protein markers of distant metastasis. Results stratified by tissue architecture: intratumoral (Intra; A, D, and G); peritumoral (Inter; B, E, and H); and away/stroma (Away; C, F, and I); results also stratified by mismatch repair (MMR) status: MMR proficient (pMMR; DF) and MMR deficient (dMMR; GI); statistical significance cutoff at α=0.05;; x-axis indicates effect size and directionality (positive x-value indicates metastasis-related marker; negative indicates decreased metastasis risk); y-axis indicates effect significance (positive y-value indicates lower P value). Intra, Inter, and Away are described in Data Acquisition and Preprocessing. GZMB, granzyme B; PanCk: pancytokeratin; PD-L1, programmed death ligand 1.
Supplemental Figure S4
Box plots and beeswarm scatterplots of select protein marker expression for biomarkers predictive of distant metastasis, stratified by mismatch repair (MMR) status: granzyme B (GZMB) inside the tumor (Intra; A); GZMB at the interface (Inter; B); CD11c away from tumor (Away; C); and Ki-67 away from tumor (D). Marker expression plotted in beeswarm plots was filtered on the basis of detection of outliers using a modified Tukey outlier test—after this initial filtering, only points between the 10% and 90% quantiles for each stratum were included. Intra, Inter, and Away are described in Data Acquisition and Preprocessing. dMMR, MMR deficient; pMMR, MMR proficient.
Supplemental Figure S5
Box plots and beeswarm scatterplots of relative protein expression between two markers, predictive of any metastasis, stratified by mismatch repair (MMR) status: β-2-microglobulin/programmed death ligand 2 (PD-L2) inside the tumor (Intra; A); CD11c/granzyme B (GZMB) at the interface (Inter; B); CD11c/GZMB away from tumor (Away; C); and CD11c/CD14 away from tumor (D). Marker expression plotted in beeswarm plots was filtered on the basis of detection of outliers using a modified Tukey outlier test—after this initial filtering, only points between the 10% and 90% quantiles for each stratum were included. Intra, Inter, and Away are described in Data Acquisition and Preprocessing. dMMR, MMR deficient; pMMR, MMR proficient.
Supplemental Figure S6
Box plots and beeswarm scatterplots of relative protein expression between two markers, predictive of distant metastasis, stratified by mismatch repair (MMR) status: CD8/programmed death ligand 1 (PD-L1) inside the tumor (Intra; A); CD4/PD-L1 inside the tumor (B); CD11c/granzyme B (GZMB) at the interface (Inter; C); and CD11c/CD34 away from tumor (Away; D). Marker expression plotted in beeswarm plots was filtered on the basis of detection of outliers using a modified Tukey outlier test—after this initial filtering, only points between the 10% and 90% quantiles for each stratum were included. Intra, Inter, and Away are described in Data Acquisition and Preprocessing. dMMR, MMR deficient; pMMR, MMR proficient.
Supplemental Figure S7
Posterior interval estimates from Markov Chain Monte Carlo (MCMC) draw from bayesian generalized linear mixed effects models for prediction of any metastasis from standardized protein markers and their interactions, stratified by architecture; predictors were derived from mixed effects machine learning models and subselected using Horseshoe Least Absolute Shrinkage and Selection Operator (LASSO) before unpenalized statistical testing. Intra, Inter, and Away are described in Data Acquisition and Preprocessing.
Supplemental Figure S8
Box plots and beeswarm scatterplots of select protein marker expression, conditional on cell type (stratified by median expression), predictive of any metastasis: CD34 expression stratified by programmed death ligand 1 (PD-L1)–expressing cells inside the tumor (Intra; A), CD27 stratified by fibronectin at the interface (Inter; B), and CD27 stratified by CD40 away from the tumor (Away; C). Marker expression plotted in beeswarm plots was filtered on the basis of detection of outliers using a modified Tukey outlier test—after this initial filtering, only points between the 10% and 90% quantiles for each stratum were included. Intra, Inter, and Away are described in Data Acquisition and Preprocessing.
Supplemental Figure S9
Posterior interval estimates from Markov Chain Monte Carlo (MCMC) draw from bayesian generalized linear mixed effects models for prediction of nodal metastasis from standardized protein markers and their interactions, stratified by architecture; predictors were derived from mixed effects machine learning models and subselected using Horseshoe Least Absolute Shrinkage and Selection Operator (LASSO) before unpenalized statistical testing. Intra, Inter, and Away are described in Data Acquisition and Preprocessing.
Supplemental Figure S10
Posterior interval estimates from Markov Chain Monte Carlo (MCMC) draw from bayesian generalized linear mixed effects models for prediction of distant metastasis from standardized protein markers and their interactions, stratified by architecture; predictors were derived from mixed effects machine learning models and subselected using Horseshoe Least Absolute Shrinkage and Selection Operator (LASSO) before unpenalized statistical testing. Intra, Inter, and Away are described in Data Acquisition and Preprocessing.
Supplemental Figure S11
Differential co-expression networks predictive of any metastasis, stratified by three tissue architectures (Intra, Inter, and Away). C indicates whether co-expression was conserved between patients with and without metastasis; D indicates whether co-expression differed between patients with and without metastasis; and S indicates whether significant co-expression was specific to either patients with or without metastasis. Edges between markers indicate whether relationship could be characterized by C, D or S. Intra, Inter, and Away are described in Data Acquisition and Preprocessing.
Supplemental Figure S12
Rank-based summaries of proteins important to the differential co-expression networks predictive of any metastasis, stratified by three tissue architectures (Intra, Inter, and Away). C indicates whether co-expression was conserved between patients with and without metastasis; D indicates whether co-expression differed between patients with and without metastasis; and S indicates whether significant co-expression was specific to either patients with or without metastasis. Rank indicates eigenvector centrality of protein within each of the networks (lower rank indicates importance in network); proteins with top-10 overall rank were selected for viewing. Intra, Inter, and Away are described in Data Acquisition and Preprocessing.
Supplemental Figure S13
Differential co-expression scatterplots between select protein markers, stratified by any metastasis status within three tissue architectures (Intra, Inter, and Away). C indicates whether co-expression was conserved between patients with and without metastasis; D indicates whether co-expression differed between patients with and without metastasis; and S indicates whether significant co-expression was specific to either patients with or without metastasis. Intra, Inter, and Away are described in Data Acquisition and Preprocessing.
Supplemental Figure S14
Differential co-expression networks predictive of nodal metastasis, stratified by three tissue architectures (Intra, Inter, and Away). C indicates whether co-expression was conserved between patients with and without metastasis; D indicates whether co-expression differed between patients with and without metastasis; and S indicates whether significant co-expression was specific to either patients with or without metastasis. Edges between markers indicate whether relationship could be characterized by C, D or S. Intra, Inter, and Away are described in Data Acquisition and Preprocessing.
Supplemental Figure S15
Rank-based summaries of proteins important to the differential co-expression networks predictive of nodal metastasis, stratified by three tissue architectures (Intra, Inter, and Away). C indicates whether co-expression was conserved between patients with and without metastasis; D indicates whether co-expression differed between patients with and without metastasis; and S indicates whether significant co-expression was specific to either patients with or without metastasis. Rank indicates eigenvector centrality of protein within each of the networks (lower rank indicates importance in network); proteins with top-10 overall rank were selected for viewing. Intra, Inter, and Away are described in Data Acquisition and Preprocessing.
Supplemental Figure S16
Differential co-expression networks predictive of distant metastasis, stratified by three tissue architectures (Intra, Inter, and Away). C indicates whether co-expression was conserved between patients with and without metastasis; D indicates whether co-expression differed between patients with and without metastasis; and S indicates whether significant co-expression was specific to either patients with or without metastasis. Edges between markers indicate whether relationship could be characterized by C, D or S. Intra, Inter, and Away are described in Data Acquisition and Preprocessing.
Supplemental Figure S17
Rank-based summaries of proteins important to the differential co-expression networks predictive of distant metastasis, stratified by three tissue architectures (Intra, Inter, and Away). C indicates whether co-expression was conserved between patients with and without metastasis; D indicates whether co-expression differed between patients with and without metastasis; and S indicates whether significant co-expression was specific to either patients with or without metastasis. Rank indicates eigenvector centrality of protein within each of the networks (lower rank indicates importance in network); proteins with top-10 overall rank were selected for viewing. Intra, Inter, and Away are described in Data Acquisition and Preprocessing.
Supplemental Figure S18
Differential co-expression scatterplots between select protein markers, stratified by distant metastasis status within three tissue architectures (Intra, Inter, and Away). C indicates whether co-expression was conserved between patients with and without metastasis; D indicates whether co-expression differed between patients with and without metastasis; and S indicates whether significant co-expression was specific to either patients with or without metastasis. Intra, Inter, and Away are described in Data Acquisition and Preprocessing.
Supplemental Figure S19
Hierarchical clustering of predictive markers of metastasis (METS) extracted from study, within three tissue architectures (Intra, Inter, and Away), stratified by mismatch repair (MMR) status; Fisher exact tests were used to compare cluster assignment with presence of metastasis to report P values at bottom of plot to indicate overall associations. Intra, Inter, and Away are described in Data Acquisition and Preprocessing. dMMR, MMR deficient; pMMR, MMR proficient.

References

    1. Carethers J.M., Doubeni C.A. Causes of socioeconomic disparities in colorectal cancer and intervention framework and strategies. Gastroenterology. 2020;158:354–367. - PMC - PubMed
    1. Kasi P.M., Shahjehan F., Cochuyt J.J., Li Z., Colibaseanu D.T., Merchea A. Rising proportion of young individuals with rectal and colon cancer. Clin Colorectal Cancer. 2019;18:e87–e95. - PubMed
    1. Slattery M.L. Diet, lifestyle, and colon cancer. Semin Gastrointest Dis. 2000;11:142–146. - PubMed
    1. Araghi M., Soerjomataram I., Bardot A., Ferlay J., Cabasag C.J., Morrison D.S., De P., Tervonen H., Walsh P.M., Bucher O. Changes in colorectal cancer incidence in seven high-income countries: a population-based study. Lancet Gastroenterol Hepatol. 2019;4:511–518. - PMC - PubMed
    1. Siegel R.L., Miller K.D., Goding Sauer A., Fedewa S.A., Butterly L.F., Anderson J.C., Cercek A., Smith R.A., Jemal A. Colorectal cancer statistics, 2020. CA Cancer J Clin. 2020;70:145–164. - PubMed

Publication types