. 2023 Apr 10;6(6):e202201680.
doi: 10.26508/lsa.202201680. Print 2023 Jun.

Proteomic analysis reveals microvesicles containing NAMPT as mediators of radioresistance in glioma

Affiliations

Proteomic analysis reveals microvesicles containing NAMPT as mediators of radioresistance in glioma

Elena Panizza et al. Life Sci Alliance. .

Abstract

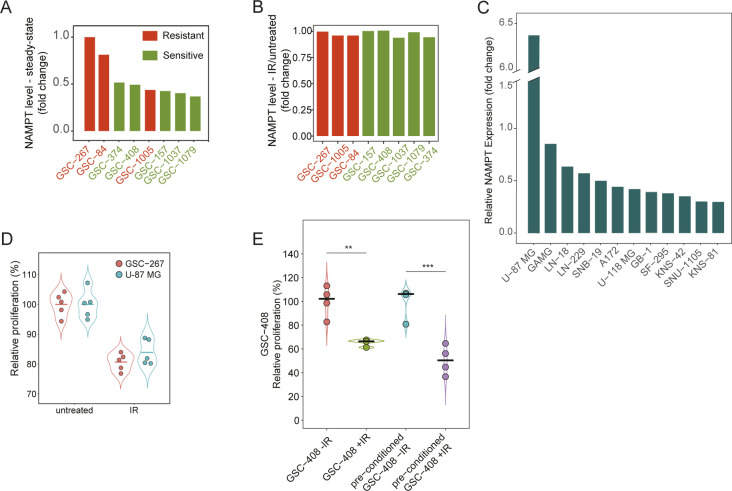
Tumor-initiating cells contained within the aggressive brain tumor glioma (glioma stem cells, GSCs) promote radioresistance and disease recurrence. However, mechanisms of resistance are not well understood. Herein, we show that the proteome-level regulation occurring upon radiation treatment of several patient-derived GSC lines predicts their resistance status, whereas glioma transcriptional subtypes do not. We identify a mechanism of radioresistance mediated by the transfer of the metabolic enzyme NAMPT to radiosensitive cells through microvesicles (NAMPT-high MVs) shed by resistant GSCs. NAMPT-high MVs rescue the proliferation of radiosensitive GSCs and fibroblasts upon irradiation, and upon treatment with a radiomimetic drug or low serum, and increase intracellular NAD(H) levels. Finally, we show that the presence of NAMPT within the MVs and its enzymatic activity in recipient cells are necessary to mediate these effects. Collectively, we demonstrate that the proteome of GSCs provides unique information as it predicts the ability of glioma to resist radiation treatment. Furthermore, we establish NAMPT transfer via MVs as a mechanism for rescuing the proliferation of radiosensitive cells upon irradiation.


Conflict of interest statement

The authors declare that they have no conflict of interest.

Figures

Figure S1.
Figure S1.. Molecular characterization of GSC lines using proteomics.
(A) Workflow employed for the proteomic profiling of eight patient-derived glioma stem cell (GSC) lines. The cells were either left untreated or were treated with 6 gray (Gy) of ionizing radiation. The number of proteins identified and quantified is displayed. TMT, Tandem Mass Tags 10plex. (B) p21 (CDKN1A) protein expression levels in GSC-1079 and GSC-374 cells untreated or treated with four and six gray (Gy) of ionizing radiation for 2 d. Actin was used as a loading control. (C) single-sample GSEA (ssGSEA) scores representing the enrichment of signatures for glioma transcriptional subtypes (Verhaak et al, 2010) show that only GSC-267 cells display a mesenchymal signature, which has been associated with a more aggressive phenotype. Mes, mesenchymal; Pn, proneural; Cl, classical; N/A, ssGSEA scores below the threshold for any of the subtypes. (D) Relative number of viable GSC-267 and GSC-408 cells either left untreated or treated with 6 Gy of ionizing radiation (IR) for 4 d. The number of viable cells was quantified as a function of their content of intracellular proteases. (E) Distribution of ssGSEA scores representing the enrichment of a signature for the glioma cytosine–phosphate–guanine island methylator phenotype (g-CIMP) and IDH mutational status. Samples with scores that are below threshold are g-CIMP/IDH mutant positive (+), including three of the radiosensitive GSC lines (GSC-157, GSC-408 and GSC-1079). The remaining two radiosensitive (GSC-374 and GSC-1037) and three radioresistant GSC lines are IDH WT. Data information: in (D), significance levels were evaluated using t test. ***P-value < 1 × 10⁻³.
Figure 1.
Figure 1.. Proteomic analysis identifies GSCs that are resistant to radiation.
(A) A subset of GSC lines that do not respond to radiation is separated by hierarchical clustering of the quantified proteome based on Euclidian distance and Ward linkage method (Vacanti, 2019). The number of proteins significantly regulated in radioresistant (red) and radiosensitive (green) GSCs upon radiation treatment is displayed. IR, ionizing radiation. Gy, gray; g-CIMP, glioma-CpG island methylator phenotype; IDH, isocitrate dehydrogenase. (B) Volcano plots representing changes in protein expression upon radiation, plotted against the significance of the regulation. Each dot represents the average log2(IR-treated/untreated) for each protein in the subset of radioresistant (left) or radiosensitive (right) GSC lines. Proteins whose expressions are significantly changed are selected by using the statistical package limma with a Bonferroni–Hochberg corrected q-value lower than 0.02. (C) Relative proliferation of representative radioresistant (red) and radiosensitive (green) GSCs after their treatment with 6 Gy of IR. Dots represent independent biological replicates. (D) Box plot representing the change in expression of the indicated proteins upon radiation treatment in the examined GSC lines. Red: resistant GSC lines. Green: sensitive GSC lines. Data information: In (C, D), significance levels were evaluated using t test. **P-value < 1 × 10⁻²; ***P-value < 1 × 10⁻³; ****, P-value < 1 × 10⁻⁴. Source data are available for this figure.
Figure 2.
Figure 2.. Microvesicles derived from GSC-267 cells increase the proliferation of recipient cells and are enriched in NAMPT.
(A) GO biological processes enriched in the subset of proteins elevated in radioresistant compared with radiosensitive GSC lines, which were selected using the statistical package limma with a Bonferroni–Hochberg-corrected q-value lower than 0.02 and a log2(ratio) > 0 (n = 81). GO terms “cell division,” “cell cycle,” “chromosome segregation,” and “organization” are significantly enriched (red dots), based on Fisher’s exact test P-value lower than 1 × 10⁻⁴ and fold enrichment higher than 1.5. (B) Hierarchical clustering based on Spearman correlation and Ward linkage method of CDRP proteins overexpressed in each of the radioresistant GSC lines compared with the other GSC lines. Significantly overexpressed proteins were selected using the statistical package limma with a Bonferroni–Hochberg-corrected q-value lower than 0.05 and log2(ratio) > 0. Red and green bars in the right panel mark genes belonging to the top two Panther pathways enriched among the CDRPs overexpressed in each cell line. Black bars in the right panel mark top-differentially expressed CDRPs in each cell line (Fig S2A). (C) Proteins elevated in GSC-267 cells, compared with other GSC lines, are highly connected in a protein–protein interaction network (protein–protein interaction enrichment P-value < 1 × 10⁻¹⁶). The top three GO terms enriched in the network are listed. Vesicle-mediated transport includes the processes of vesicle formation, coating, budding, and fusion with target membranes, and has been shown to describe both MVs and exosomes in a previous proteome-wide analysis (Willms et al, 2016). FDR, false discovery rate-adjusted P-value for the GO terms enrichment, based on Fisher’s exact test. (D) Transmission electron microscopy images of MVs (left) and exosomes (right) isolated from GSC-267 cells. Scale bar = 500 nm. (E) Relative proliferation of NIH/3T3 cells cultured in low serum (0.5% calf serum, CS), either untreated or treated with MVs or exosomes isolated from GSC-267 for 5 d. Individual dots represent independent biological replicates. (F) Protein expression levels of EV markers in MVs relative to exosomes isolated from GSC-267 cells (n = 2 for each EV type). ANXA1, 2, 5, Annexin A1, A2, A5; SDCBP, Syntenin-1. (G) Distribution of protein abundances based on precursor areas in whole cell (left panel) and EV (right panel) proteomic analyses. Proteins are categorized by subcellular compartments (Orre et al, 2019). The number of compartment-enriched proteins in each category is > 300 in the whole cell analysis and > =70 in the EV analysis. (H) Identification of proteins that are candidates for promoting the ability of MVs derived from GSC-267 cells to confer aggressive phenotypes. Proteins that are specifically elevated in GSC-267 whole cell (WC) lysates compared with the other GSC lines (n = 721), and proteins that are elevated in MVs generated by GSC-267 cells compared with exosomes (n = 356) are displayed; the overlap between these two sets (n = 66) was selected as candidates. This set of proteins was then filtered based on correlation with decreased survival in a TCGA patient cohort (n = 349). (I) Western blots showing the expression levels of acetyl p53 K382, p21, poly/mono ADP ribose and actin in the radioresistant GSC-267 cells (R), and in the radiosensitive GSC-408 cells (S), either left untreated or treated with 6 Gy of ionizing radiation (IR). (I, J) Densitometric quantification of protein expression levels displayed in (I). Fold change was calculated relative to the untreated experimental condition for each cell line, and normalized to actin levels. Data information: In (E, F, G), significance levels were evaluated using t test. ***P-value < 1 × 10⁻³; *****P-value < 1 × 10⁻⁶. Source data are available for this figure.
Figure S2.
Figure S2.. The proteome of EVs released by GSCs.
(A) Scatter plot representing CDRPs overexpressed in individual radioresistant GSC lines. (B) Volcano plot representing protein expression levels in GSC-267 cells relative to the other GSC lines plotted against the significance of the regulation based on limma statistics. Significantly elevated proteins (n = 721) are selected using the statistical package limma with a Bonferroni–Hochberg-corrected q-value lower than 0.05 and log2(ratio) > 0 to compare steady state protein abundances for the two replicates (untreated and treated) for GSC-267 cells with protein abundances in all the other cell lines. (C) Relative proliferation of GSC-408 cells treated with the indicated combinations of 6 Gy of ionizing radiation (IR), and conditioned medium collected from GSC-267 cells that had been depleted of MVs for 4 d. Individual dots represent independent biological replicates. (D) Workflow employed for the proteomic analysis of EVs generated by GSCs. The approach used for isolating MVs and exosomes is outlined. Proteins are extracted from EV samples and analyzed by LC–MS. The number of proteins identified and quantified is indicated. (E) Distribution of protein abundances based on precursor areas in whole cell (top panel) and EV (bottom panel) proteomic analyses. Cytosolic and nuclear marker proteins highlighted in red and aqua green, respectively. Marker proteins are also indicated by gene symbol. Cytosolic markers: glyceraldehyde-3-phosphate dehydrogenase, GAPDH; proteasome subunit alpha type-3, PSMA3. Nuclear markers: histone H1.5 (HIST1H1B), 40S ribosomal protein S3 (RPS3), 40S ribosomal protein S3 (LMNA). (F) Volcano plot representing the protein expression in MVs compared with exosomes derived from GSC-267 cells. Significantly elevated proteins (n = 356) are selected using the statistical package limma with a Bonferroni–Hochberg-corrected q-value lower than 0.05 and log2(ratio) > 0. (G) Table of proteins elevated in both GSC-267 cells and in the MVs that these cells produce, and which correlate with poor survival based on The Cancer Genome Atlas (TCGA) data. Data information: in (C), significance levels were evaluated using Student’s t test. **P-value < 1 × 10⁻²; ***P-value < 1 × 10⁻³.
Figure 3.
Figure 3.. NAMPT-high MVs mediate radioresistance in recipient cells.
(A) Elevated NAMPT transcript expression significantly correlates with the lower survival of glioblastoma patients (n = 349). The displayed P-value was calculated using a logrank test based on data obtained from TCGA. The 25th percentile value of NAMPT expression values is set as a threshold to define high expression. (B) NAMPT transcript expression levels across glioblastoma (grade IV glioma), high-grade glioma (grade III), and low-grade glioma (grade II). The displayed P-value was calculated using a t test based on a TCGA cohort of 1,520 patients. (C) Relative NAMPT protein abundance in glioblastoma samples (n = 99) compared with normal brain tissue (n = 10) as measured by the National Cancer Institute’s Clinical Proteomic Tumor Analysis Consortium (Wang et al, 2021b). (D) Western blots showing the expression levels of NAMPT and the MV markers flotillin-2 (FLOT-2) and heat shock protein 90 (HSP-90) in GSC lines and in the MVs derived from these cells. Whole cell lysates (WCL), whole cell lysate. (E) Relative proliferation of NIH/3T3 cells cultured in low serum (0.5% CS) medium, either left untreated or treated with the indicated combinations of 5 μM bleomycin (Bleo) and MVs derived from GSC-267 or GSC-84 cells for 5 d. Individual dots represent independent biological replicates. (F) Western blots representing the expression levels of NAMPT in GSC-267 and U-87 MG WCL and MVs. HSP-90 is used as an EV marker, whereas IKB-alpha is a WCL marker. (G) Relative number of viable NIH/3T3 cells cultured in low serum (0.5% CS) and treated with the indicated combinations of 6 Gy of ionizing radiation (IR) and MVs derived from U-87 MG cells. Cells were counted after 4 d. Individual dots represent independent biological replicates. (H) Relative proliferation of radio-sensitive GSC-1079 cells either untreated or treated with 6 Gy of ionizing radiation (IR) alone or in combination with MVs derived from GSC-267 cells for 4 d. Individual dots represent independent biological replicates. Data information: in (B, C, E, G, H), significance levels were evaluated using t test. ***P-value < 1 × 10⁻³; ****P-value < 1 × 10⁻⁴; *****P-value < 1 × 10⁻⁶. Source data are available for this figure.
Figure S3.
Figure S3.. NAMPT expression in GSCs and established glioma cells.
(A) Relative protein expression levels of NAMPT (steady state) in radiosensitive (green) and radioresistant (red) GSC lines, based on proteomic quantification. (B) Relative changes of NAMPT protein expression levels in radiosensitive (green) and radioresistant (red) GSC lines upon their treatment with ionizing radiation (IR) for 2 d, based on proteomic quantification. (C) Relative protein expression levels of NAMPT in glioma cell lines based on quantitative proteomic of the Cancer Cell Line Encyclopedia (Nusinow et al, 2020). (D) Relative proliferation of GSC-267 and U-87 MG cells, either left untreated or treated with 6 gray of ionizing radiation (IR), for 4 d. Individual dots represent independent biological replicates. (E) Relative proliferation of GSC-408 cells and of GSC-408 cells that had been preconditioned with daily treatments with MVs derived from GSC-267 cells, a week before their treatment with 6 gray of ionizing radiation (IR). Proliferation was measured 4 d after IR treatment. Individual dots represent independent biological replicates. Data information: in (E), significance levels were evaluated using t test. **P-value < 1 × 10⁻²; ***P-value < 1 × 10⁻³.
Figure 4.
Figure 4.. NAMPT enzymatic activity and transfer are required to promote the proliferation of irradiated cells.
(A) Western blots representing the expression levels of NAMPT in NIH/3T3 cells, either untreated or treated with progressively lower doses of MVs and exosomes (exo) isolated from GSC-267 cells (EV dose 2 is half of EV dose 1) for 24 h. Actin was used as a loading control. (B) Total NAD+ and NADH level (NADt) in NIH/3T3 cells, untreated or treated with MVs derived from GSC-267 cells for 6 h. Individual dots represent independent biological replicates. Significance of observed changes was evaluated using Student’s t test. **P-value < 1 × 10⁻². (C) NAMPT protein expression levels in whole cell (WC) lysates from GSC-267 parental cells, GSC-267 NAMPTsh cells −/+ Dox, and in MV protein extracts derived from GSC-267 NAMPTsh cells −/+ Dox. IKB-alpha is a WC marker and shows that the MV preparations are devoid of cellular contaminants. HSP-90 was used as a loading control. (C, D) Densitometric quantification of NAMPT protein expression levels displayed in (C). Variability is evaluated based on two technical replicates. Significance of observed changes was evaluated using t test. **P-value < 1 × 10⁻². (E) Concentration of MVs (vesicles larger than 200 nm) isolated from GSC-267 NAMPTsh cells −/+Dox, normalized based on cell number. Individual dots represent independent biological replicates. The significance of observed changes was evaluated using t test. n.s., not significant. (F) Relative number of viable NIH/3T3 cells cultured in low serum (0.5% CS) and treated with the indicated combinations of 6 Gy of ionizing radiation (IR) and MVs derived from GSC-267 NAMPTsh cells −Dox (MVs NAMPT +) or + Dox (MVs NAMPT −) for 4 d. Individual dots represent independent biological replicates. Significance of observed changes was evaluated using t test. *****P-value < 1 × 10⁻⁶. (G) Relative proliferation of GSC-408 cells treated with the indicated combinations of 6 Gy of ionizing radiation (IR), 19 nM human recombinant NAMPT (hrNAMPT), and 500 μM nicotinamide mononucleotide for 4 d. Individual dots represent independent biological replicates. (H) Relative proliferation of NIH/3T3 cells cultured in low serum (0.5% CS) and treated with the indicated combinations of MVs derived from GSC-267 cells, 500 μM nicotinamide mononucleotide, and 10 μM of the NAMPT inhibitor FK-866 for 3 d. Individual dots represent independent biological replicates. Significance of the observed changes was evaluated using t test. *P-value < 0.02; **P-value < 1 × 10⁻²; ***P-value < 1 × 10⁻³. Data information: in (B, D, E, F, G, H), significance levels were evaluated using t test. *P-value < 0.02; **P-value < 1 × 10⁻²; ***P-value < 1 × 10⁻³; ****P-value < 1 × 10⁻⁴; *****P-value < 1 × 10⁻⁵; ******P-value < 1 × 10⁻⁶. Source data are available for this figure.
Figure S4.
Figure S4.. NAMPT protein transfer drives radiation resistance in EV-recipient cells.
(A) NAMPT protein expression levels in GSC-267 parental cells or GSC-267 NAMPTsh cells, untreated (− Dox) or treated with 400 ng/ml doxycycline (+ Dox) for the indicated length of time. Actin was used as a loading control. (B) Representative plots of nanoparticle tracking analysis of the partially clarified medium (containing EVs) collected from GSC-267 NAMPTsh cells −Dox (top panel) or +Dox (bottom panel). Exosomes (vesicles smaller than 200 nm) and MVs (vesicles larger than 200 nm) are present. (C) Representative microscopic images of Hoechst staining of NIH/3T3 cell nuclei. Cells were cultured in low serum (0.5% CS) and treated with the indicated combinations of 6 Gy of ionizing radiation (IR) and MVs derived from GSC-267 NAMPTsh cells −Dox (MVs NAMPT +), or + Dox (MVs NAMPT −), for 4 d. Scale bar 200 = μM. (D) Relative number of viable NIH/3T3 cells cultured in low serum (0.5% CS) medium, treated with the indicated combinations of 5 μM bleo, MVs derived from GSC-267, and 100 nM cenicriviroc (CVC), for 4 d. Individual dots represent independent biological replicates. t test P-values: n.s., not significant; **P-value < 1 × 10⁻². (E) Relative number of viable NIH/3T3 cells cultured in low serum (0.5% CS) either left untreated or treated with the indicated combinations of 3 or 6 Gy of ionizing radiation (IR) and 19 nM human recombinant NAMPT for 4 d. Individual dots represent independent biological replicates. t test P-values: n.s., not significant; ***P-value < 1 × 10⁻³; ****P-value < 1 × 10⁻⁴.

References

    1. Adnani L, Kassouf J, Meehan B, Spinelli C, Tawil N, Nakano I, Rak J (2022) Angiocrine extracellular vesicles impose mesenchymal reprogramming upon proneural glioma stem cells. Nat Commun 13: 5494. 10.1038/S41467-022-33235-7 - DOI - PMC - PubMed
    1. Alexa A, Rahnenfuhrer J (2021) topGO: Enrichment Analysis for Gene Ontology. (R package version 2.46.0). Bioconductor. 10.18129/B9.bioc.topGO - DOI
    1. Alhalabi OT, Fletcher MNC, Hielscher T, Kessler T, Lokumcu T, Baumgartner U, Wittmann E, Schlue S, Göttmann M, Rahman S, et al. (2022) A novel patient stratification strategy to enhance the therapeutic efficacy of dasatinib in glioblastoma. Neuro-Oncology 24: 39–51. 10.1093/NEUONC/NOAB158 - DOI - PMC - PubMed
    1. Audrito V, Serra S, Brusa D, Mazzola F, Arruga F, Vaisitti T, Coscia M, Maffei R, Rossi D, Wang T, et al. (2015) Extracellular nicotinamide phosphoribosyltransferase (NAMPT) promotes M2 macrophage polarization in chronic lymphocytic leukemia. Blood 125: 111–123. 10.1182/BLOOD-2014-07-589069 - DOI - PubMed
    1. Bao S, Wu Q, McLendon RE, Hao Y, Shi Q, Hjelmeland AB, Dewhirst MW, Bigner DD, Rich JN (2006) Glioma stem cells promote radioresistance by preferential activation of the DNA damage response. Nature 444: 756–760. 10.1038/nature05236 - DOI - PubMed

Publication types