. 2023 Apr 10;41(4):807-817.e6.
doi: 10.1016/j.ccell.2023.03.005. Epub 2023 Apr 2.

T cell immune deficiency rather than chromosome instability predisposes patients with short telomere syndromes to squamous cancers

Affiliations

T cell immune deficiency rather than chromosome instability predisposes patients with short telomere syndromes to squamous cancers

Kristen E Schratz et al. Cancer Cell. .

Abstract

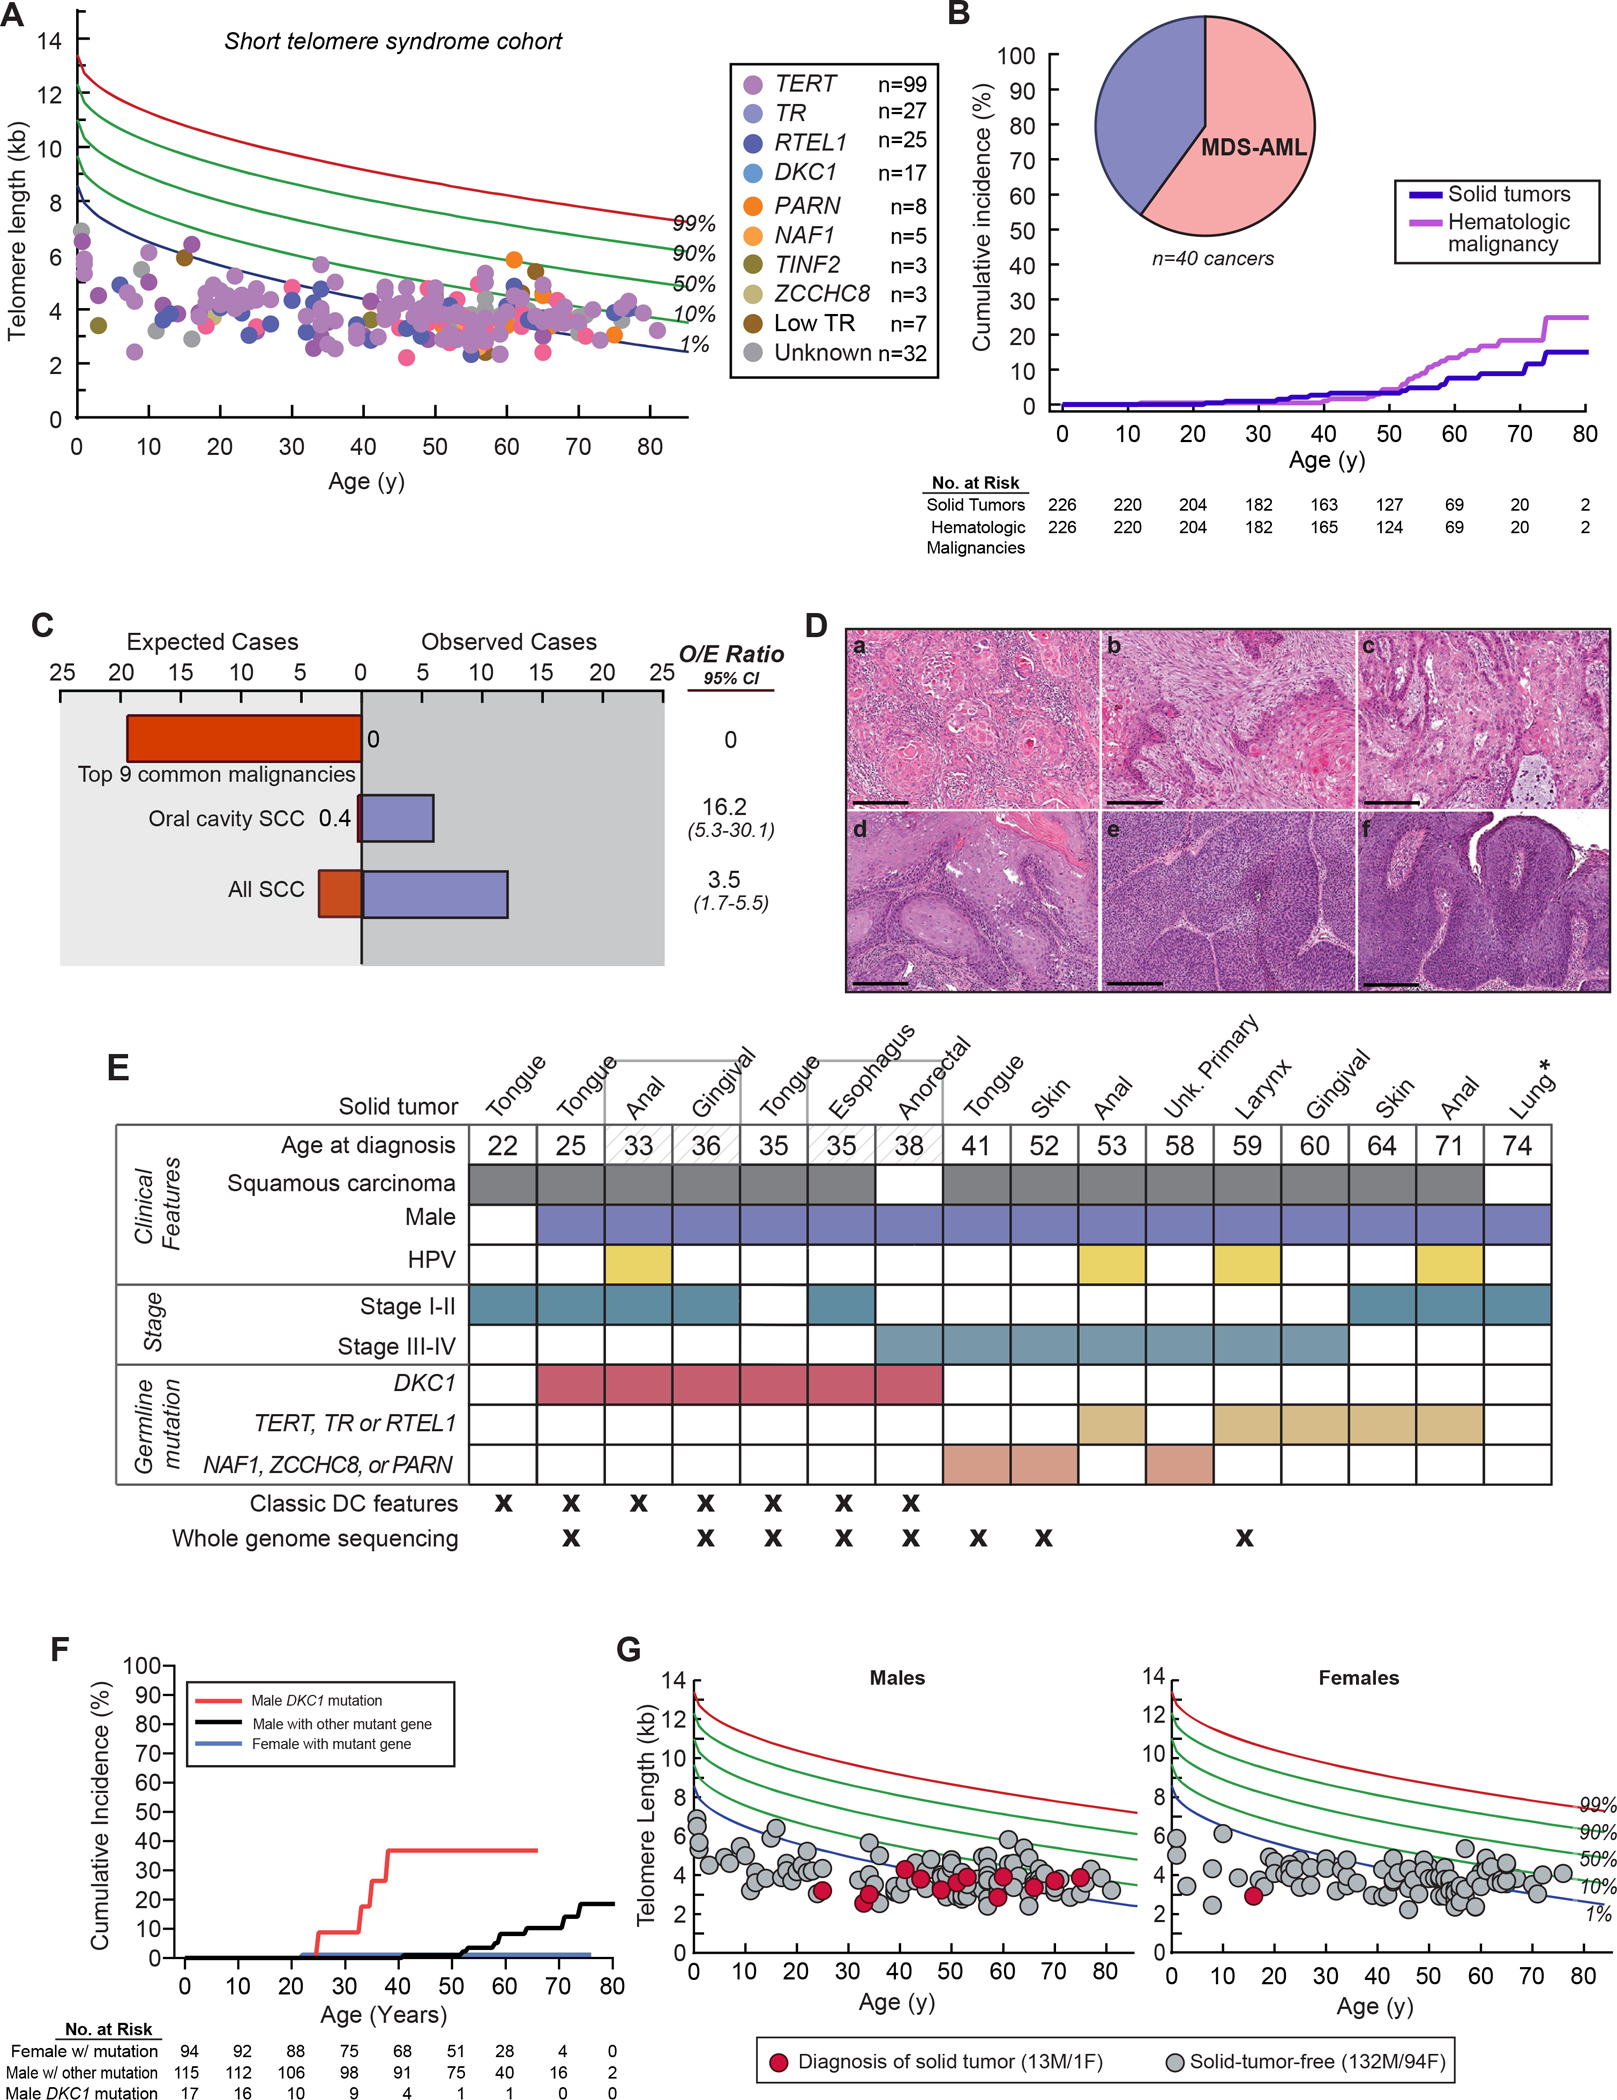
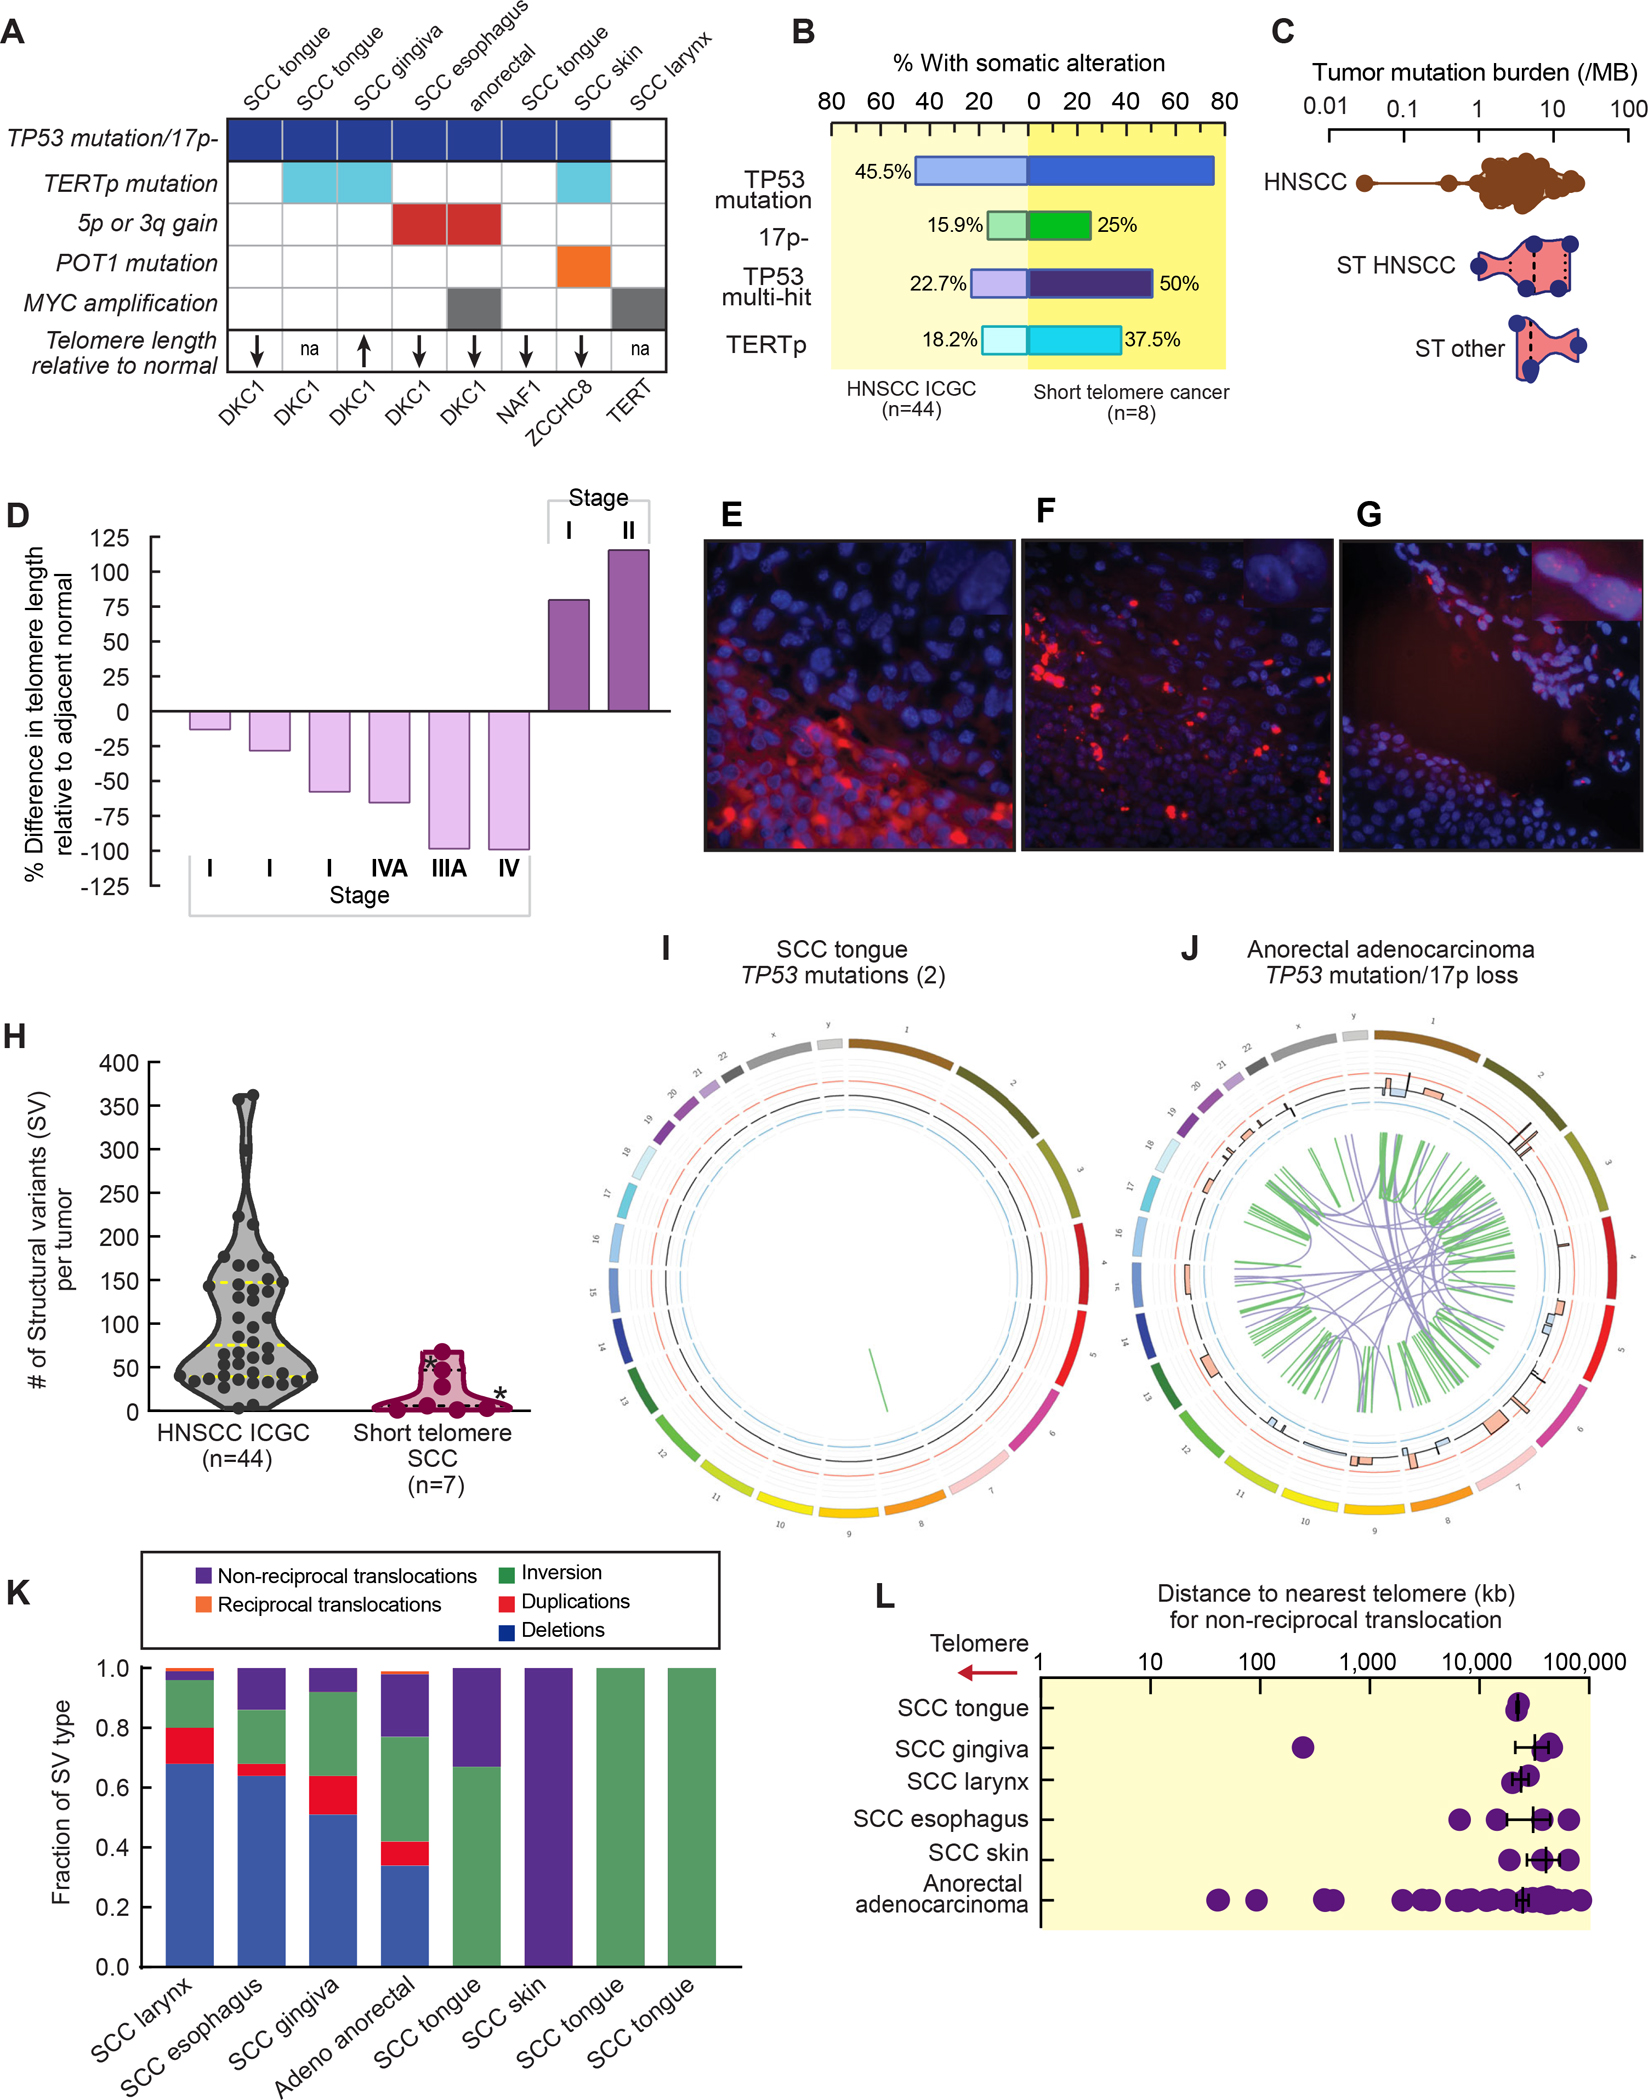
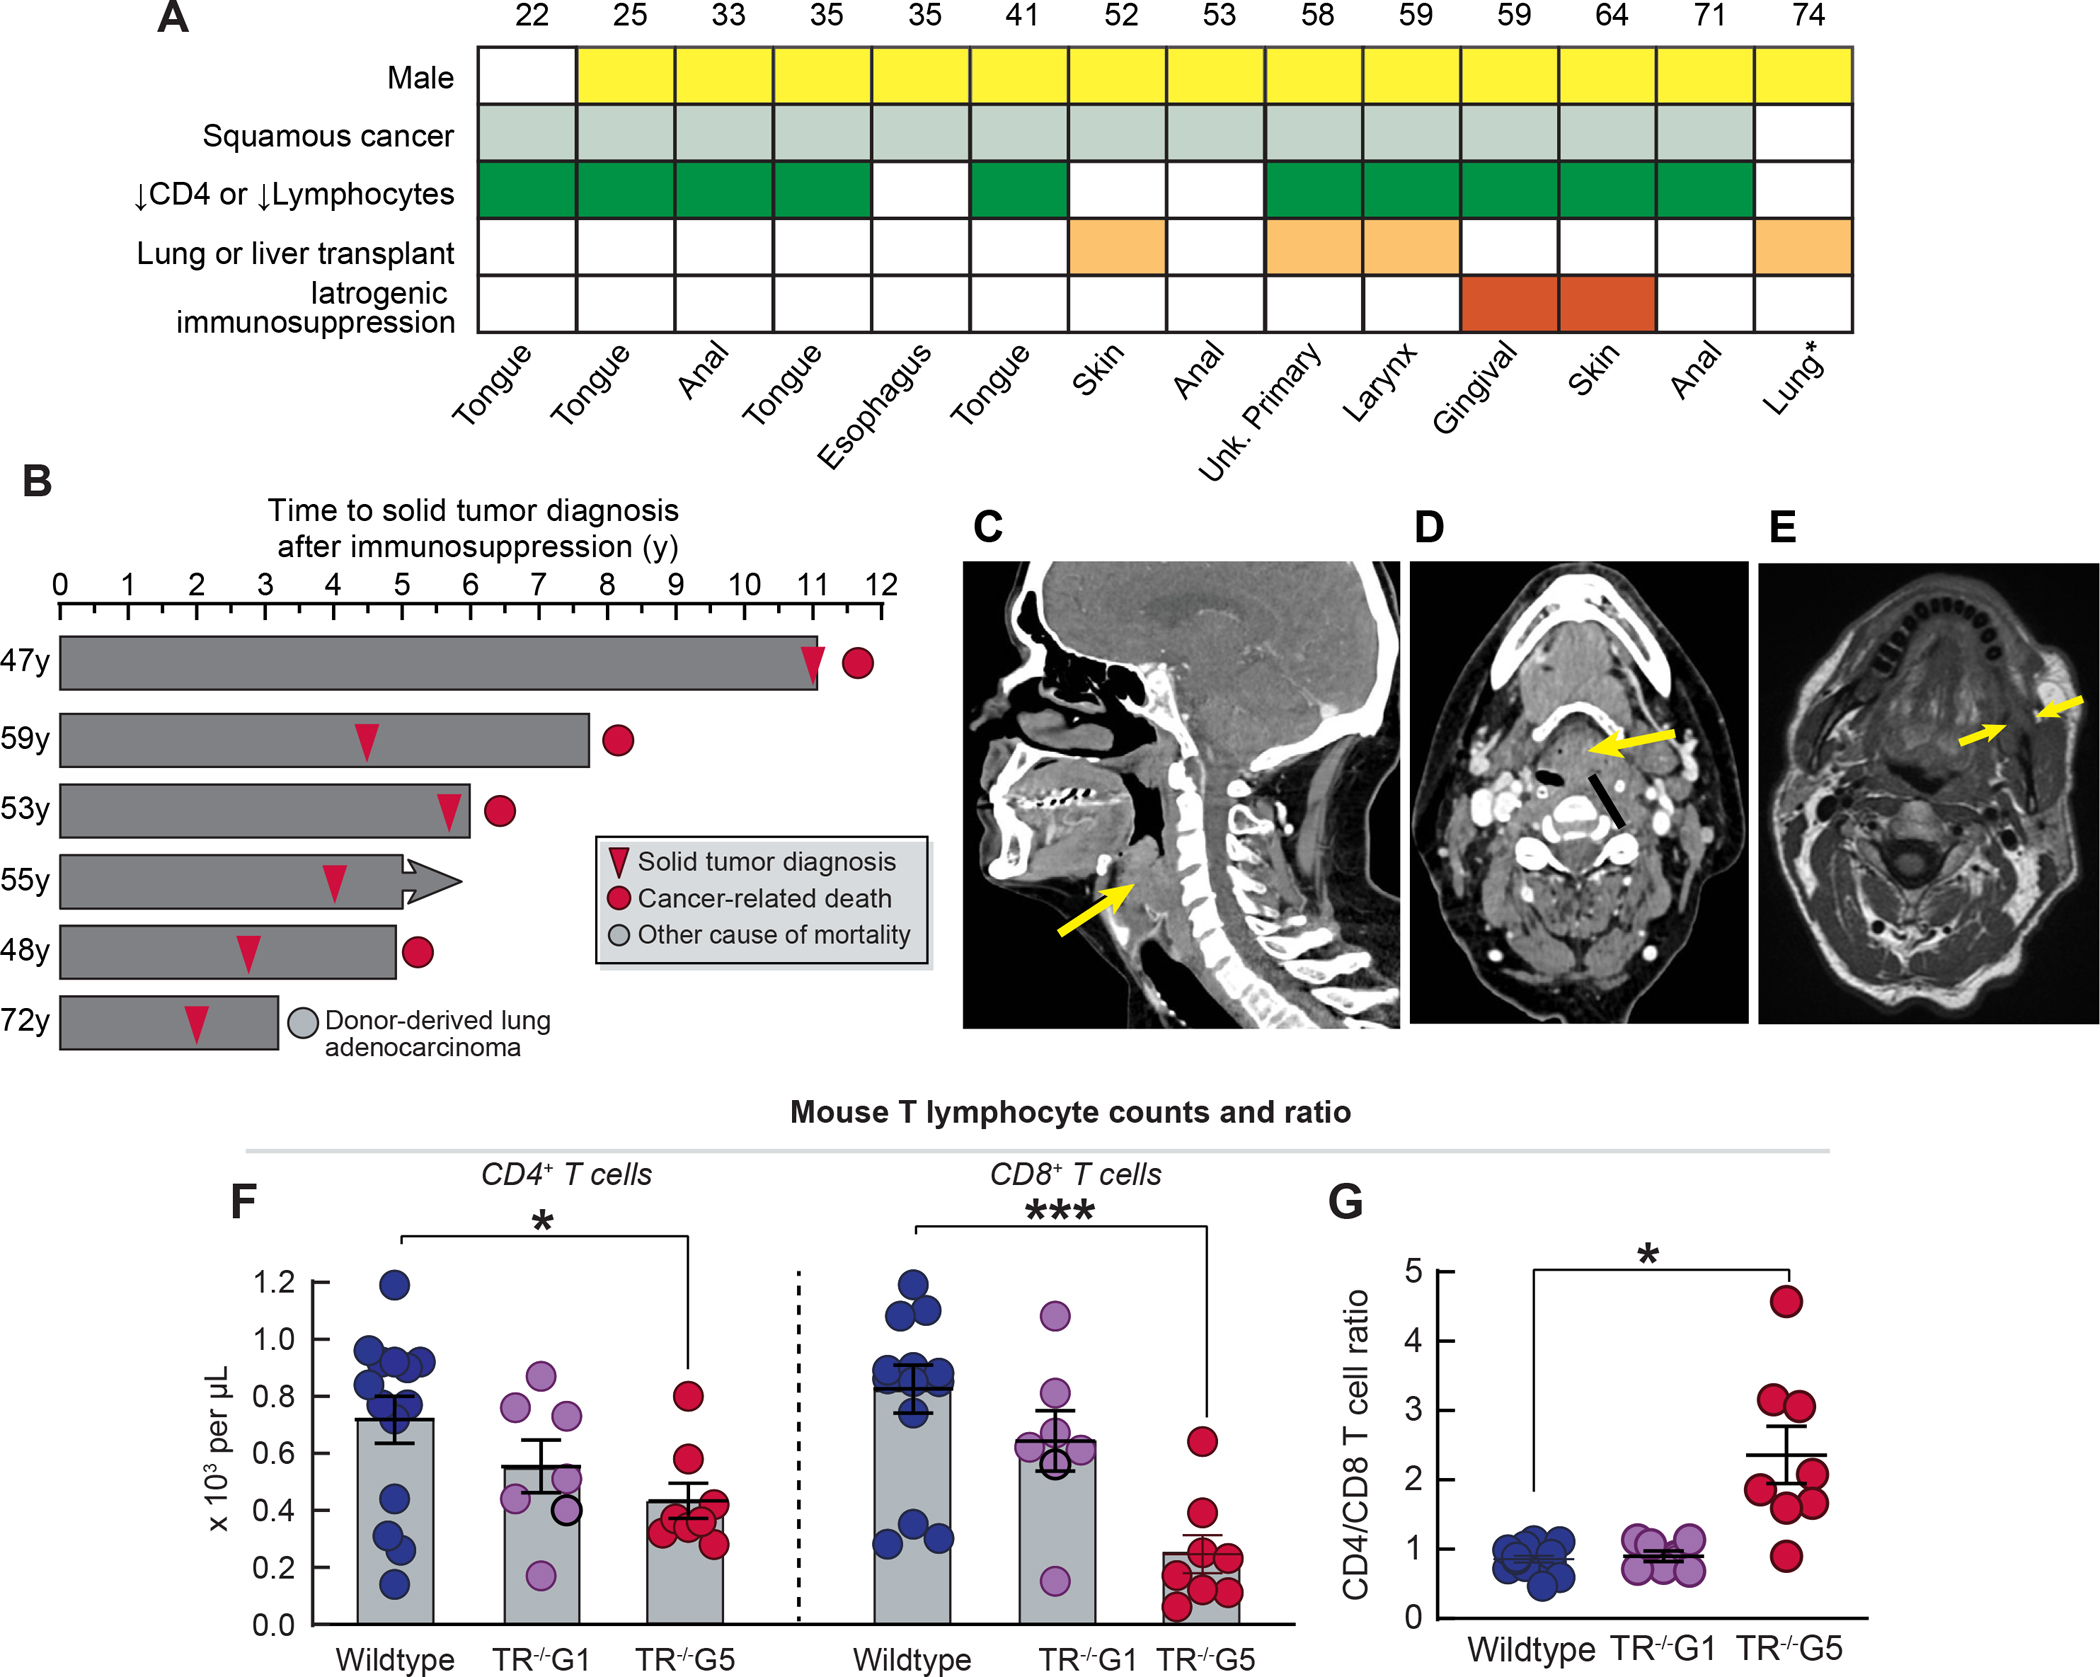
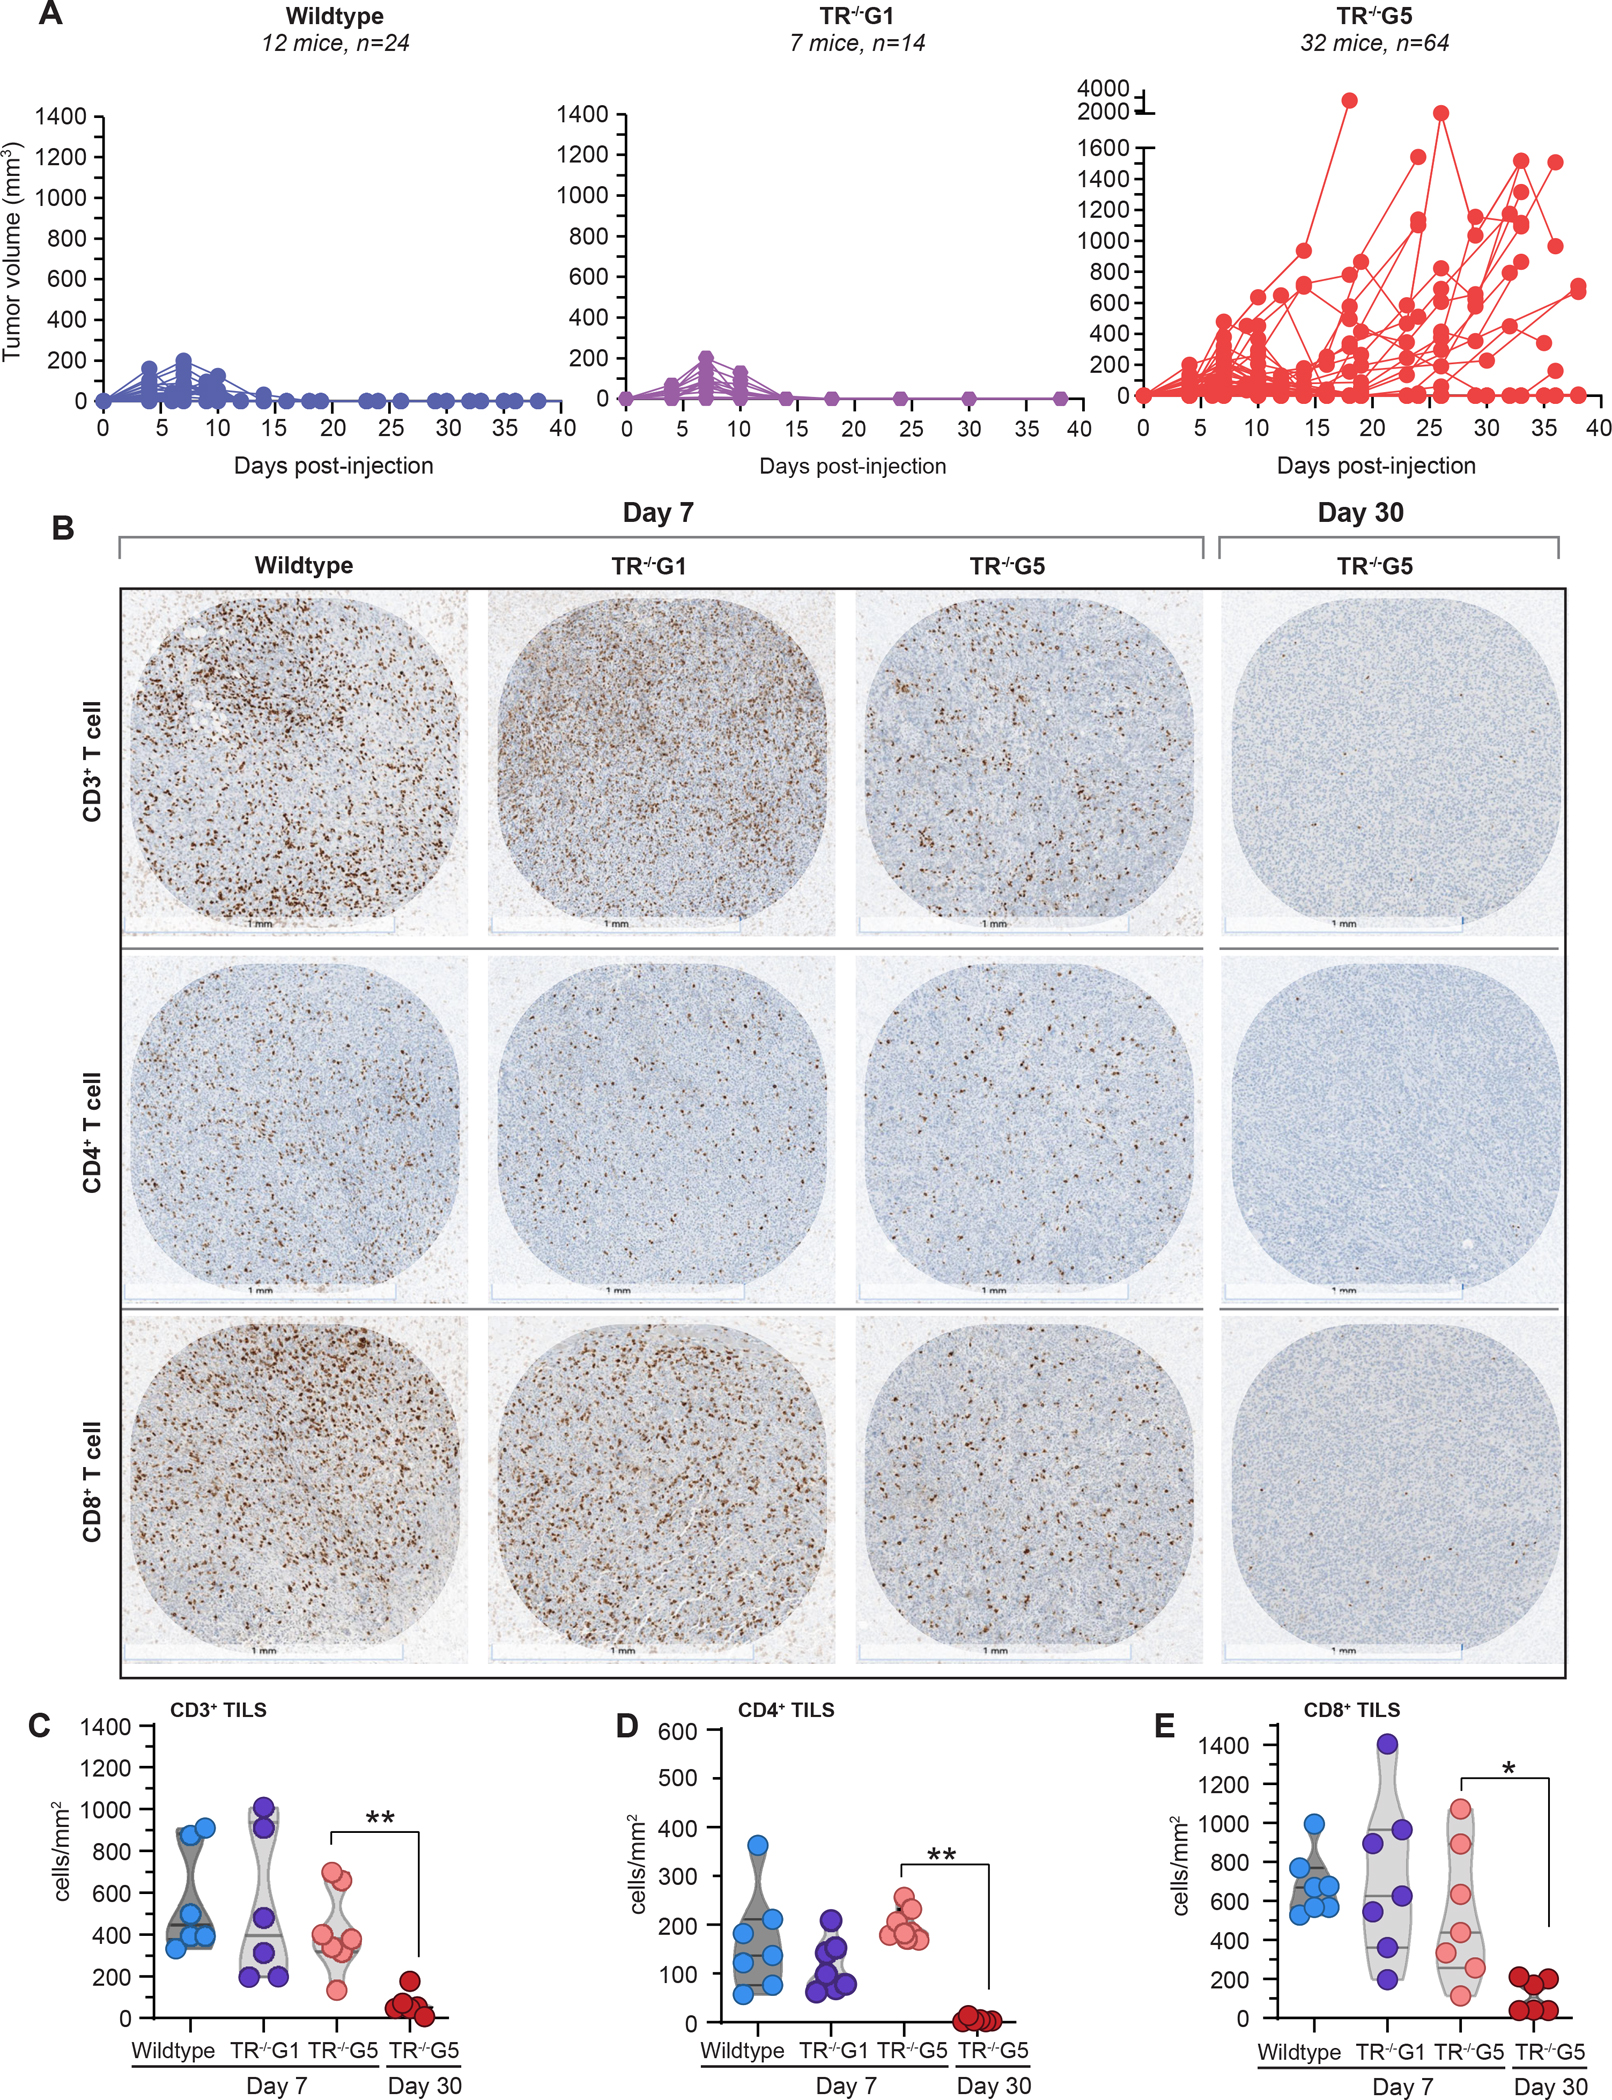
Patients with short telomere syndromes (STS) are predisposed to developing cancer, believed to stem from chromosome instability in neoplastic cells. We tested this hypothesis in a large cohort assembled over the last 20 years. We found that the only solid cancers to which patients with STS are predisposed are squamous cell carcinomas of the head and neck, anus, or skin, a spectrum reminiscent of cancers seen in patients with immunodeficiency. Whole-genome sequencing showed no increase in chromosome instability, such as translocations or chromothripsis. Moreover, STS-associated cancers acquired telomere maintenance mechanisms, including telomerase reverse transcriptase (TERT) promoter mutations. A detailed study of the immune status of patients with STS revealed a striking T cell immunodeficiency at the time of cancer diagnosis. A similar immunodeficiency that impaired tumor surveillance was documented in mice with short telomeres. We conclude that STS patients’ predisposition to solid cancers is due to T cell exhaustion rather than autonomous defects in the neoplastic cells themselves.

Keywords: T cell aging; aging; genome instability; head and neck cancer; immune aging; pulmonary fibrosis; senescence; telomerase.


Conflict of interest statement

Declaration of interests R.H.V. is an inventor on licensed patents related to cancer cellular immunotherapy and cancer vaccines, receives royalties from Boston Children’s Hospital for a licensed research-only monoclonal antibody, and has received consulting fees from Bristol Myers Squibb.

Figures

Figure 1.
Figure 1.. Cancer risk in the short telomere syndromes.
A. Telogram of individuals in the Johns Hopkins Telomere Syndrome Registry with each individual’s germline mutant gene (key) relative to the age-adjusted, clinically validated nomogram (reference 17). Data are shown for 217 of 226 individuals for whom lymphocyte telomere length data were available. B. Cumulative incidence of hematologic malignancies and solid tumors by age accounting for competing risk of death. Pie chart in left upper corner shows distribution of 40 cancers identified in 35 individuals. C. Observed cases of cancer in the Short Telomere Syndrome study participants relative to expected as derived from the Surveillance, Epidemiology, and End Results (SEER) Database and corrected for age and sex. The observed/expected (O/E) ratio is shown to the right. Lung cancer squamous cell cancer (SCC) was excluded from the all SCC comparison. D. Representative hematoxylin and eosin images (100x) of solid tumors: a. primary SCC of tongue, b. tongue SCC with involved local lymph node, c. lip invasive SCC with perineural invasion, d. gingival SCC, e. larynx SCC, and f. anal squamous carcinoma in situ of gluteal cleft which later progressed to anal SCC. Scale bars indicate 250 μm. E. Clinical characteristics of 14 individuals with 16 cancers (2 individuals with two malignancies are noted by brackets). HPV status was by determined by whole genome sequencing, and for anal cancers, was presumed positive given known association. *Denotes a donor-derived lung adenocarcinoma that developed after transplantation for pulmonary fibrosis. F. Cumulative incidence of cancers in male DKC1 mutation carriers relative to males and females with non-DKC1 mutations. G. Prevalence of all solid tumors in males (M) and females (F) in the Johns Hopkins study relative to age at the time of study enrollment and telomere length. Nine individuals who did not have telomere data are not included, but they had no invasive cancer diagnoses (7 M, 2 F). See also Table S1–S3.
Figure 2.
Figure 2.. Somatic landscape of solid tumors arising in the short telomere syndromes.
A. TP53 alterations and telomere maintenance mechanisms analyzed by whole genome sequencing. Bottom row shows relative telomere length differences for tumors available for measurement compared to normal as summarized in panel D. B. Somatic alteration frequencies relative to 44 Head and Neck Squamous Cell Carcinoma (HNSCC) from the International Cancer Genome Consortium (ICGC) (n=44 total, median age 57, 52% oral cavity SCC). C. Tumor mutation burden (TMB), calculated as the number of non-synonymous single nucleotide variants and indels per Mb of coding region, is plotted relative to HNSCC ICGC data. Plots showing distribution are truncated at the minimum and maximum values; dashed line marks the median with dotted lines marking the 25th and 75th percentiles. D. Relative change in telomere length as measured by quantitative fluorescence in situ hybridization (Q-FISH) of tumors and surrounding normal tissue. E-G. Representative fluorescence microscopy images (100x) with tumor (T) and normal (N) delineated respectively. Telomere fluorescent probe is in red and DAPI in blue. Scale bars indicate 50 μm. H. Number of structural variants (SVs) in short telomere syndrome SCC relative to HNSCC ICGC tumors with mean and 25th and 75th percentile lines marked. *Denotes the SCC of skin and esophagus. I and J. Two representative circos plots showing the spectrum of genomic alterations in specified short telomere solid tumors with listed TP53 status above. Remaining circos plots are in Figure S4. K. Proportion of SV types for each tumor are shown. L. Shortest distance from each translocation breakpoint to the start of the nearest telomere region plotted. Mean with standard error of the mean are shown. See also Fig. S1–S2 and Table S4.
Figure 3.
Figure 3.. Short telomere patients with solid tumors have T cell immunodeficiency.
A. T cell immunodeficiency, both primary and secondary (in some cases both), in 14 individuals with germline mutations in telomere maintenance genes who developed solid tumors. B. Swimmer plot shows interval in years from initiation of immunosuppression to diagnosis of solid tumor in 6 individuals: 4 who underwent solid organ transplant, and 2 who were treated with immunosuppression for presumed autoimmune disease. C and D. Sagittal and axial computed tomography images (respectively) for a TERT mutation carrier who was diagnosed with a laryngeal squamous cancer (arrows) after lung transplantation for idiopathic pulmonary fibrosis. Images show rightward tracheal displacement due to mass effect. E. Sagittal magnetic resonance image of gingival squamous cell cancer (arrow) diagnosed after initiation of mycophenolate for hypersensitivity pneumonitis prior to short telomere syndrome diagnosis. F. Peripheral blood absolute CD4+ and CD8+ T cell counts in wildtype, TR−/−G1 and TR−/−G5 mice. G. CD4:CD8 ratio of mice in panel F. Mice were on average 16 weeks (range 5–23): Wildtype [7 males (M)/7 females (F)], TR−/−G1 (5M/2F), and TR−/−G5 (3M/5F). For F and G, mean and standard error of the mean are plotted. *P<0.05 and ***P<0.001 (Student’s t-test, two-sided). See also Table S5.
Figure 4.
Figure 4.. Impaired immune surveillance of tumors in late generation telomerase null mice is associated with T cell exhaustion.
A. Tumor volume relative in mice injected with OvaB6 tumorigenic cells subcutaneously. Each line represents tumor size measured over the time course in one flank. Mice studied were on average 16 weeks old (range 6–24): Wildtype [24 flanks, 12 mice, 6 male (M)/6 female (F)], TR−/−G1 (14 flanks, 7 mice, 4M/3F), TR−/−G5 (64 flanks, 32 mice, 16M/16F). B. CD3, CD4 and CD8 immunohistochemistry in tumors harvested at each time point and for each genotype shown in panel A. At day 7, tumors showed comparable burdens of tumor infiltrating T lymphocytes (TILs) but TILs subsequently vanished by day 30 in TR−/−G5 tumors. Scale bar below each image refers to 1 mm. C-E. TIL quantification per tumor area at the timepoints shown in panel B. Violin plots with median and 25th/75th percentile lines marked. For day 7, wildtype (n=6–7 flanks, 4 mice, 2M/2F), TR−/−G1 (6–7 flanks, 7 mice, 5M/2F), and TR−/− G5 (7 flanks, 5 mice, 3M/2F) are shown. For day 30, data for TR−/−G5 (6 flanks, 4 mice, 2M/2F) are shown. **P<0.01 and ***P<0.001 (Mann-Whitney test, corrected for multiple comparisons). See also Fig. S3.

References

    1. Siegel RL, Miller KD, Fuchs HE, and Jemal A (2021). Cancer Statistics, 2021. CA Cancer J Clin 71, 7–33. 10.3322/caac.21654. - DOI - PubMed
    1. Allsopp RC, Vaziri H, Patterson C, Goldstein S, Younglai EV, Futcher AB, Greider CW, and Harley CB (1992). Telomere length predicts replicative capacity of human fibroblasts. Proc Natl Acad Sci U S A 89, 10114–10118. - PMC - PubMed
    1. Chin L, Artandi SE, Shen Q, Tam A, Lee SL, Gottlieb GJ, Greider CW, and DePinho RA (1999). p53 deficiency rescues the adverse effects of telomere loss and cooperates with telomere dysfunction to accelerate carcinogenesis. Cell 97, 527–538. S0092–8674(00)80762-X [pii]. - PubMed
    1. d’Adda di Fagagna F, Reaper PM, Clay-Farrace L, Fiegler H, Carr P, Von Zglinicki T, Saretzki G, Carter NP, and Jackson SP (2003). A DNA damage checkpoint response in telomere-initiated senescence. Nature 426, 194–198. - PubMed
    1. Lee HW, Blasco MA, Gottlieb GJ, Horner JW 2nd, Greider CW, and DePinho RA (1998). Essential role of mouse telomerase in highly proliferative organs. Nature 392, 569–574. - PubMed

Publication types