. 2023 Apr 10;14(1):2014.
doi: 10.1038/s41467-023-37801-5.

Performance efficient macromolecular mechanics via sub-nanometer shape based coarse graining

Affiliations

Performance efficient macromolecular mechanics via sub-nanometer shape based coarse graining

Alexander J Bryer et al. Nat Commun. .

Abstract

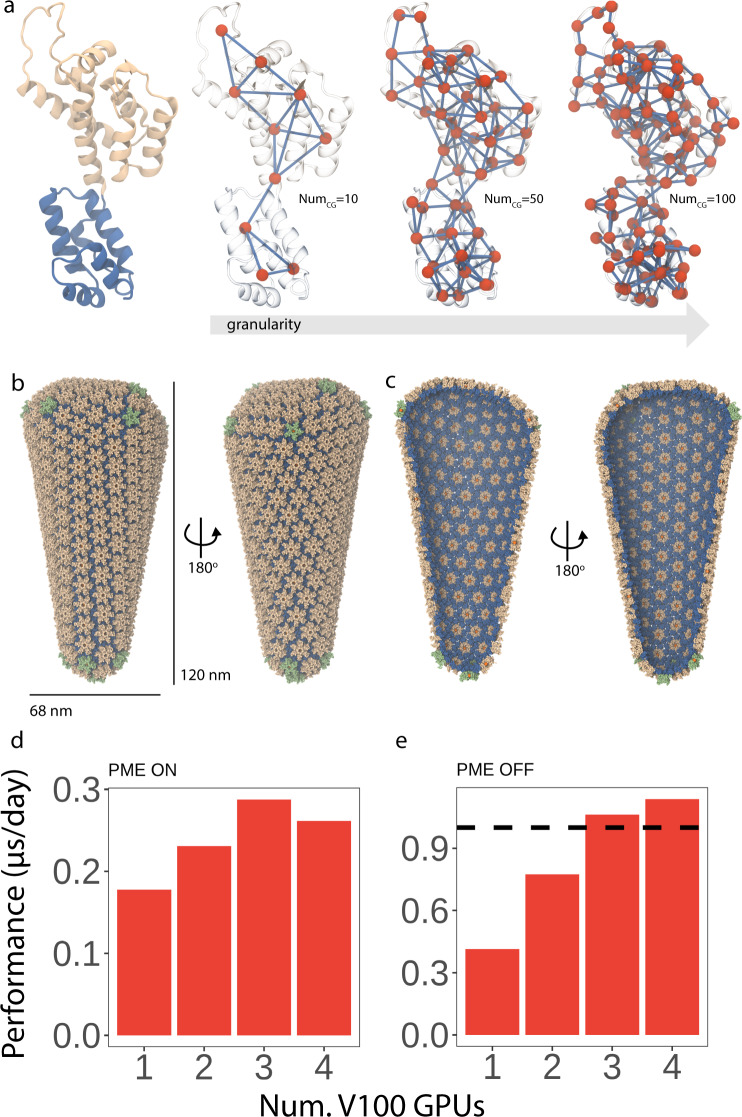
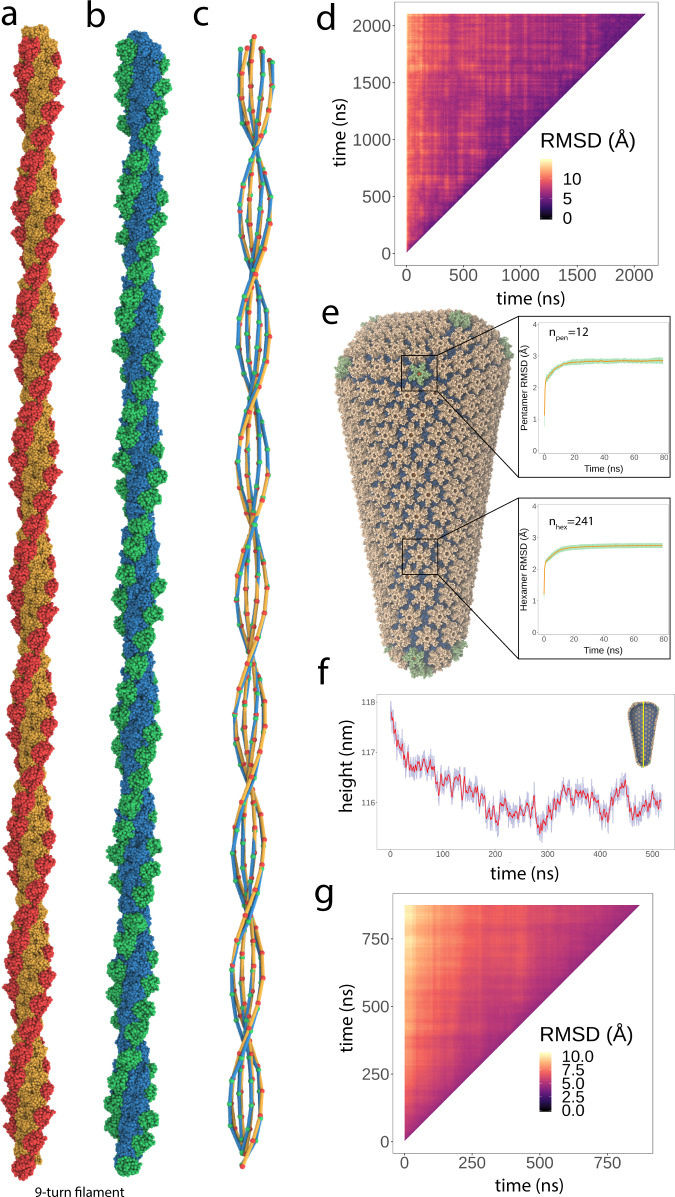
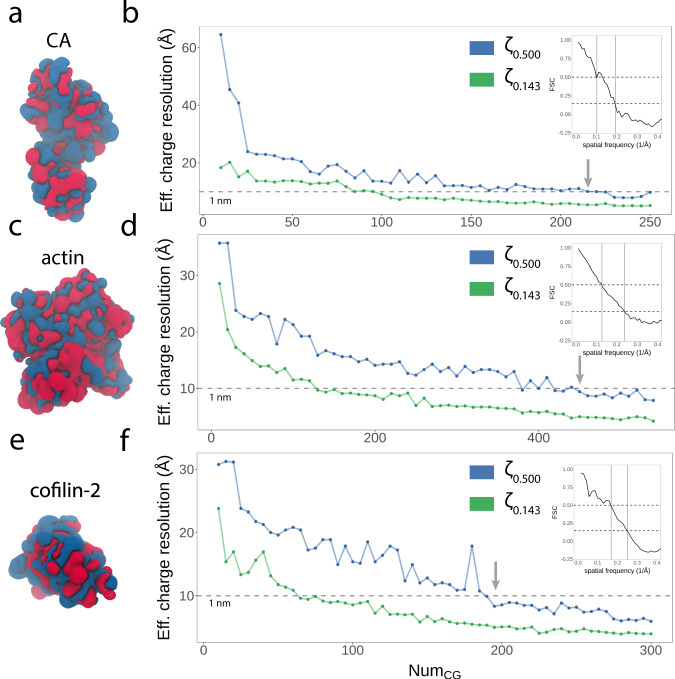
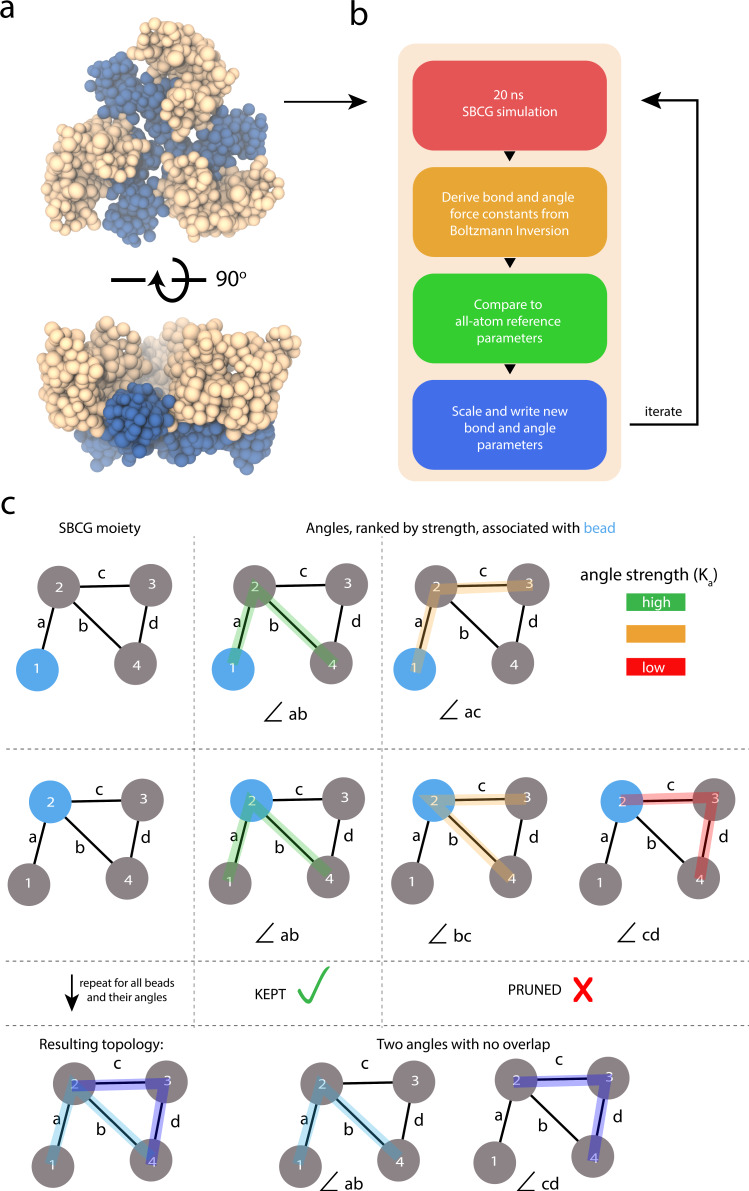
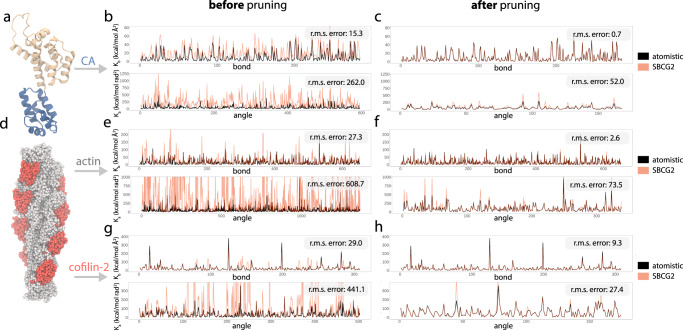
Dimensionality reduction via coarse grain modeling is a valuable tool in biomolecular research. For large assemblies, ultra coarse models are often knowledge-based, relying on a priori information to parameterize models thus hindering general predictive capability. Here, we present substantial advances to the shape based coarse graining (SBCG) method, which we refer to as SBCG2. SBCG2 utilizes a revitalized formulation of the topology representing network which makes high-granularity modeling possible, preserving atomistic details that maintain assembly characteristics. Further, we present a method of granularity selection based on charge density Fourier Shell Correlation and have additionally developed a refinement method to optimize, adjust and validate high-granularity models. We demonstrate our approach with the conical HIV-1 capsid and heteromultimeric cofilin-2 bound actin filaments. Our approach is available in the Visual Molecular Dynamics (VMD) software suite, and employs a CHARMM-compatible Hamiltonian that enables high-performance simulation in the GPU-resident NAMD3 molecular dynamics engine.


Conflict of interest statement

The authors declare no competing interests.

Figures

Fig. 1
Fig. 1. Shape-based coarse-grained 2 (SBCG2) HIV-1 capsid.
a View of the HIV-1 CA monomer, left, colored by domain. On the right, three corresponding SBCG2 models of HIV-1 CA with increasing granularity. Granularity, in this case, refers to the number of beads employed to model the structure. b Full view of the SBCG2 HIV-1 conical capsid, shown from two perspectives. c Clipped view of the SBCG2 HIV-1 conical capsid, shown from two perspectives. For panels b and c, protein is shown as vdW beads, with the CA amino-terminal domains colored tan and the CA carboxy-terminal domains colored blue. IP6 beads are shown as orange vdW spheres,. d, e Performance benchmarks with NAMD3, simulating the HIV-1 conical capsid shown in panels c and d. Benchmarks were performed with one CPU per GPU employed. For both benchmarks, an identical configuration was employed, and only the usage of PME for long-range electrostatics varied. The time step employed was 48 fs per step; Langevin γ was set to 2.0 ps−1; bonded interactions were evaluated every time step and nonbonded interactions were evaluated every other time step. d NAMD3 GPU benchmarks, utilizing NVIDIA V100s, with PME on. Peak performance of nearly 300 ns per day represents a threefold speedup over peak CPU-only simulation performance, which employed as many as ten compute nodes (Supplementary Fig. 2). e NAMD3 GPU benchmarks, utilizing NVIDIA V100s, with PME off. Remarkably, for three and four GPUs per simulation, we exceed one microsecond per day simulation performance (dashed line). Benchmarks reported are the mean value of the six benchmark metrics reported by NAMD3 for each simulation.
Fig. 2
Fig. 2. SBCG2 heteromultimeric cofilin-2 on actin filaments.
a Left, atomistic surface representation of globular actin (white) bound to cofilin-2 (red). Right, corresponding SBCG2 representations of actin and cofilin-2, are shown superimposed with the atomistic molecular surfaces. b A single turn of the SBCG2 cofilin-2-bound actin filament, shown from two perspectives. One turn corresponds to a length of 31 nm. c The SBCG2 cofilin-2-bound actin filament is superimposed with the atomistic molecular surface, shown transparently. The shape of the atomistic filament is perfectly represented by the coarse model. d NAMD3 GPU benchmarks, utilizing NVIDIA V100s with PME on. e NAMD3 GPU benchmarks, utilizing NVIDIA V100s, with PME off. For panels d and e, we performed benchmark simulations with 3-, 9-, and 54-turn filaments to assess load-balancing and scaling with respect to system size. A legend is provided on the right. Benchmarks reported are the mean value of the six benchmark metrics reported by NAMD3 for each simulation.
Fig. 3
Fig. 3. Stability of full-scale SBCG2 multimeric assemblies.
ad Cofilin-2 on actin filaments. a Initial state of the nine-turn cofilin-2-bound actin filament model, ~250 nm in length. b The nine-turn filament from panel a after unrestrained energy minimization, thermalization, equilibration, and ~200 ns of sampling at 298 K. c Visualization of the nine-turn filament’s helicity computed at two time points (panels a and b). For each cofilin-2 and actin subunit comprising the assembly, the center of mass is computed and a line is drawn to its sequential neighbor along the filament’s length. The inner and outer double helices represent actin and cofilin-2, respectively. Colors correspond to the states in panels a and b. The helical character of the filament is well-maintained throughout molecular sampling. d Pairwise RMSD heatmap of the entire three-turn filament (colored according to the legend provided). The analysis compares every pair of structures from a 2 µs SBCG2 trajectory, yielding a matrix where every element is the RMSD between two three-turn filaments. The filament achieves stability (<5 Å RMSD) after roughly 200 ns. eg HIV-1 conical capsid. e Pentamer and hexamer RMSD analysis from the full-scale SBCG2 conical capsid. For an 80 ns equilibrium sampling trajectory, each capsomer was aligned to a single reference. The RMSD of each capsomer from the reference hexamer or pentamer was computed and the mean (orange) and standard deviation (green) was plotted across the trajectory. After approximately 20 ns, both hexamers and pentamers conform to the reference capsomer within 3 Å agreement. f Height time series of the conical capsid over 500 ns. The inset diagram illustrates the determination of height via the capsid’s principal axis of inertia. The capsid’s height converges after approximately 300 ns, and fluctuations <1 Å are seen thereafter. g Pairwise RMSD heatmap of the entire conical capsid (colored according to the legend provided). The analysis compares every pair of structures from a 900 ns SBCG2 trajectory, yielding a matrix where every element is the RMSD between two complete capsids. The analysis indicates that the capsid achieves stability (<5 Å RMSD) after roughly 300 ns.
Fig. 4
Fig. 4. Application of shape-based coarse-graining 2 (SBCG2) to mechanical stress simulations of the HIV-1 conical capsid via constant velocity-steered molecular dynamics.
a Snapshots of the capsid during internal rupture. First snapshot, where an internally-bound sphere of inert particles makes contact with the capsid surface and begins to deform the molecular surface. This deformation resides within the elastic deformation regime. The next snapshot in the sequence shows the beginnings of mechanical failure, once the capsid has deformed to an extent where fractures begin to manifest. The final snapshot shows the mechanical failure fully manifest, as the internally-bound probe punches through the capsid surface. b Snapshots of the capsid during nanoindentation. The initial state of the capsid, immediately prior to probe contact. The next snapshot shows the point of maximum deformation. Successively, retraction of the probe begins. In the final snapshot, the fully-recovered capsid is shown and the probe is out of view. c Force vs. Z (displacement) profile collected during internal rupture. This curve shows the evolution of forces through several viscoelastic regimes. d Force vs. Z (displacement) profile collected during nanoindentation, which utilized a tenfold increase in probe velocity. This curve is much smoother and displays a higher magnitude of forces acting on the probe, demonstrating the effect of velocity when performing such simulations. It should be noted that for both proof-of-concept simulations, the employed velocities, and therefore the measured forces, are significantly higher than what would be resolved with experimental AFM.
Fig. 5
Fig. 5. FSC analysis of SBCG2 granularity vs. effective charge density resolution.
a Charge density of the all-atom reference structure of HIV-1 CA. Regions of positive and negative charge density are colored blue and red, respectively. b Effective charge density resolutions via FSC for models NumCG ∈ [10, 250], plotted with two metrics: ζ0.143 and ζ0.500, green and blue, respectively. The dotted gray line represents a resolution of 1 nm, and the gray arrow indicates the first sub-nanometer model in the series. The inset plot shows the FSC vs. spatial frequency trace for HIV-1 CA with NumCG = 250. c Charge density of the all-atom reference structure of actin and d corresponding effective charge density analysis for actin models with NumCG ∈ [10, 540]. The inset plot corresponds to the FSC vs. spatial frequency trace for actin with NumCG = 540. e Charge density of the all-atom reference structure of cofilin-2 and f corresponding effective charge density analysis for cofilin-2 models with NumCG ∈ [10, 300]. The inset plot corresponds to the FSC vs. spatial frequency trace for cofilin-2 with NumCG = 540.
Fig. 6
Fig. 6. Graphical overview of our SBCG2 model refinement protocol.
a SBCG2 HIV-1 CA trimer of dimers, utilized for successive 20 ns simulations during iterative refinement. The N-terminal domain is colored tan, and the C-terminal domain is colored blue. b The iterative parameter refinement procedure via Boltzmann inversion. For one iteration, 20 ns of equilibrium sampling is collected at 298 K. Next, bond and angle force constants are derived via Boltzmann inversion (eq. (5)). Parameters derived from the SBCG2 model simulation are then compared to the all-atom reference parameters and are scaled by their error (eq. (7)). Finally, new bond and angle parameters are written and employed for the succeeding refinement iteration. c Graphical example of the pruning procedure employed in refining our model. This example shows an SBCG2 structure of four beads enumerated 1 through 4 and four bonds a through d. Initially, angles are determined exhaustively based on the bonded connectivity. For each bead, we rank its associated angle parameters by their constants, Ka, and keep only the strongest parameter. This example demonstrates that our algorithm permits two beads to share the same force constant, if it is deemed the strongest for each bead.
Fig. 7
Fig. 7. SBCG2 bond and angle parameter optimization results for HIV-1 CA, actin, and cofilin-2.
a Monomeric HIV-1 CA all-atom structure, shown in cartoon representation. b, c Corresponding bond and angle parameter fits following from iterative Boltzmann inversion. The black traces show the atomistic bond and angle parameter trace as computed via Boltzmann inversion from the all-atom reference trajectory, and orange the SBCG2 bond and angle parameter trace via Boltzmann inversion from the simulation corresponding to the final refinement iteration b before pruning and c after pruning. d Atomistic surface representation of cofilin-2 bound to one turn of actin. e, f Actin bond and angle parameter fits following from iterative Boltzmann inversion e before pruning and f after pruning. g, h Cofilin-2 bond and angle parameter fits following from iterative Boltzmann inversion g before pruning and h after pruning. The root-mean-square error between the SBCG2 bond and angle parameters and their respective all-atom reference parameters are annotated within each plot.
Fig. 8
Fig. 8. Topology-preserving maps via 3D Voronoi tessellation.
a A 30-point cloud in 3D, generated randomly in a cubic domain. b Resulting 3D Voronoi tessellation of the point cloud in panel a. Each Voronoi cell partitions the spatial domain into regions that are closer to a given point than any other. Voronoi tessellation was performed with the voro++ command-line tool and rendering was performed with the Persistence of Vision raytracer. c Visual depiction and definition of a topology-preserving map. The input pattern (green) consists of four points, enumerated i–iv. The coarse mapping groups two input points into a single coarse point (red), named u and v. The resulting mapping is topology preserving if adjacent features in the input pattern are adjacent in the output map. In this case, coarse point u maps to input points i and ii; coarse point v maps to points iii and iv; u and v bound adjacent groups of the input pattern and are adjacent in the output map.

References

    1. Perilla JR, et al. Molecular dynamics simulations of large macromolecular complexes. Curr. Opin. Struct. Biol. 2015;31:64–74. doi: 10.1016/j.sbi.2015.03.007. - DOI - PMC - PubMed
    1. Shaw DE, et al. Anton, a special-purpose machine for molecular dynamics simulation. Commun. ACM. 2008;51:91–97. doi: 10.1145/1364782.1364802. - DOI
    1. Levitt M, Warshel A. Computer simulation of protein folding. Nature. 1975;253:694–698. doi: 10.1038/253694a0. - DOI - PubMed
    1. Cramer, C. J. Essentials of Computational Chemistry: Theories and Models (John Wiley & Sons, 2013).
    1. Nielsen SO, Lopez CF, Srinivas G, Klein ML. Coarse grain models and the computer simulation of soft materials. J. Phys. Condens. Matter. 2004;16:R481. doi: 10.1088/0953-8984/16/15/R03. - DOI