. 2023 Apr 10;14(1):2016.
doi: 10.1038/s41467-023-37651-1.

KIAA1199 deficiency enhances skeletal stem cell differentiation to osteoblasts and promotes bone regeneration

Affiliations

KIAA1199 deficiency enhances skeletal stem cell differentiation to osteoblasts and promotes bone regeneration

Li Chen et al. Nat Commun. .

Abstract

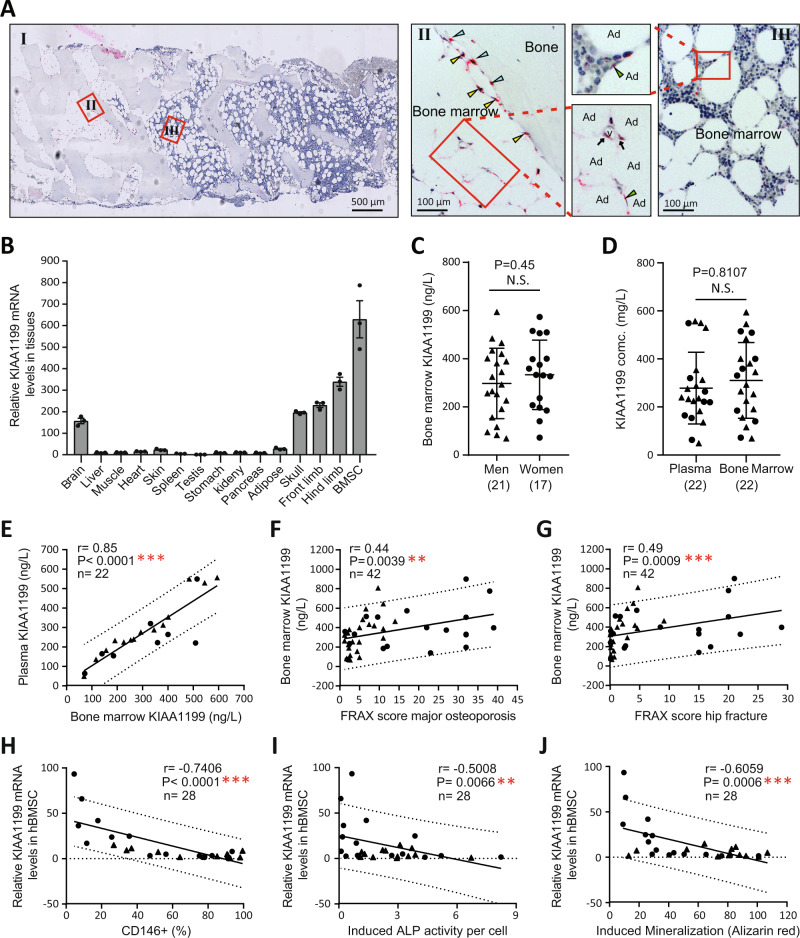
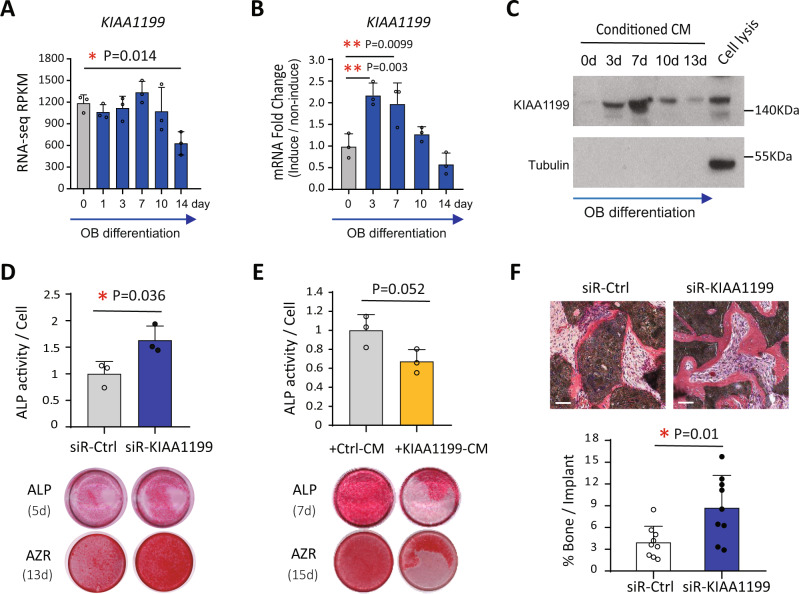
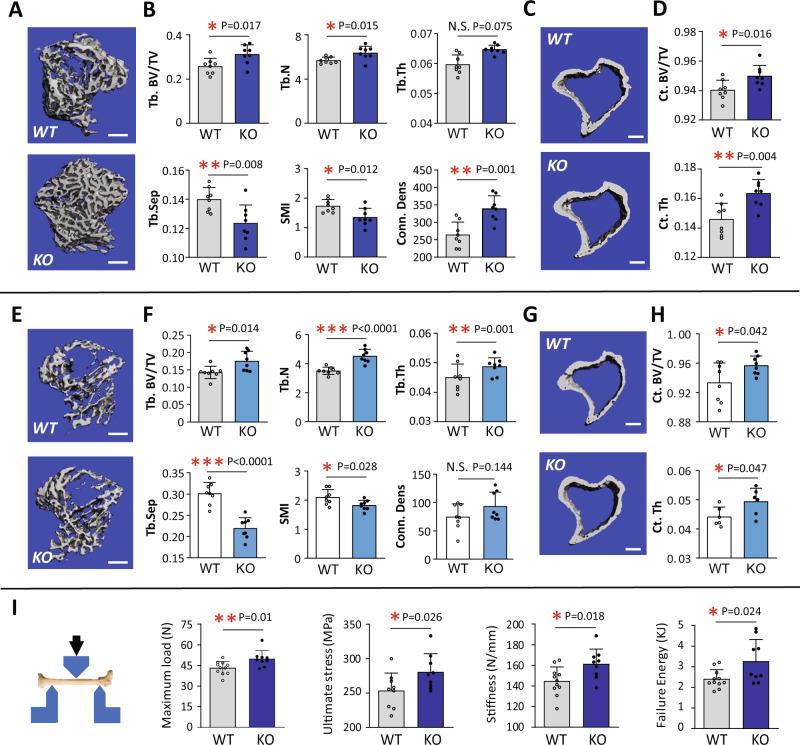
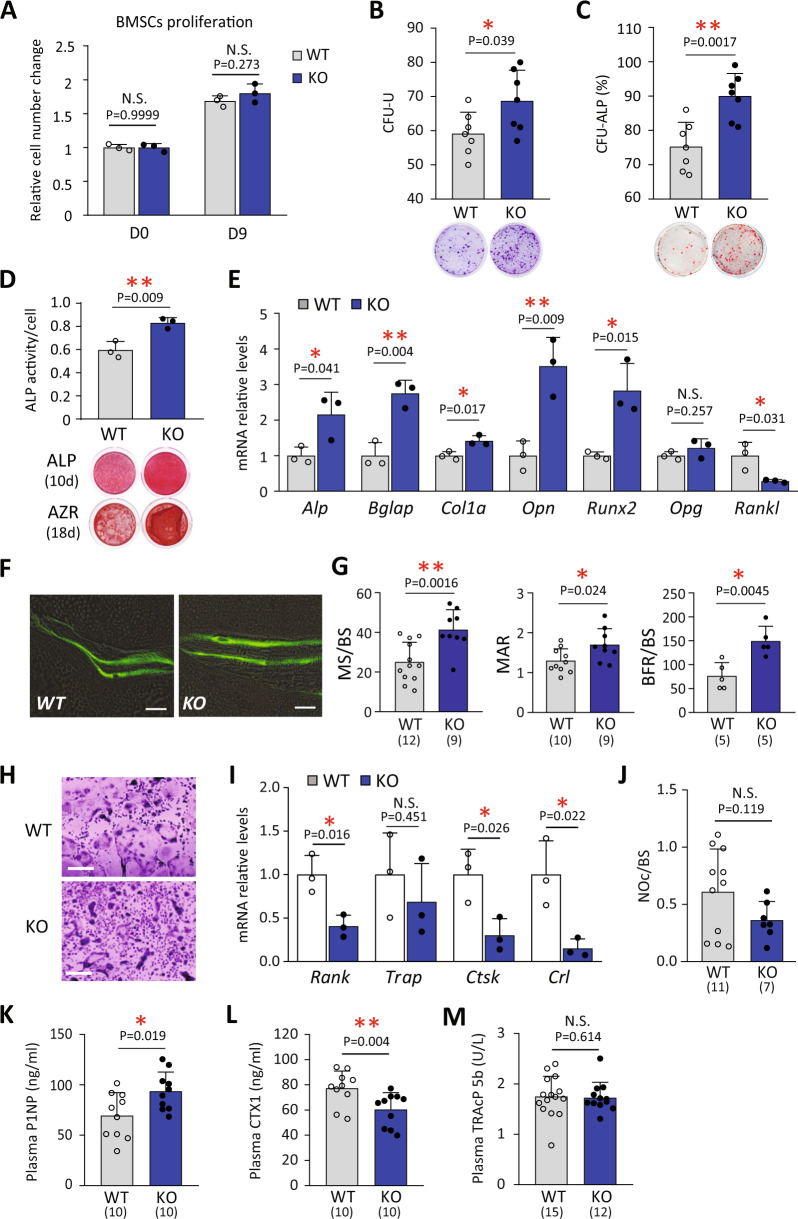
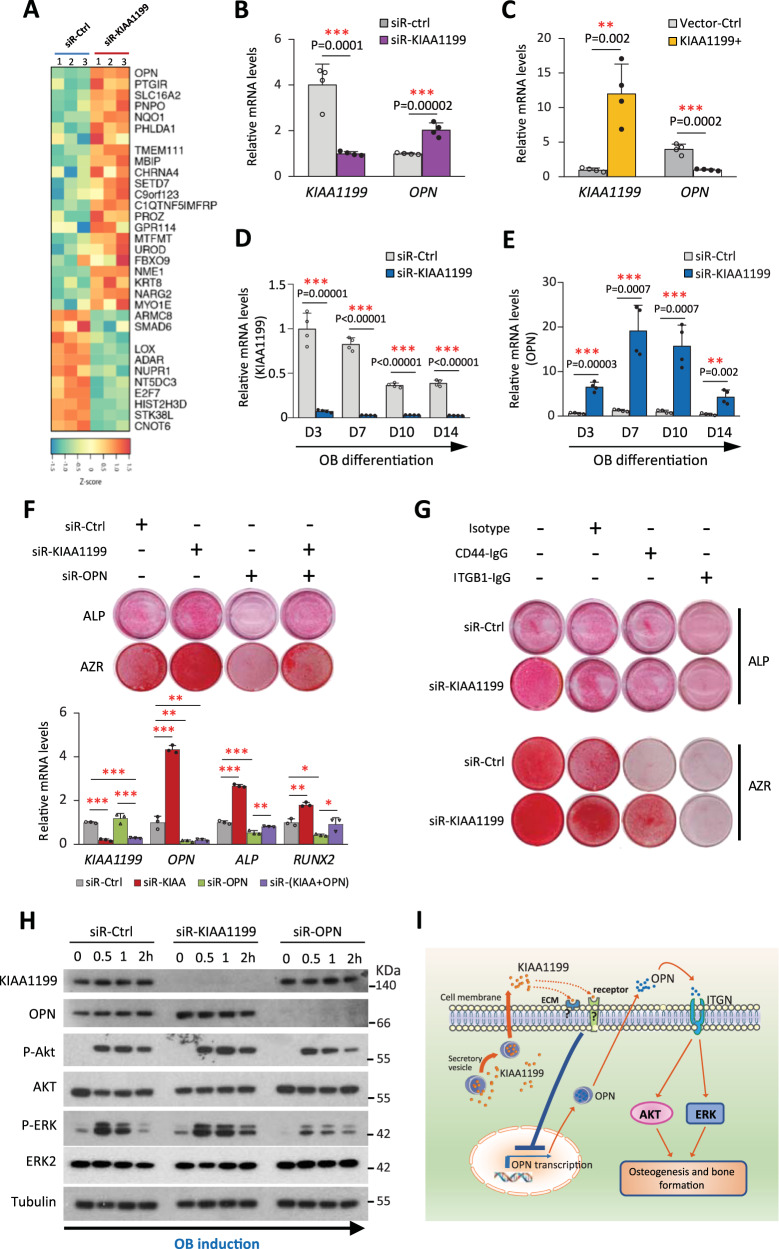
Upon transplantation, skeletal stem cells (also known as bone marrow stromal or mesenchymal stem cells) can regulate bone regeneration by producing secreted factors. Here, we identify KIAA1199 as a bone marrow stromal cell-secreted factor in vitro and in vivo. KIAA1199 plasma levels of patients positively correlate with osteoporotic fracture risk and expression levels of KIAA1199 in patient bone marrow stromal cells negatively correlates with their osteogenic differentiation potential. KIAA1199-deficient bone marrow stromal cells exhibit enhanced osteoblast differentiation in vitro and ectopic bone formation in vivo. Consistently, KIAA1199 knockout mice display increased bone mass and biomechanical strength, as well as an increased bone formation rate. They also exhibit accelerated healing of surgically generated bone defects and are protected from ovariectomy-induced bone loss. Mechanistically, KIAA1199 regulates osteogenesis by inhibiting the production of osteopontin by osteoblasts, via integrin-mediated AKT and ERK-MAPK intracellular signaling. Thus, KIAA1199 is a regulator of osteoblast differentiation and bone regeneration and could be targeted for the treatment or management of low bone mass conditions.


Conflict of interest statement

The authors declare no competing interests.

Figures

Fig. 1
Fig. 1. The plasma levels of KIAA1199 are positively correlated with osteoporotic fracture risk, but negatively correlated with osteogenic potentials of bone marrow stromal stem cells in patients.
A In situ hybridization (ISH) analysis of KIAA1199 mRNA expression in human iliac crest bone biopsies showing positive staining (red dots) in osteoprogenitor cells (yellow arrowheads), bone-forming osteoblasts (blue arrowheads), bone marrow cells (black arrows) lining bone marrow adipocytes, n = 3 independent experiments. B The expression levels of KIAA1199 mRNA were examined by qRT-PCR in different mouse tissues, n ≥ 3 biologically independent samples. CE Paired bone marrow supernatant fluids and peripheral blood plasma were collected in a group of patients admitted to the hospital with bone fractures, the levels of KIAA1199 in bone marrow were compared between men and women (C) and the paired KIAA1199 levels in bone marrow and peripheral plasma were compared (D) and the correlation was analyzed (E), n = 22. F, G Bone marrow KIAA1199 levels were correlated to FRAX score as an index for risk of osteoporotic (F) and hip fractures (G), n = 42. HJ KIAA1199 expression was measured in cultured human bone marrow stromal cells (hBMSC) obtained from the patients. The number of osteoblastic CD146 + cells was determined by flow cytometry analysis (H), and the cells were induced to osteoblastic differentiation that was evaluated by alkaline phosphatase (ALP) activity on day 7 (I) and formation of mineralized matrix visualized by Alizarin Red staining at day 14 (J). The correlation between the KIAA1199 mRNA levels and CD146 + cells percentage, or induced ALP activity and Alizarin Red staining eluted absorbance were analyzed in hBMSC, n = 42. Data is presented as mean ± SD, the comparison between two groups were analyzed by two-tailed unpaired Student’s t test (CD), the correlation statistical analyses between variables were performed using the Spearman two-tailed correlation test (EJ). *P < 0.05, **P < 0.01 and ***P < 0.001. Source data are provided as a Source Data file.
Fig. 2
Fig. 2. KIAA1199 is a regulator of osteoblast differentiation of human bone marrow stromal stem cells (hBMSC) in vitro and bone formation in vivo.
AC The expression of KIAA1199 in hBMSC was quantified by RNA-seq (A), real time PCR (B) and Western blot analysis in conditioned medium (C) at day (d) 0–14 during in vitro osteoblastic (OB) differentiation. The beta-tubulin was used to check the conditioned medium without any cell pellets contamination. Data was collected from at least three independent experiments; the representative results are shown here. D hBMSC were transfected with specific siRNAs targeting KIAA1199 (siR-KIAA1199) or non-target control siRNA (siR-Ctrl) and induced to osteoblast (OB) differentiation, n ≥ 3 independent experiments; E Conditioned medium (CM) from KIAA1199-overexpressing cells (+ KIAA1199-CM) and control vector cells were added to hBMSC during induction of OB differentiation of hBMSC. ALP activity (Day 7) and ALP staining (Day 5–7) and Alizarin Red staining (AZR) staining (Day 12–14) were measured during OB differentiation, n ≥ 3 independent experiments. F siR-Ctrl and siR-KIAA1199 transfected hBMSC have loaded into hydroxyapatite/tricalcium phosphate (HA/TCP) scaffolds and implanted subcutaneously in immune-deficient mice for 8 weeks. Newly formed bone tissues (red) were quantified to the whole implant area, n = 10 biologically independent samples. Scale bar (F) = 100 µm. Data are expressed as means ± SD. Statistical difference was determined by one-way ANOVA with Dunnett’s multiple test (A, B) or two-tailed unpaired Student’s t-test (D–F). *P < 0.05, **P < 0.01. Source data are provided as a Source Data file.
Fig. 3
Fig. 3. KIAA1199 KO mice exhibit increased bone mass and bone strength.
AH Bone mass was determined by µCT-scanning of trabecular bone (A, B, E, F) and cortical bone (C, D, G, H) on proximal tibia of 8 weeks male (AD) and female (EH) KIAA1199 knockout (KO) and corresponding wild-type (WT) mice. Photomicrographs of representative µCT-3D scan are shown in (A, C, E, G), and quantitative data analysis are shown (B, D, F, H). Trabecular bone volume per tissue volume (Tb. BV/TV), trabecular thickness (Tb. Th., mm), trabecular number (Tb. N., /mm3), trabecular connectivity density (Conn-dens., /mm3), trabecular structure model index (SMI), trabecular separation (Tb.Sp., µm), cortical (Ct) BV/TV, Ct thickness (Ct. Th., mm), n = 8. Scale bar (A, C, E, G) = 400 µm. I Three-point bending test was measured on femur of KO and WT male mice and quantitated by maximum load (N), ultimate stress (MPa), bone stiffness (N/mm) and failure energy (KJ), n (WT) = 11, n (KO) = 9. At least two sets animal’s experiments were detected and confirmed for each test, the results from one set experiment were presented. Data is pressed as means ± SD, statistical difference was determined by two-tailed unpaired Student’s t-test between two groups. *P < 0.05. **P < 0.01 and ***P < 0.001. Source data are provided as a Source Data file.
Fig. 4
Fig. 4. KIAA1199 KO mice exhibit accelerated bone regeneration and protection from ovariectomy-induced bone loss.
A Gene expressions of KIAA1199 in mouse bone tissues at the site of tibial monocortical defect during 14 days bone regeneration, as measured by qRT-PCR, n = 8 biologically independent samples / group. B, C Bone regeneration in monocortical tibial defect in male KIAA1199 KO mice and WT mice. Representative 3D reconstruction of tibial defect by µCT at Day (D) 7 and 14 following the defect surgery (B). Bone volume (BV), trabecular bone number (B-N), trabecular bone thickness (B-Th) and trabecular bone separation (B-Sep) were quantitated on Day 14 (C), n = 5/group. D, E KIAA1199 KO and WT female mice (8-week-old) were subjected to sham-operation or ovariectomy (OVX), and bone mass of tibiae was quantified by µCT scanning on 2 and 4 months after OVX. The representative 3D reconstructed images on 4 months (D) and quantified changes in trabecular bone volume per tissue volume change (BV/TV) (E) are presented, n (WT-sham) = 10, n (WT-OVX) = 7, n (KO-Sham) = 8, n (KO-OVX) = 8. Scale bar (B, D) = 400 µm, at least two sets animal’s experiments were detected and confirmed for each test, the results from one set experiment were presented. data is presented as means ± SD, and statistical difference was determined by two-tailed unpaired Student’s t-test (A, C) or one-way ANOVA with Tukey’s multiple comparisons (E). *P < 0.05 and **P < 0.01. Source data are provided as a Source Data file.
Fig. 5
Fig. 5. KIAA1199 KO increases osteogenic potential of bone marrow stromal stem cells, enhances the osteogenic differentiation but inhibits the osteoclast differentiation.
A The changes of cell number of bone marrow stromal stem cells (mBMSC) from WT and KIAA1199 KO female mice were determined on day (D) 0 and 9, n = 4. B, C Colony-forming unit fibroblasts (CFU-Fs) were counted (B), CFU-ALP + colonies on day 7 were presented as a percent of CFU-Fs, n = 6. D, E Alkaline phosphatase (ALP) activity and ALP staining on day 10 and alizarin red (AZR) staining on day 18 during osteoblast (OB) differentiation of mBMSC (D); Real-time PCR analysis of OB gene markers: Alp, alkaline phosphatase, Bglap osteocalcin, Col1a, collagen type 1, Opn, osteopontin, Runx2, Runt-related transcription factor 2, Opg, osteoprotegerin, Rankl, Receptor activator of nuclear factor kappa-Β ligand (E), n ≥ 3. F, G Dynamic bone histomorphometry were measured in proximal tibia. Mineralized surface per bone surface (MS/BS, %), mineral apposition rate (MAR, µm/d), bone-formation rate per bone surface (BFR/BS, µm3/µm2/year) were compared between KO and WT male mice, n values are as labeled. H, I Osteoclast differentiation of bone marrow cells from female KIAA1199 KO and WT mice. The formation of multinucleated OC was verified by positive staining for tartrate-resistant acid phosphatase (TRACP) on day 5 (H). The expressions of OC maker genes were analyzed by real time PCR: Rank, tumor necrosis factor receptor superfamily member 11A, Trap, tartrate-resistant acid phosphatase type 5, Ctsk, cathepsin K, Crl, calcitonin receptor (I), n ≥ 3. J Number of osteoclasts per bone surface (NOc/BS, /mm) by bone histomorphometry on mice tibias, n values are as labeled. KM Plasma levels of procollagen type 1 N-terminal pro-peptide (P1NP) (K), C-telopeptide of type I collagen (CTX1) (L) and tartrate-resistant acid phosphatase 5b (TRAcP 5b) (M) in KIAA1199 KO and WT mice were measured by ELISA, n values are as labeled. Scale bar (F, H) = 100 µm, date is presented as mean ± SD, statistical difference between WT and KO was determined by two-tailed unpaired Student’s t-test. *P < 0.05 and **P < 0.01. Source data are provided as a Source Data file.
Fig. 6
Fig. 6. KIAA1199 regulates osteoblastic (OB) differentiation through OPN / integrin / AKT / ERK signaling.
A Heat map of the most regulated genes identified by DNA microarray expression profiling in KIAA 1199 deficient human bone marrow stromal stem cells (hBMSC, transfected with specific siR-KIAA1199), compared to non-target siRNA transfected control hBMSC (siR-Ctrl), n = 3. B, C KIAA1199 and osteopontin (OPN) gene expression in siR-KIAA1199 and siR-Ctrl hBMSC (B); or in hBMSC overexpressing KIAA1199 by transfection with KIAA1199 plasmid (KIAA1199 + ) or control empty vector (Vector-Ctrl) (C). n = 4. DE The expression of KIAA1199 (D) and OPN (E) were traced by qRT-PCR during OB differentiation in KIAA 1199 deficient hBMSC (siR-KIAA1199) and control hBMSC (siR-Ctrl) on Day (D) 3, 7, 10 and 14, n = 4. F hBMSC were transfected with specific siRNAs for KIAA1199 (siR-KIAA1199) or OPN (siR-OPN), or both, or non-target control (siR-Ctrl). ALP and Alizarin Red staining were performed at day 7 or 14 following OB induction. The expressions of KIAA1199, OPN, ALP and RUNX2 were detected on day 12, n = 3. G siR-KIAA1199 or siR-Ctrl hBMSC were treated with a blocking antibody against integrin β1 (ITGB1), or an isotype control, or blocking antibody against CD44 (each at 10 mg/ml) during OB differentiation. ALP and Alizarin red staining were performed on day 7 or 14. Gene expression of KIAA1199, OPN, ALP, RUNX2 were measured. H hBMSC transfected by siR-KIAA1199 or siR-OPN, or siR-Ctrl were starved in serum free medium for 6 hours, then added OB differentiation induction cocktail for 0 to 2 h. Proteins were subjected to Western blot analysis; beta-tubulin was used as the loading control. Data was collected from at least three independent experiments; the representative results are shown here. Data are expressed as means ± SD. Statistical difference was determined by one-way ANOVA. *P < 0.05, **P < 0.01 and ***P < 0.001. Source data are provided as a Source Data file. I A working model for the possible mechanism of KIAA1199 on regulating osteoblast differentiation by interaction with OPN / integrin.

References

    1. Caplan AI, Correa D. The MSC: an injury drugstore. Cell Stem Cell. 2011;9:11–15. doi: 10.1016/j.stem.2011.06.008. - DOI - PMC - PubMed
    1. Harrell CR, et al. Molecular mechanisms responsible for therapeutic potential of mesenchymal stem cell-derived secretome. Cells. 2019;8:467. doi: 10.3390/cells8050467. - DOI - PMC - PubMed
    1. Baez-Jurado E, et al. Secretome of mesenchymal stem cells and its potential protective effects on brain pathologies. Mol. Neurobiol. 2019;56:6902–6927. doi: 10.1007/s12035-019-1570-x. - DOI - PubMed
    1. Abdallah BM, Kassem M. New factors controlling the balance between osteoblastogenesis and adipogenesis. Bone. 2012;50:540–545. doi: 10.1016/j.bone.2011.06.030. - DOI - PubMed
    1. Markov A, et al. Mesenchymal stem/stromal cells as a valuable source for the treatment of immune-mediated disorders. Stem Cell Res. Ther. 2021;12:192. doi: 10.1186/s13287-021-02265-1. - DOI - PMC - PubMed

Publication types

Substances