. 2023 Apr 10;14(1):2020.
doi: 10.1038/s41467-023-37785-2.

Hypoimmune anti-CD19 chimeric antigen receptor T cells provide lasting tumor control in fully immunocompetent allogeneic humanized mice

Affiliations

Hypoimmune anti-CD19 chimeric antigen receptor T cells provide lasting tumor control in fully immunocompetent allogeneic humanized mice

Xiaomeng Hu et al. Nat Commun. .

Abstract

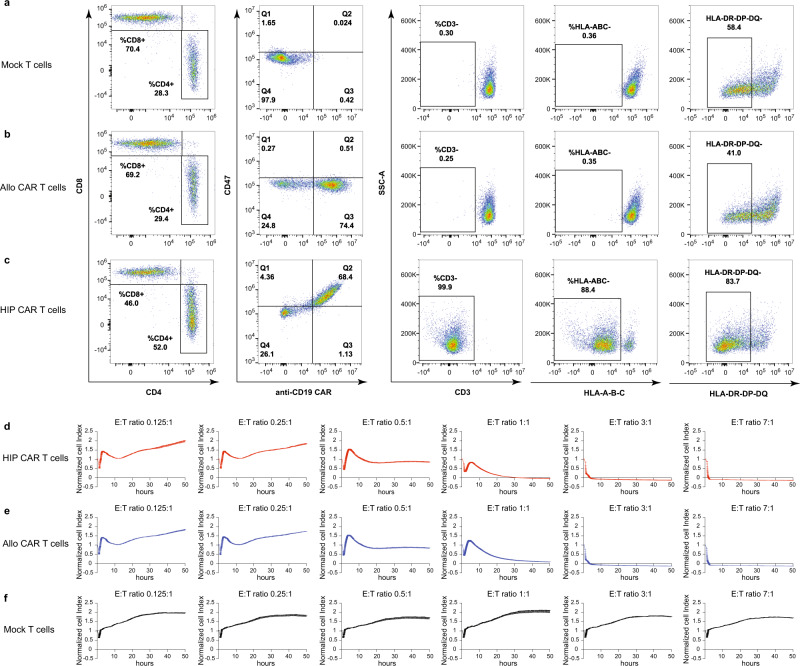
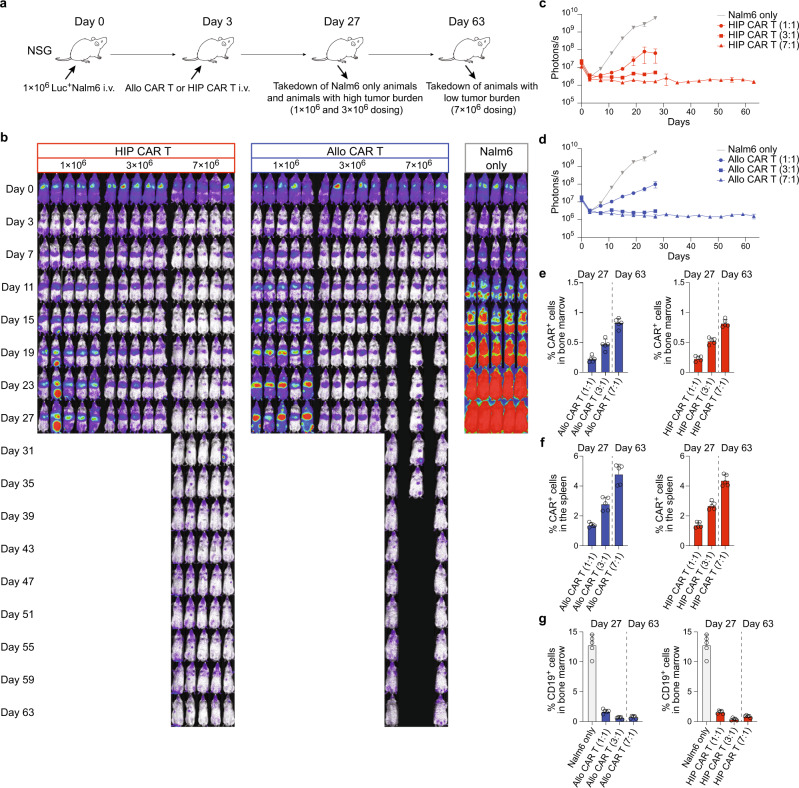
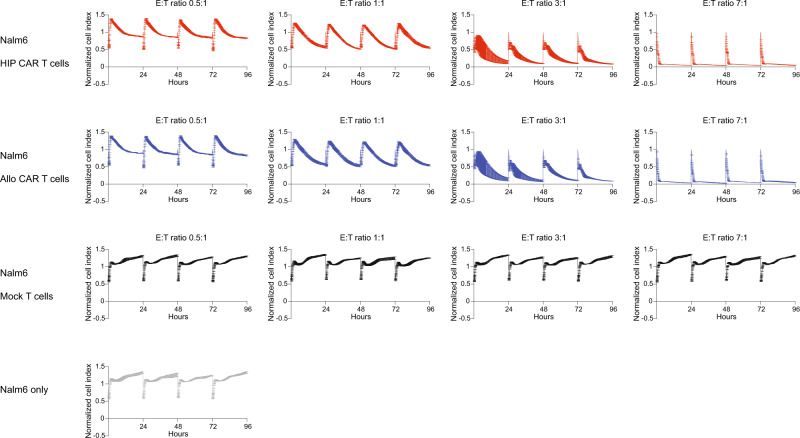
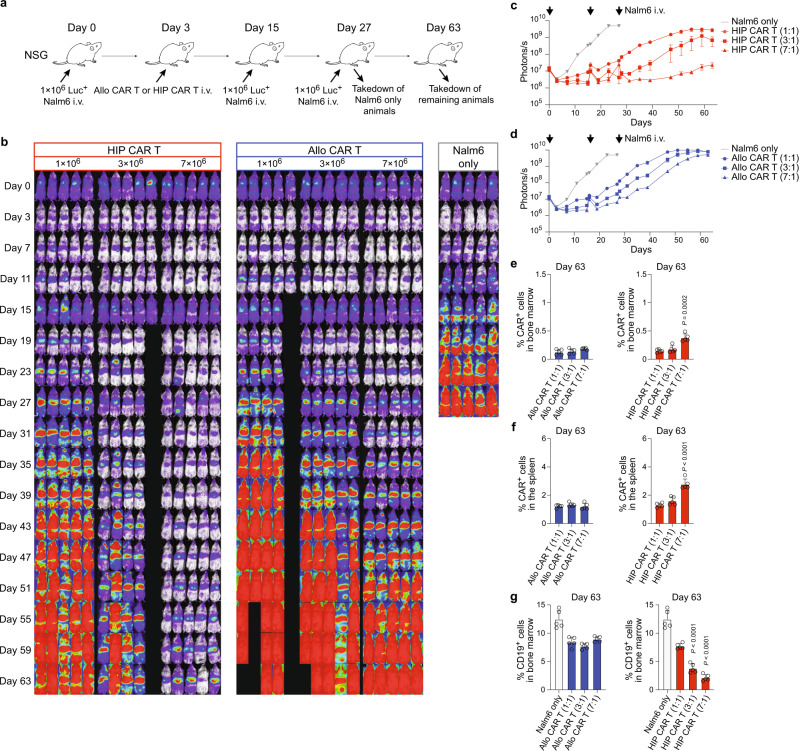
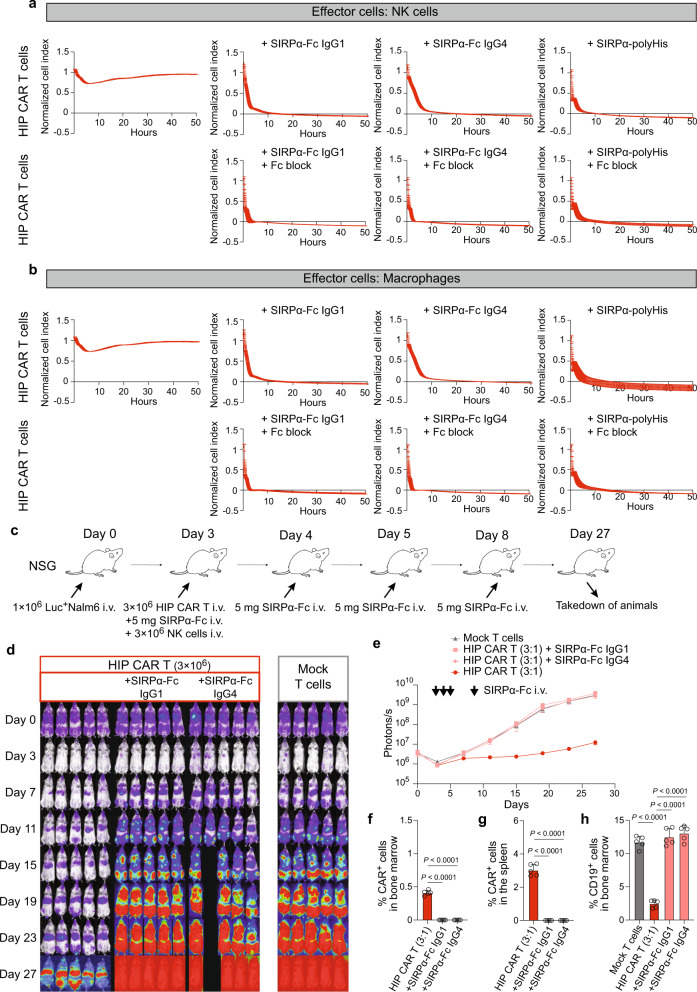
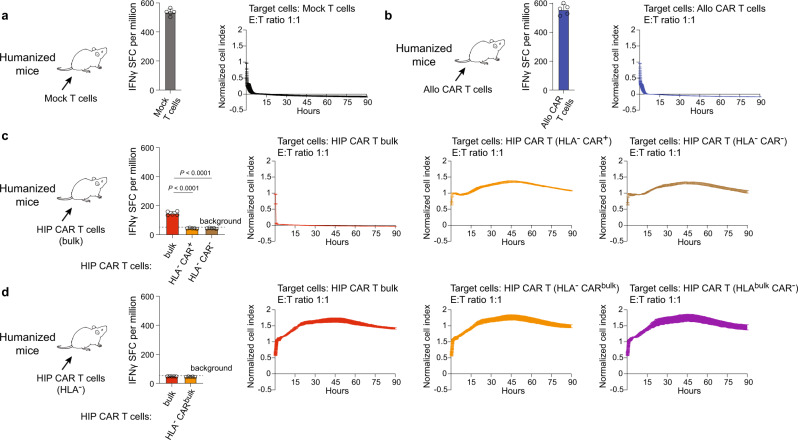
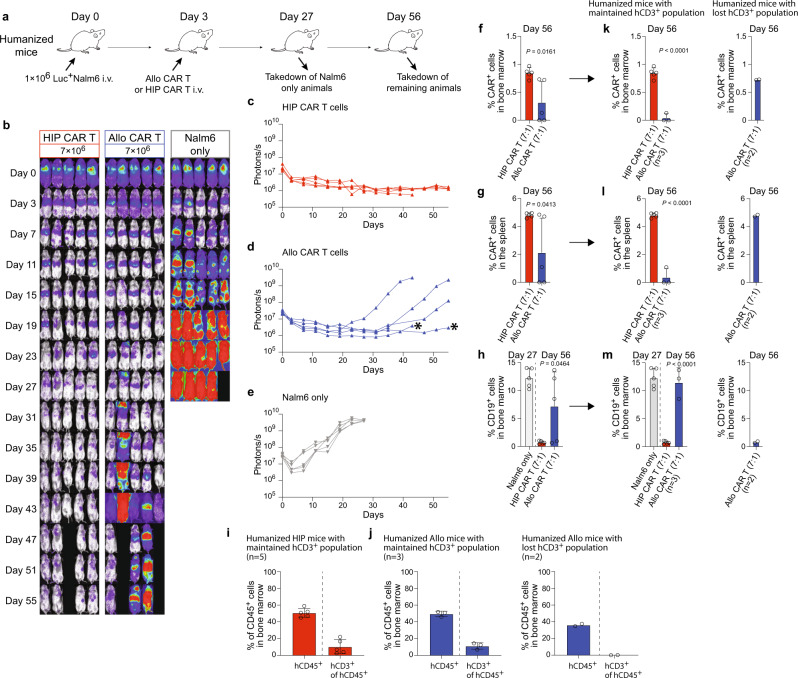
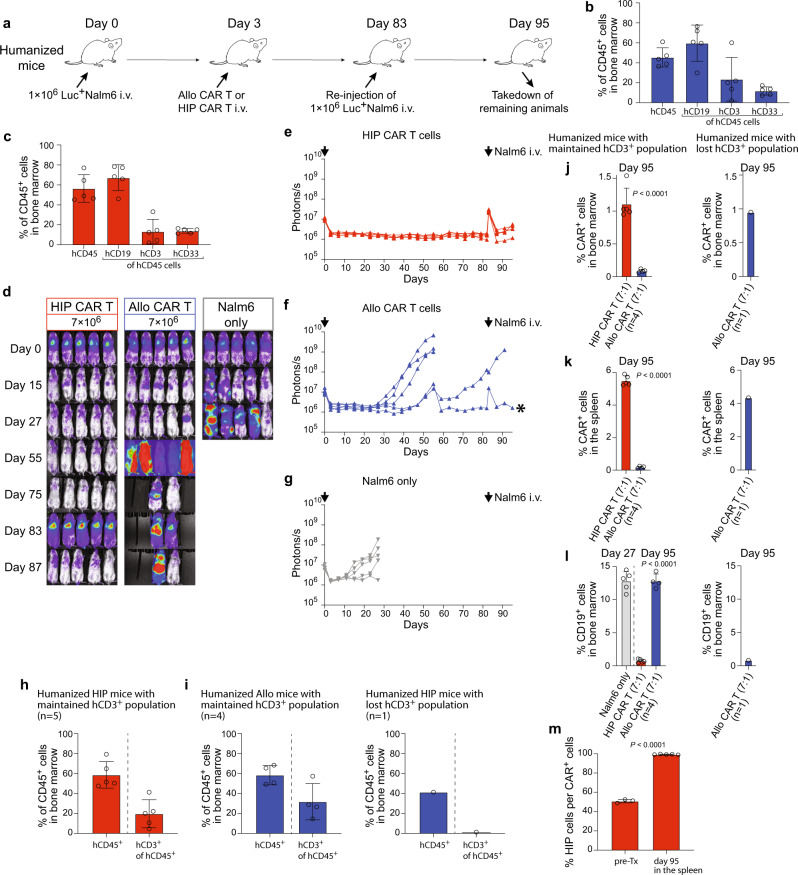
Manufacturing autologous chimeric antigen receptor (CAR) T cell therapeutics is complex, and many patients experience treatment delays or cannot be treated at all. Although current allogeneic CAR products have the potential to overcome manufacturing bottlenecks, they are subject to immune rejection and failure to persist in the host, and thus do not provide the same level of efficacy as their autologous counterparts. Here, we aimed to develop universal allogeneic CAR T cells that evade the immune system and produce a durable response. We generated human hypoimmune (HIP) T cells with disrupted B2M, CIITA, and TRAC genes using CRISPR-Cas9 editing. In addition, CD47 and anti-CD19 CAR were expressed using lentiviral transduction. These allogeneic HIP CD19 CAR T cells were compared to allogeneic CD19 CAR T cells that only expressed the anti-CD19 CAR (allo CAR T). In vitro assays for cancer killing and exhaustion revealed no differences between allo CAR T and HIP CAR T cells, confirming that the HIP edits did not negatively affect T cell performance. Clearance of CD19+ tumors by HIP CAR T cells in immunodeficient NSG mice was comparable to that of allo CAR T cells. In fully immunocompetent humanized mice, HIP CAR T cells significantly outperformed allo CAR T cells, showed improved persistence and expansion, and provided lasting cancer clearance. Furthermore, CD47-targeting safety strategies reliably and specifically eliminated HIP CAR T cells. These findings suggest that universal allogeneic HIP CAR T cell-based therapeutics might overcome the limitations associated with poor persistence of allogeneic CAR T cells and exert durable anti-tumor responses.


Conflict of interest statement

All experiments were conducted by or on behalf of Sana Biotechnology, Inc. and no data from UCSF were used. T.D. performed the work in this manuscript as consultant to Sana Biotechnology, Inc. T.D. owns stock in Sana Biotechnology, Inc. All other authors are employees of and own stock in Sana Biotechnology, Inc.

Figures

Fig. 1
Fig. 1. HIP CAR T cells are effective killers of Nalm6 tumor cells.
ac Flow cytometry of unedited (Mock, a) T cells, anti-CD19 allo CAR T cells (b), and anti-CD19 HIP CAR T cells (c) are shown. T cells are identified by CD4 or CD8 expression. Allo CAR T and HIP CAR T cells showed expression of the anti-CD19 CAR of approximately 70%. HIP CAR T cells showed disruption of the TCRαβ/CD3 complex and of HLA class I and II and overexpression of CD47 (representative graph of two independent experiments). df In vitro impedance cytotoxicity assay with Nalm6 target cells and HIP CAR T cells (d), allo CAR T cells (e), or Mock T cells (f) in different E:T ratios (mean ± SD, three independent replicates per group and time point).
Fig. 2
Fig. 2. Nalm6 tumor killing in NSG mice.
a Immunodeficient NSG mice were injected with 1 × 106 Luc+ Nalm6 cells via the tail vein and were followed by BLI. Some mice then received allo CAR T cells or HIP CAR T cells (n = 5 mice in each group in one experiment) intravenously on day 3. Spleen and bone marrow were taken after 27 or 63 days. b BLI images show the tumor burden for all mice in this study. c, d Graphs show BLI signals for animals in the HIP CAR T (c) and allo CAR T cell groups (d, mean ± SEM, n = 5 animals per group). e, f The percentage of CAR+ cells in the bone marrow (e) and spleen (f) were assessed on the day of organ recovery (mean ± SD, n = 5 animals per group). There were no significant differences between the two CAR T cell groups at the same dose level. g The percentage of CD19+ cells in the bone marrow was assessed on the day of recovery (mean ± SD, n = 5 animals per group). For (eg): Unpaired, two-tailed Student’s t test was used to compare the allo and HIP CAR T cell groups at the same dose level, and no differences were found.
Fig. 3
Fig. 3. CAR T cells are repeatedly re-challenged with Nalm6 tumor cells in vitro.
Different doses of HIP CAR T cells, allo CAR T cells, or Mock T cells were used as effectors against Nalm6 target cells in impedance cytotoxicity assays (mean ± SD, three independent replicates per group and time point in one experiment). The T cells were recovered daily and used as effector cells in new wells with Nalm6 target cells for 4 days. There was no difference in cytotoxicity between the two CAR groups at the same dose level.
Fig. 4
Fig. 4. CAR T cells are repeatedly re-challenged with Nalm6 tumor cells in vivo.
a Immunodeficient NSG mice were injected with 1 × 106 Luc+ Nalm6 cells and received different doses of allo CAR T cells or HIP CAR T cells on day 3. The mice were injected again on days 15 and 27 with Nalm6 cells. Spleen and bone marrow was taken after 27 or 63 days. b BLI images show the tumor burden for all mice in this study. c, d Graphs show BLI signals for animals in the HIP CAR T (c) and allo CAR T cell groups (d, mean ± SEM, n = 5 animals per group in one experiment, arrows indicate Nalm6 injections). e, f The percentage of CAR+ cells in the bone marrow (e) and spleen (f) were assessed on the day of organ recovery (mean ± SD, n = 5 animals per group). Significant differences between the two CAR T cell groups at the same dose level (7:1 ratio) are shown. g The percentage of CD19+ cells in the bone marrow was assessed on the day of recovery (mean ± SD, n = 5 animals per group). For (eg): Unpaired, two-tailed Student’s t test was used to compare the allo and HIP CAR T cell groups at the same dose level and significant differences are shown.
Fig. 5
Fig. 5. The CD47-targeting safety strategy for HIP CAR T cells.
a, b HIP CAR T cells were challenged with NK cells (a) or macrophages (b) in the presence and absence of SIRPα-Fc IgG1 or IgG4, or a SIRPα with poly-His tail (upper rows, three independent replicates per group and time point). Effector cell Fc was blocked by Fc block solution (lower rows, three independent replicates per group and time point in one experiment). c Immunodeficient NSG mice were injected with 1 × 106 Luc+ Nalm6 cells and received 3 × 106 HIP CAR T cells or Mock T cells on day 3. In two HIP CAR T groups, mice additionally received three doses of the SIRPα-Fc IgG1 or IgG4 on days 3, 4, 5, and 8. Spleen and bone marrow were taken after 27 days. d BLI images show the tumor burden for all mice in this study. e Graphs show BLI signals for animals receiving HIP CAR T cell with or without the SIRPα-Fc IgG1 or IgG4 (mean ± SEM, n = 5 animals per group in one experiment, arrows indicate SIRPα-Fc i.v. injections). f, g The percentage of CAR+ cells in the bone marrow (f) and spleen (g) were assessed on day 27 (mean ± SD, n = 5 animals per group). No HIP CAR T cells were detected in animals that received either fusion protein (ANOVA with Bonferroni’s post hoc test). h The percentage of CD19+ cells in the bone marrow was assessed on day 27 (mean ± SD, n = 5 animals per group). There were no differences between the animals receiving Mock T cells or HIP CAR T cells with either fusion protein (ANOVA with Bonferroni’s post hoc test).
Fig. 6
Fig. 6. Immune response in humanized mice.
Humanized mice were immunized with Mock T or CAR T cells. After 7 days, recipient T cells were isolated from spleen and IFNγ Elispot assays (Elispot: mean ± SD, n = 5 animals per group in one experiment, spot-forming cells (SFC) per million responder cells) and Xcelligence cytotoxicity assays (mean ± SD, three independent replicates per group and time point) were performed against the specified Mock T or CAR T cell population at an E:T ratio of 1:1. a Humanized mice that received allogeneic Mock T cells built a strong immune response against these cells, reflected by high Elispot frequencies and rapid target cell killing. b Similarly, humanized mice that received allogeneic CAR T cells built a strong immune response against these cells with high Elispot frequencies and rapid target cell killing. c Humanized mice that received allogeneic HIP CAR T bulk cells built a weak immune response against bulk cells, but no response against HLA CAR+ or HLA CAR cells. Accordingly, only bulk underwent killing, whereas and HLA CAR+ and HLA CAR cells survived (ANOVA with Bonferroni’s post hoc test). d Humanized mice that received the sorted HLA subpopulation of the HIP CAR T bulk did not build any response against HIP CAR T bulk, HIP CAR T (HLA CARbulk) and HIP CAR T (HLAbulk CAR) cells and exerted no cytotoxicity.
Fig. 7
Fig. 7. HIP CAR T cells provide lasting tumor control in fully immunocompetent allogeneic humanized mice.
a Humanized mice were injected with 1 × 106 Luc+ Nalm6 cells and received 7 × 106 allo CAR T cells or HIP CAR T cells on day 3 (one experiment). Spleen and bone marrow were taken after 27 or 56 days. b BLI images show the tumor burden for all mice in this study. ce Graphs show BLI signals for animals in the HIP CAR T (c) and allo CAR T cell groups (d), and the Nalm6 only group (e, all single animals are shown). * indicates outliers that got assessed further. f, g The percentages of CAR+ cells in the bone marrow (f) and spleen (g) were assessed on day 56 (mean ± SD, n = 5 animals per group). Significant differences between the two CAR T cell groups are shown. h The percentage of CD19+ cells in the bone marrow was assessed on day 56 as endpoint (mean ± SD, n = 5 animals per group) and were significantly different. Endpoint values from earlier euthanized mice in the allo CAR T group due to high tumor burden were included in the day 56 graphs. i, j Reconstitution of human immune cells was assessed in the HIP CAR T (i) and the allo CAR T (j) groups after euthanasia. The percentage of hCD45+ cells among all CD45+ cells and the percentage of hCD3+ cells in the hCD45+ population was quantified (mean ± SD, n = 5 HIP animals, n = 3 allo animals with maintained hCD3+ population and n = 2 allo animals with lost hCD3+ population). k, l The percentages of CAR+ cells in the bone marrow (k) and spleen (l) were assessed separately for animals that had maintained their hCD3+ population (mean ± SD, n = 5 in the HIP CAR T group and n = 3 in the allo CAR T group). The 2 animals in the allo CAR T group that had lost their hCD3 population are shown separately. m The percentage of CD19+ cells in the bone marrow was assessed separately for animals that had maintained their hCD3+ population (n = 5 in the HIP CAR T group and n = 3 in the allo CAR T group, mean ± SD). The 2 animals in the allo CAR T group that had lost their hCD3 population are shown separately. For (fh) and (km): Unpaired, two-tailed Student’s t test was used to compare HIP and allo CAR T cell groups and significant differences are shown.
Fig. 8
Fig. 8. HIP CAR T cells quickly clear tumor cells re-injected after 83 days in fully immunocompetent allogeneic humanized mice.
a Humanized mice were injected with 1 × 106 Luc+ Nalm6 cells and received 7 × 106 allo CAR T cells or HIP CAR T cells on day 3 (one experiment). Then, they received another injection of 1 × 106 Luc+ Nalm6 cells on day 83. Spleen and bone marrow were taken after 95 days. b, c Human immune cell reconstitution is shown for all 5 mice in the allo CAR T group (b) and the HIP CAR T group (c). Individual values are shown and mean ± SD. d BLI images show the tumor burden for all mice in this study. eg Graphs show BLI signals for animals in the HIP CAR T (e) and allo CAR T cell groups (f), and the Nalm6 only group (g, all single animals are shown). Arrows indicate Nalm6 injections, * indicates outliers used for further analysis. h, i Reconstitution of human immune cells was assessed in the HIP CAR T (h) and the allo CAR T (i) groups after euthanasia. The percentage of hCD45+ cells among all CD45+ cells and the percentage of hCD3+ cells in the hCD45+ population was quantified (mean ± SD, n = 5 HIP animals, n = 4 allo animals with maintained hCD3+ population and n = 1 allo animal with lost hCD3+ population). j, k The percentages of CAR+ cells in the bone marrow (j) and spleen (k) were assessed separately for animals that had maintained their hCD3+ population (n = 5 in the HIP CAR T group and n = 4 in the allo CAR T group, mean ± SD). The one animal in the allo CAR T group that had lost their hCD3 population is shown separately. Significant differences between the two CAR T cell groups are shown. l The percentage of CD19+ cells in the bone marrow was assessed separately for animals that had maintained their hCD3+ population (n = 5 in the HIP CAR T group and n = 4 in the allo CAR T group, mean ± SD). The one animal in the allo CAR T group that had lost their hCD3 population is shown separately. m The percentages of the HIP-edited cells in the HIP CAR T cell product before injection (n = 3) and the percentages of HIP-edited cells among the recovered CAR+ cell population from the spleen on day 95 (n = 5) are shown (mean ± SD, unpaired, two-tailed Student’s t test). For (hl): Endpoint values from earlier euthanized mice in the allo CAR T group due to high tumor burden were included in the day 95 graphs to show all values at the individual endpoint. For (jl): Unpaired, two-tailed Student’s t test was used to compare HIP and allo CAR T cell groups and significant differences are shown.

References

    1. June CH, Sadelain M. Chimeric antigen receptor therapy. N. Engl. J. Med. 2018;379:64–73. doi: 10.1056/NEJMra1706169. - DOI - PMC - PubMed
    1. Anagnostou T, Riaz IB, Hashmi SK, Murad MH, Kenderian SS. Anti-CD19 chimeric antigen receptor T-cell therapy in acute lymphocytic leukaemia: a systematic review and meta-analysis. Lancet Haematol. 2020;7:e816–e826. doi: 10.1016/S2352-3026(20)30277-5. - DOI - PubMed
    1. De Lima Lopes G, Nahas GR. Chimeric antigen receptor T cells, a savior with a high price. Chin. Clin. Oncol. 2018;7:21. doi: 10.21037/cco.2018.04.02. - DOI - PubMed
    1. DiNofia AM, Grupp SA. Will allogeneic CAR T cells for CD19(+) malignancies take autologous CAR T cells ‘off the shelf’? Nat. Rev. Clin. Oncol. 2021;18:195–196. doi: 10.1038/s41571-021-00485-1. - DOI - PubMed
    1. Lipsitz YY, Timmins NE, Zandstra PW. Quality cell therapy manufacturing by design. Nat. Biotechnol. 2016;34:393–400. doi: 10.1038/nbt.3525. - DOI - PubMed