. 2023 Apr 10;13(1):5813.
doi: 10.1038/s41598-023-31507-w.

Visualization of RNA virus infection in a marine protist with a universal biomarker

Affiliations

Visualization of RNA virus infection in a marine protist with a universal biomarker

Samantha R Coy et al. Sci Rep. .

Abstract

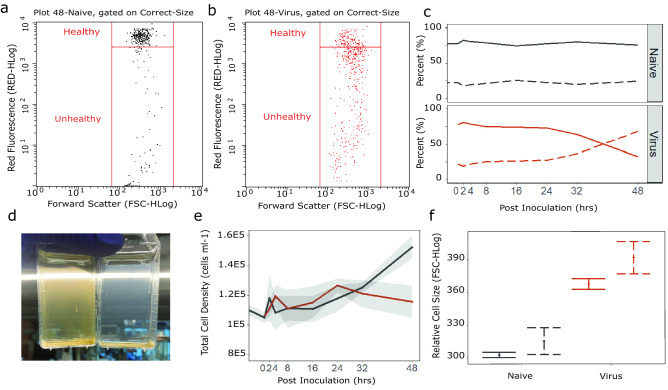
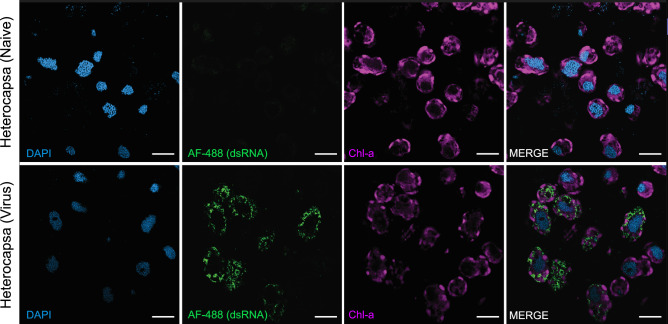
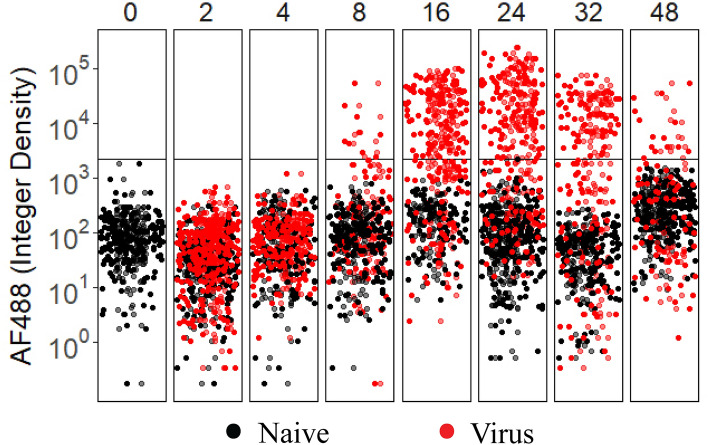
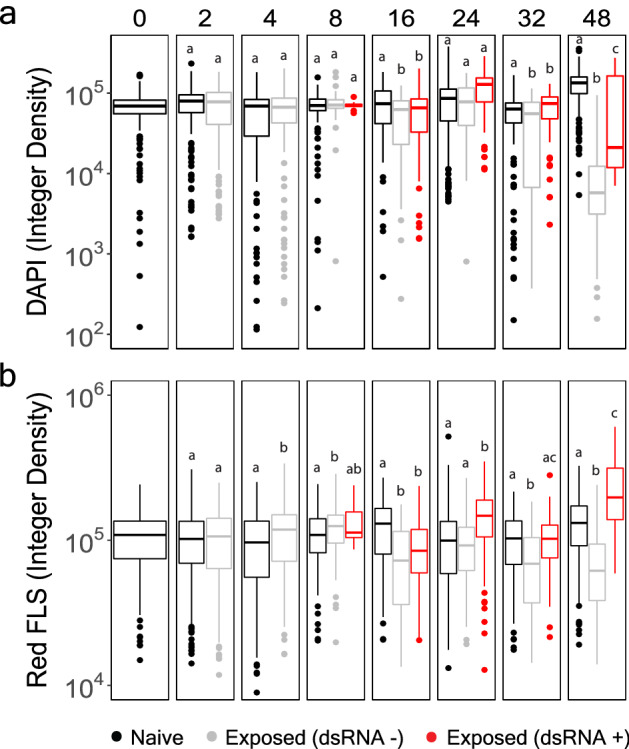
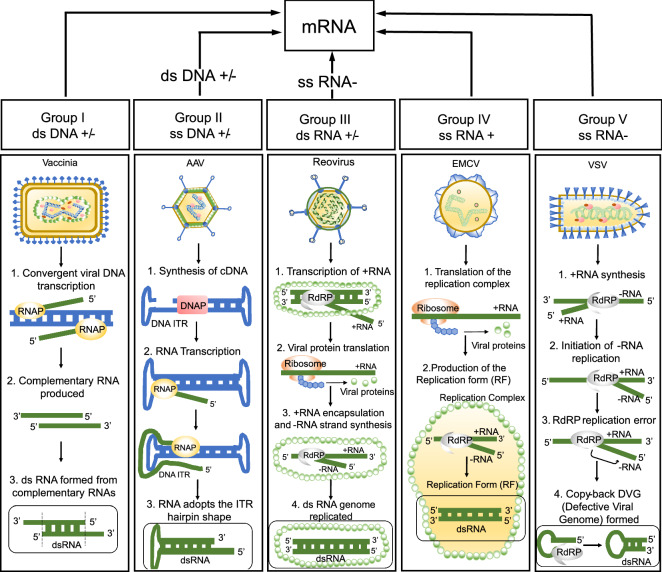
Half of the marine virosphere is hypothesized to be RNA viruses (kingdom Orthornavirae) that infect abundant micro-eukaryotic hosts (e.g. protists). To test this, quantitative approaches that broadly track infections in situ are needed. Here, we describe a technique-dsRNA-Immunofluorescence (dsRIF)-that uses a double-stranded RNA (dsRNA) targeting monoclonal antibody to assess host infection status based on the presence of dsRNA, a replicative intermediate of all Orthornavirae infections. We show that the dinoflagellate Heterocapsa circularisquama produces dsRIF signal ~ 1000 times above background autofluorescence when infected by the + ssRNA virus HcRNAV. dsRNA-positive virocells were detected across > 50% of the 48-h infection cycle and accumulated to represent at least 63% of the population. Photosynthetic and chromosomal integrity remained intact during peak replication, indicating HcRNAV infection does not interrupt these processes. This work validates the use of dsRIF on marine RNA viruses and their hosts, setting the stage for quantitative environmental applications that will accelerate understanding of virus-driven ecosystem impacts.


Conflict of interest statement

The authors declare no competing interests.

Figures

Figure 1
Figure 1
Culture dynamics of Heterocapsa circularisquama cells inoculated with HcRNAV strain A-2. Cultures include two sub- populations: a healthy population characterized by high red-autofluorescence, and cells declining in health as indicated by decreased red-autofluorescence. Flow cytometry dot plots depict naive (a) and viral-exposed (b) cultures containing different proportions of healthy and unhealthy sub-populations at 48 h post-inoculation. (c) Cultures are normally dominated by healthy cell populations (solid line) but shift to being dominated by the unhealthy population (dashed line) over the course of viral-infection. (d) Side-by-side comparison of naïve (left) and viral-exposed (right) cultures 48 h post-inoculation indicated clearing of cultures, presumably due to a loss of motility. (e) Despite the shift from healthy to unhealthy cell populations, there is no decrease in the overall number of viral-exposed cells (red) that would signify viral-mediated lysis. Black line = naïve cultures, shaded area = 95% confidence intervals. (f) After 48 h, inoculation treatments exhibit significantly different cell sizes (i.e., forward scattering), indicating viral-exposed cultures are likely on the verge of lysing (p ≤ 0.001, n = 3). Both the healthy (solid error bars) and unhealthy (dashed error bars) sub-populations are larger in viral-exposed cultures. Dot = Average, Error bars = 95% confidence intervals.
Figure 2
Figure 2
Airyscan, super-resolution imaging 16 h post-inoculation in 0.5 µm sections of Heterocapsa circularisquama naïve (top row) and HcRNAV-exposed (bottom row) samples. From left to right, columns indicate DAPI staining, AlexaFluor488 denoting dsRNA binding, chlorophyll-a autofluorescence, and merged images. Scale bars = 10 µm.
Figure 3
Figure 3
Schematic describing batch processing for quantification of dsRNA. (a) Dinoflagellate cells are imaged at z-depth intervals of 1 µm and are denoted here as planes. In reality, whole sections are closer to 20 µm but are reduced here for clarity. (b) Imaging of a single plane (e.g., Plane 2) captures only part of the dsRNA signal, while interval imaging of all planes combined with compression into one 2D, maximum intensity Z-projected image allows a complete estimation of dsRNA occurring in the cell. The yellow-outlined chlorophyll-a autofluorescence signal is also required to support automated, quantitative processing. (c) Cell boundaries are outlined via segmentation of 2D max intensity Z-projected autofluorescence and saved as regions of interest (ROI). (d) ROI are overlaid over each channel image and fluorescence intensity (e.g., dsRNA denoted by AlexaFluor488) is quantified. Scale bars in B = 10 µm.
Figure 4
Figure 4
Relative dsRNA signal on a single-cell, normalized scale for naive (black) and HcRNAV-exposed (red) H. circularisquama cells sampled across time. Horizontal line indicates the highest background signal for naive cultures and serves as a conservative threshold for categorizing infection state. Variation in color intensity represents an artifact of the position_jitterdodge function of ggplot2 to improve visibility of closely clustered datapoints within each timepoint. (n = 72 to 226 cell observations per timepoint per treatment; 2278 total observations).
Figure 5
Figure 5
Assessment of chromosomal integrity (a) and photosynthetic fluorescence (b) between different Heterocapsa populations defined by treatment and dsRNA status as interpreted from Fig. 4 data (described in Table 1). Naive cultures are represented in black. HcRNAV-exposed cells that are not associated with dsRNA production are grey, while HcRNAV-exposed cells that significantly produce dsRNA are red. The integer density represents cells normalized by size to account for different cross-sectional planes that might be represented in thin sections. Lower-case letters above each box plot indicate significance groups within each facet, and were determined using Welch’s two-tailed t-test (p-value < 0.05). The data are displayed using the geom_boxplot() function in ggplot2 under the default settings for the box to denote data distribution quartiles, whiskers, and outliers.
Figure 6
Figure 6
Mechanisms of dsRNA production across representative viruses for each Baltimore classification, excluding retro-viruses. The top part of the diagram depicts the Baltimore-based pathway each viral type uses to produce mRNA, while the bottom shows mechanisms for how each of the representative viruses make dsRNA (circled at the bottom of each panel). DNA is indicated in blue, while RNA is denoted by green nucleic acid strands. DNAP DNA polymerase, RNAP DNA-dependent-RNA-polymerase, RdRP RNA-dependent RNA polymerase. These mechanisms are specific to these viruses but may be shared by other lineages in each group. References for the mechanisms explaining these examples are included: Vaccinia Virus, Adeno-associated Virus (AAV),, Reovirus, Encephalomyocarditis Virus (EMCV),, and Vesicular Stomatitis Virus (VSV). The figure was generated in Microsoft Powerpoint Version 2301.

References

    1. Philippe N, et al. Pandoraviruses: Amoeba viruses with genomes up to 2.5 Mb reaching that of parasitic eukaryotes. Science. 2013;341:281–286. doi: 10.1126/science.1239181. - DOI - PubMed
    1. Makino S, et al. Molecular cloning and sequencing of a human Hepatitis delta (δ) virus RNA. Nature. 1987;329:343–346. doi: 10.1038/329343a0. - DOI - PubMed
    1. Suttle CA. Marine viruses: Major players in the global ecosystem. Nat. Rev. Microbiol. 2007;5:801–812. doi: 10.1038/nrmicro1750. - DOI - PubMed
    1. Brussaard CPD, Marie D, Bratbak G. Flow cytometric detection of viruses. J. Virol. Methods. 2000;85:175–182. doi: 10.1016/s0166-0934(99)00167-6. - DOI - PubMed
    1. Noble RT, Fuhrman JA. Use of SYBR Green I for rapid epifluorescence counts of marine viruses and bacteria. Aquat. Microb. Ecol. 1998;14:113–118. doi: 10.3354/ame014113. - DOI

Publication types