. 2023 May;8(5):875-888.
doi: 10.1038/s41564-023-01346-6. Epub 2023 Apr 10.

Uropathogenic Escherichia coli infection-induced epithelial trained immunity impacts urinary tract disease outcome

Affiliations

Uropathogenic Escherichia coli infection-induced epithelial trained immunity impacts urinary tract disease outcome

Seongmi K Russell et al. Nat Microbiol. 2023 May.

Abstract

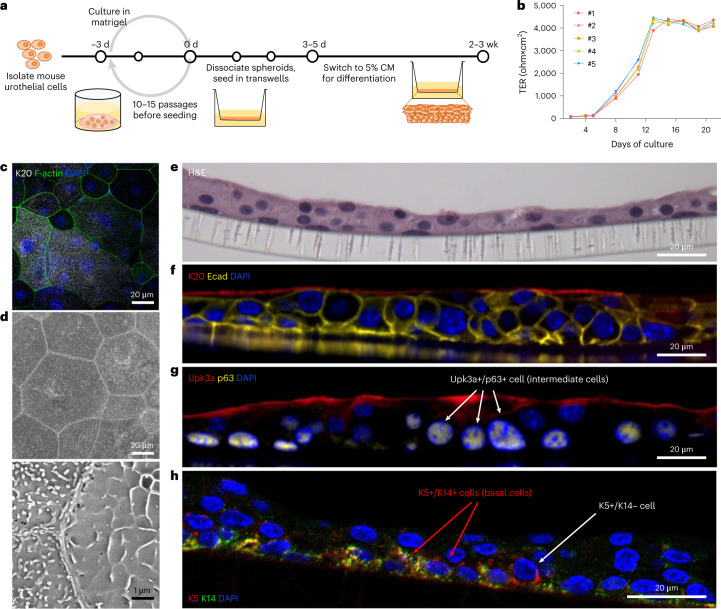
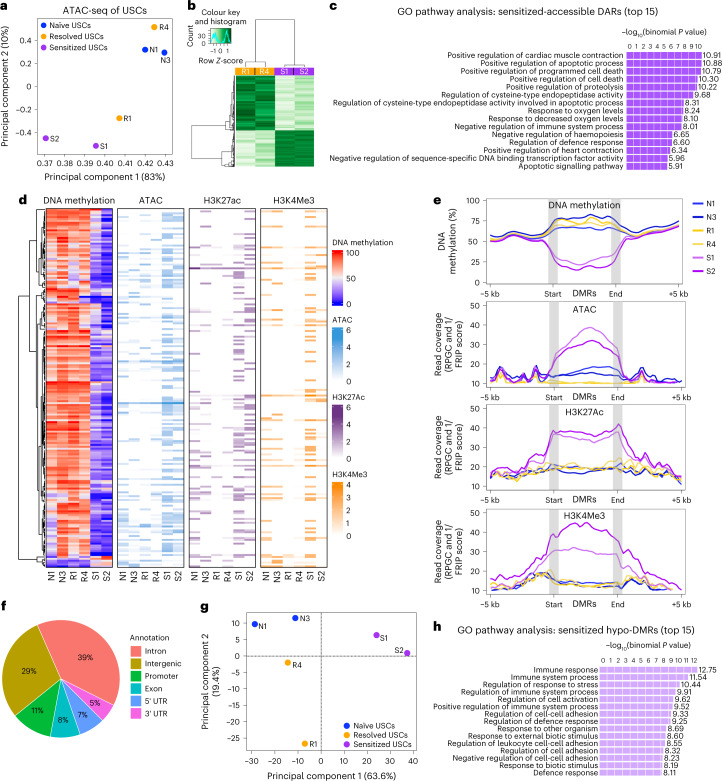
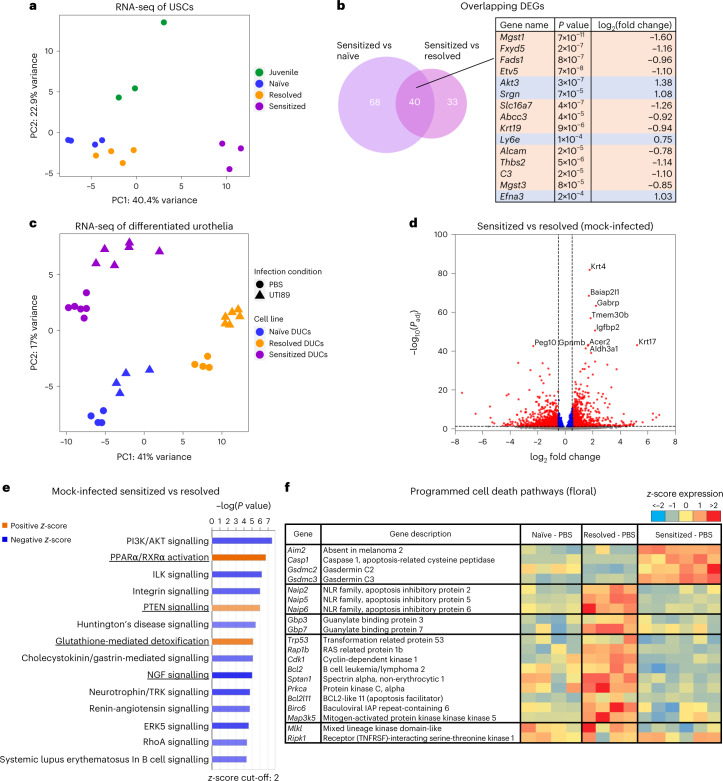
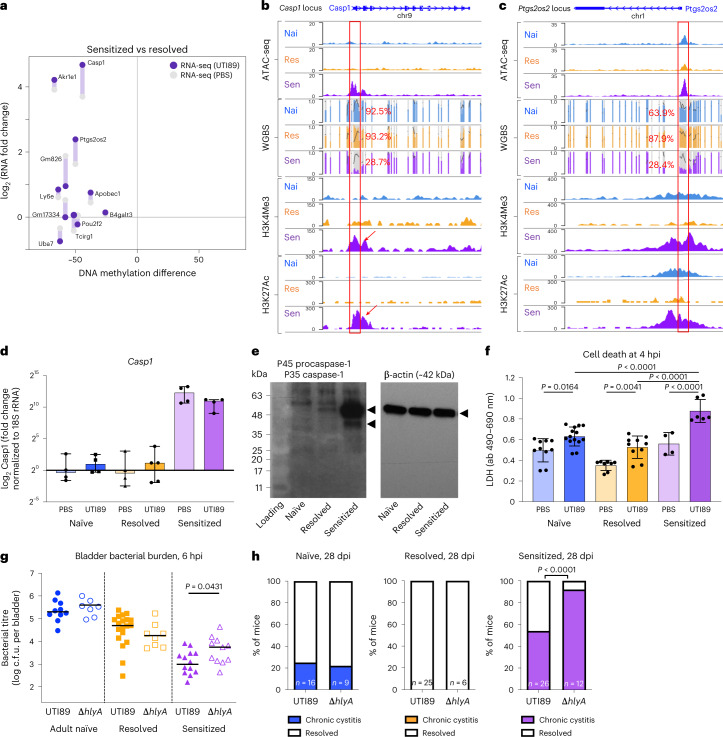
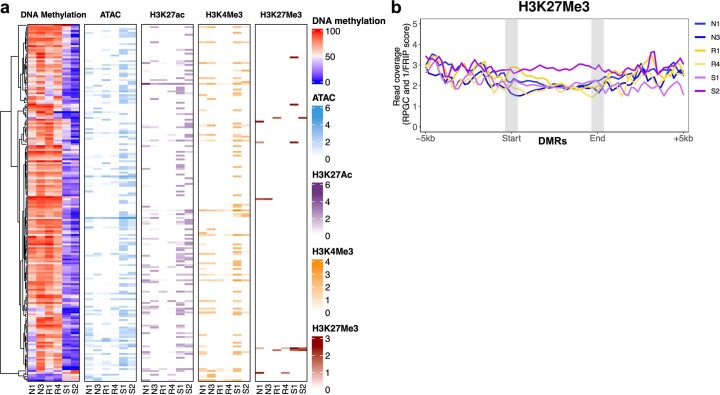
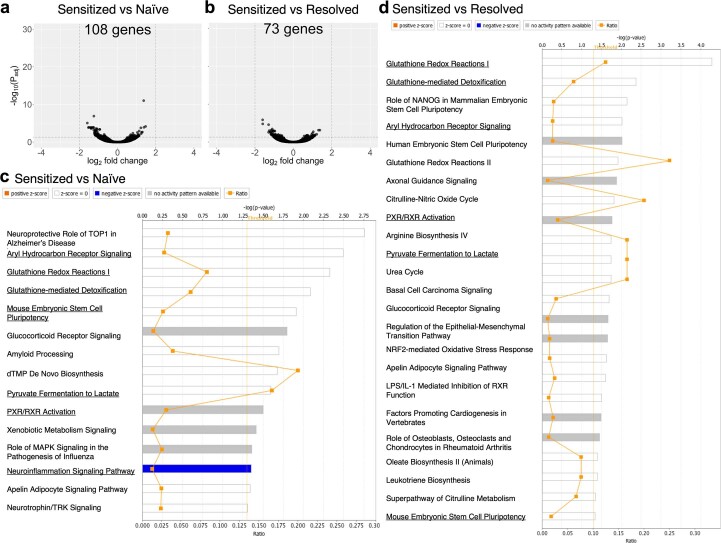
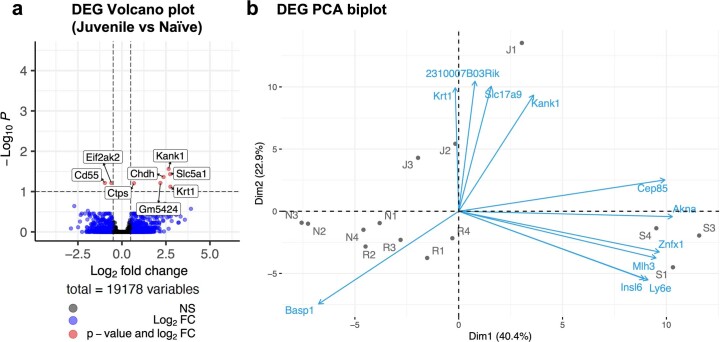
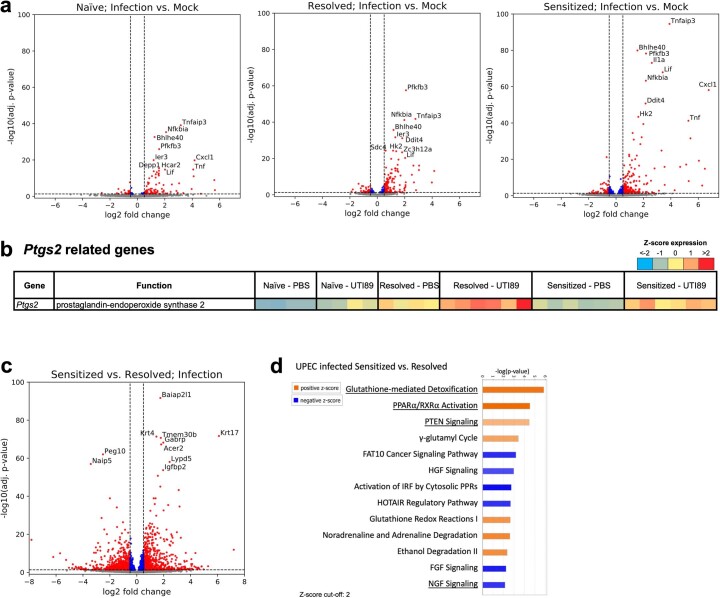
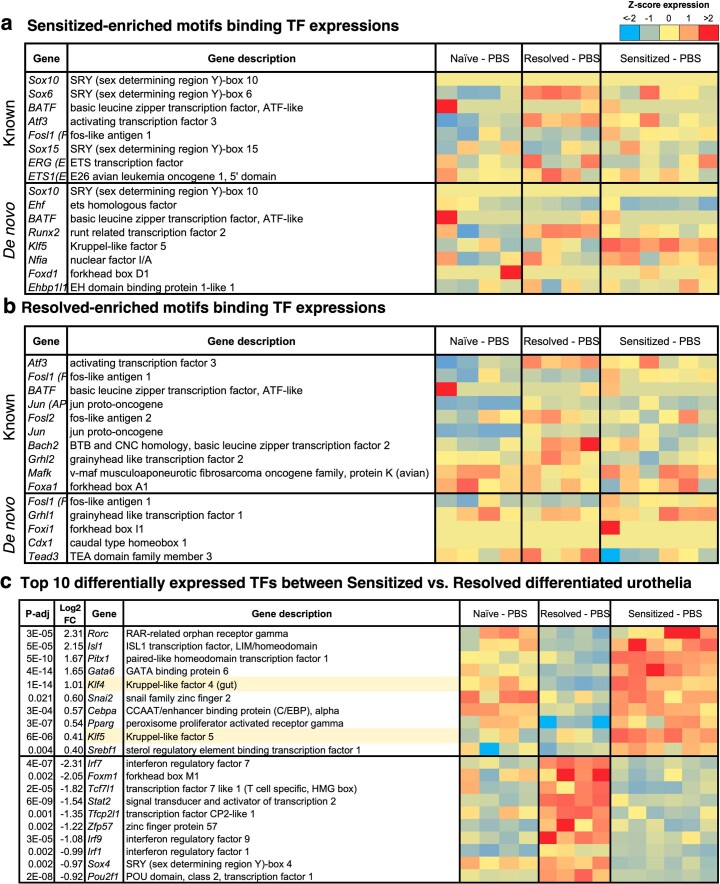
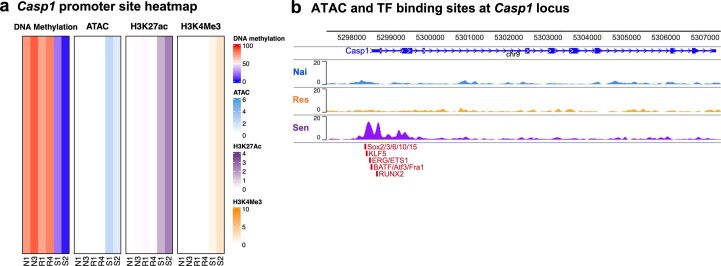
Previous urinary tract infections (UTIs) can predispose one to future infections; however, the underlying mechanisms affecting recurrence are poorly understood. We previously found that UTIs in mice cause differential bladder epithelial (urothelial) remodelling, depending on disease outcome, that impacts susceptibility to recurrent UTI. Here we compared urothelial stem cell (USC) lines isolated from mice with a history of either resolved or chronic uropathogenic Escherichia coli (UPEC) infection, elucidating evidence of molecular imprinting that involved epigenetic changes, including differences in chromatin accessibility, DNA methylation and histone modification. Epigenetic marks in USCs from chronically infected mice enhanced caspase-1-mediated cell death upon UPEC infection, promoting bacterial clearance. Increased Ptgs2os2 expression also occurred, potentially contributing to sustained cyclooxygenase-2 expression, bladder inflammation and mucosal wounding-responses associated with severe recurrent cystitis. Thus, UPEC infection acts as an epi-mutagen reprogramming the urothelial epigenome, leading to urothelial-intrinsic remodelling and training of the innate response to subsequent infection.


Conflict of interest statement

The authors declare no competing interests.

Figures

Fig. 1
Fig. 1. The culture of USCs of juvenile C3H/HeN mice regenerates differentiated urothelium in vitro.
a, USCs isolated from 8-week-old C3H/HeN mice were expanded by spheroidal culture in matrigel with 50% L-WRN conditioned media (CM) including Y-27632, a ROCK inhibitor, and SB431542, a TGF β type 1 inhibitor. After 3 d of spheroid culture, cells were dissociated into a single-cell suspension and 3–4 × 105 cells were seeded onto transwell membranes. The cells were cultured in 50% CM for 3–5 d, then cultured in 5% CM for 2–3 weeks until full differentiation. b, Cell cultures with a TER value >4,000 ohm × cm2 were then analysed (5 transwells cultured from one juvenile C3H/HeN cell line). For consistency, TER was measured 1 d after media change. c,d, Differentiated urothelia on the transwells were fixed and imaged via (c) confocal microscopy and (d) SEM to show a top-down view of the urothelium at magnification 500× (top panel) and 10,000× (bottom panel). In c, samples were stained for F-actin, the terminal differentiation marker K20 and nuclei (DAPI). eh, The urothelia were also paraffin-embedded, sectioned and stained with hematoxylin and eosin (H&E) (e) and immunostained for K20, Ecad and DAPI (f), Upk3a, p63 and DAPI (g) or K5, K14 and DAPI (h). Representative images are shown. Data are from 2–3 independent experiments using USCs from 5 different juvenile C3H/HeN mice. Source data
Fig. 2
Fig. 2. Differentiated urothelia originating from previously infected mice maintain bladder remodelling phenotypes.
a, Time course of initial infection with 108 c.f.u. UTI89 KanR and convalescent period in C3H/HeN mice. b, Representative urine bacterial titre time course over 4 wpi. Horizontal line represents the cut-off for notable bacteriuria: 104 c.f.u. ml−1. Naïve, resolved and sensitized mice were named as N1-4, R1-4 and S1-4. c,d, USCs isolated from these mice were cultured into differentiated urothelia on transwells, fixed and imaged via confocal microscopy (c) and SEM (d). In c, the urothelia were stained for K20, F-actin (Phalloidin) and nuclei (DAPI). e, Transwells were paraffin-embedded, sectioned and immunostained for Upk3a, E-cadherin and nuclei. White arrows show cell junctions indicating size of surface cells. f,g, Fixed slides processed from 44 transwells of naïve, resolved and sensitized mice (n = 16, 12 and 16 transwells from n = 4, 3, 4 mice, respectively) were stained for K20, E-cadherin and nuclei, labelled and imaged in a double-blind manner. Then the superficial cell sizes were automatically measured using the Fiji ImageJ macro programme and plotted for average cell size per transwell (f) and individual cell size (g), represented as median with 95% CI. Two-tailed Student’s t-test was used to determine significance and P values are indicated when significant. Source data
Fig. 3
Fig. 3. Convalescent mouse USCs have differential epigenetic memories upon UPEC infection.
Omni-ATAC-seq was performed using USCs from naïve, resolved and sensitized mice (cell lines N1, N3, R1, R4, S1 and S2, each from an individual mouse). a, PCA plot of DARs across the USC lines. b, Heat map of significantly differential peaks (FDR < 0.05) comparing sensitized vs resolved USCs. Out of all 2,880 DARs, 925 regions are sensitized-accessible DARs and 1,955 regions are resolved-accessible DARs. c, The top 15 enriched GO terms for sensitized-accessible DARs (n = 747, fold change >1.5, FDR < 0.05) were analysed using GREAT. Significance was determined using the binomial test. d,e, Differences in chromatin accessibility, DNA methylation and active histone modifications, H3K27Ac and H3K4Me3, in different USCs were assessed by ATAC-seq, whole genome bisulfite sequencing (WGBS) and CUT&RUN. d, Sensitized-specific DMRs (n = 189) among naïve, resolved and sensitized USCs are visualized as a series of heat maps displaying the epigenetic landscape overlapping each DMR for DNA methylation, ATAC and active histone modifications H3K27Ac and H3K4Me3. e, Average signals 5 kb upstream and 5 kb downstream of sensitized-specific hypo-DMRs (n = 183) for WGBS, ATAC, H3K27Ac and H3K4Me3 are visualized for each cell line. Average length of DMRs is 362 base pairs. DMRs are scaled for size with ‘start’ and ‘end’ of DMRs, which are indicated as grey bars. f, Sensitized-specific hypo-DMRs were annotated according to their predicted locations in the genome (n = 183). g, A PCA plot of all DMR comparisons showing clustering of the different cell lines. h, The top 15 enriched GO terms for sensitized hypo-DMRs were analysed using GREAT (n = 183). Source data
Fig. 4
Fig. 4. Differentiated urothelia originating from convalescent mice maintain differential transcriptomics observed in vivo.
RNAs were isolated from (a,b) undifferentiated juvenile naïve, adult naïve, resolved and sensitized USCs (cell lines of n = 3, n = 4, n = 4, n = 3 from 14 mice), or (cf) differentiated urothelia of naïve, resolved and sensitized cells (different cultures from N3, R3 and S3) with or without UPEC infection, then analysed by RNA-seq and by differential analysis. a, A PCA of USC RNA-seq by significantly differentially expressed genes shows that samples are clustered by cell lines (previous infection outcome). b, Forty differentially expressed genes (DEGs) were overlapping between sensitized vs naïve and sensitized vs resolved USCs. The top 15 overlapping DEGs are listed in the table. c, A PCA of differentiated urothelial RNA-seq shows clustering by cell lines (previous infection outcome) and secondary infection condition. d, A volcano plot comparing mock-infected sensitized vs resolved differentiated urothelia. DEGs with FC >0.5, Padj <0.05 are indicated as red dots. e, Pathway analysis was used to assess the biological pathways enriched in differentially expressed genes in mock-infected sensitized relative to resolved differentiated urothelia. Significance was determined using a right-tailed Fisher’s exact test, with Padj < 0.05 being considered as significantly enriched pathways. Shown are selected pathways with z-score >2 and –log(P value) >4.2 from the specific enriched pathways by IPA. Pathways overlapping between mock-infected and UPEC-infected differentiated urothelia (Extended data Fig. 8d) are underlined. f, A heat map showing programmed cell death associated genes that are differentially expressed in mock-infected naïve, resolved and sensitized differentiated urothelia. Significance of DEGs was determined using Wald test, followed by multiple test correction using Benjamini-Hochberg FDR for adjusted P value. Source data
Fig. 5
Fig. 5. Increased caspase-1-mediated inflammatory cell death in sensitized USCs may protect sensitized mice from acute and chronic UPEC infection.
a, For those DMRs found within 1 kb of promoter regions, RNA-seq fold changes comparing sensitized vs resolved differentiated urothelia either with (y axis, dark purple dots) or without infection (y axis, grey dots) were plotted against the DNA methylation differences (x axis) between sensitized and resolved USCs. b,c, Differences in chromatin accessibility (ATAC-seq), DNA methylation (WGBS) and active histone modifications (H3K4me3 and H3K27ac) at the Casp1 (b) and Ptgs2os2 (c) loci in different USC lines were visualized as combined tracks using the WashU Epigenome Browser map. In WGBS data, the average % methylation at the Casp1 and Ptgs2os2 promoter sites (red box) are indicated; colour bars represent % methylation, grey backgrounds represent CpGs, and black lines indicate sequencing depth. CpGs within the Casp1 and Ptgs2os2 promoter regions have 8–25x and 18–23x read coverage, respectively. d, Gene expression of Casp1 in differentiated urothelia was measured by RT–qPCR (data from n = 4, 4, 4, 5, 4, 4 samples generated from adult naïve, resolved and sensitized differentiated urothelia that are then infected with either PBS or UTI89, respectively, are represented as mean ± s.d.). e, Protein expression of caspase-1 using two different cell lines (N2, R2, S2 and N3, R3, S3) was assessed by western blot, and N3, R3 and S3 are represented. f, Cell death of differentiated urothelia 4 h after UTI89 infection was measured by LDH assay. Data are mean ± s.d., obtained from n = 7, 10, 14, 8, 10, 4, 6 samples from generated from adult naïve, resolved and sensitized differentiated urothelia, 2–3 biologically independent cell lines, per condition, that are then infected with either PBS or UTI89, respectively; significance was determined with a one-way analysis of variance (ANOVA). g,h, Naïve, resolved and sensitized mice were challenged with 107 c.f.u. of WT UTI89 (HlyA+) or UTI89ΔhlyA. Data are combined from 2–3 independent experiments. g, Bladder bacterial burdens at 6 hpi (n = 10, 7, 19, 8, 14, 11 adult naïve, resolved and sensitized mice challenged with 107 c.f.u. of either UTI89 or UTI89ΔhlyA, respectively) examined over 2–3 independent experiments. Bars indicate median values and two-tailed Mann–Whitney U test was used to determine significance. h, Incidence of chronic cystitis at 28 dpi. Two-sided Fisher’s exact test; P values are indicated when significant. Source data
Extended Data Fig. 1
Extended Data Fig. 1. Primary epithelial stem cells possess differentiation potential and stemness, related to Fig. 1.
(A) For the cell expansion, dissociated cell aggregates were embedded in fresh matrigel then developed into new spheroids. Urothelial spheroids can be passaged every 3 days using 1:2–1:3 dilutions depending on cell density. (B-D) Primary USCs originated from 8 week old C3H/HeN mice were cultured in matrigel with 50% CM. After 3 days of culture in 50% CM, media were changed to fresh 50% CM or 5% CM at 3, 5, and 7 days, then RNAs were isolated at 1, 2, 3 (yellow), 5 (green), and 7 days (orange) (USC culture n = 12, 9, 13, 12, 12, 11, 11 respectively). (B) Gene expression of p63, (C) Axin2, a Wnt signaling marker, and (D) Upk3a, a urothelial cell differentiation marker, was measured by qRT-PCR and data is represented as mean ± SD. Significance was determined by an unpaired (two-tailed) t test. (E) To culture bladder organoids in matrigel, USCs were pre-cultured in 50% CM for 3 days, gently dissociated, then passaged into fresh matrigel for culture in 50% CM or 0% CM for 5 days, while media were changed every 2 days. After 5 day culture, USC spheroids were fixed with 10% neutral buffered formaldehyde (NBF) and prepared for paraffin embedding. The slide with paraffin sections were stained with hematoxylin and eosin (H&E) and immunostained for Upk3a (red), E-cadherin (yellow), and DAPI (blue) or K20 (red), K5 (yellow), and DAPI (blue). Source data
Extended Data Fig. 2
Extended Data Fig. 2. The differentiated urothelium better recapitulates bladder tissue phenotypes than the human bladder carcinoma cell line 5637 does, related to Fig. 1.
(A) Primary C3H/HeN urothelial cells and 5637 cells were cultured in Transwells for 2–3 weeks and transepithelial electrical resistance (TER) of Transwells were measured every 2 days before media change. Data collected from each cell lines (n = 3 for each) represented as mean ± SD. (B) Whole mount urothelium of both cell types were fixed and stained for confocal microscopy analysis; F-actin (green) and DAPI (blue). (C) Surface cell size of primary C3H/HeN urothelial cells and 5637 cells was measured using confocal images (n = 10 each). Data are represented as mean ± SD and significance was determined by an unpaired (two-tailed) t test (p-value <0.001). (D) The Transwell cultures of both C3H/HeN and 5637 cells were fixed, cut into slices, and then processed for paraffin embedding. Histologic sections were cut and stained with H&E or immunostained for Upk3a, K20, Ecad, K5, p63, and DAPI. Source data
Extended Data Fig. 3
Extended Data Fig. 3. Enriched motifs of Sensitized and Resolved-specific DARs, related to Fig. 3 and Fig. 5.
(A-B) HOMER motif analysis using USC ATAC-seq data (Fig. 4a) generated lists of enriched TF binding motifs in Sensitized-accessible DARs (A) and Resolved-accessible DARs (B) with their p-values. HOMER scanned the sequences of DARs for known motifs and calculate enrichment score p-value using binomial test. HOMER also discovered de novo motifs with their best matches to a known motif in DARs. Each Top 10 known and de novo motifs enriched in Sensitized (A) and Resolved USCs (B) are shown with their sequence logo and p-value.
Extended Data Fig. 4
Extended Data Fig. 4. DNA methylation distribution for cell lines and cell line-specific differentially methylated regions (DMRs).
(A) Venn diagram of all the DMR comparisons with the numbers of each of the comparisons. The Sensitized-specific DMRs are shown in the overlap between Naïve vs Sensitized and Sensitized vs Resolved DMR comparisons. (B) The density of CpG methylation shows a bimodal distribution with no global differences in DNA methylation between the three groups (Naïve, Resolved and Sensitized USCs), where CpG methylation represents the fraction of total reads that are methylated per CpG site. Source data
Extended Data Fig. 5
Extended Data Fig. 5. The repressive histone mark H3K27Me3 is not different between Naïve, Resolved, and Sensitized cell types, related to Fig. 3.
(A) Sensitized-specific DMRs among Naïve, Resolved, and Sensitized USCs are visualized as a series of heatmaps displaying DNA methylation, ATAC, and histone modifications: H3K27Ac (active promoter/enhancer), HeK4Me3 (promoter), and H3K27Me3 (polycomb repression). (B) Average signals 5 kb upstream and 5 kb downstream of Sensitized-specific hypo-DMRs for H3K27Me3 (polycomb repression) are visualized for each cell line.
Extended Data Fig. 6
Extended Data Fig. 6. RNA-seq of primary USCs originating from convalescent mice revealed that sensitized USCs maintain differential gene expressions after several passages, related to Fig. 4.
RNAs were isolated from Naïve, Resolved, and Sensitized USCs, then analysed by RNA-seq and performed differential analysis. Significance was determined by Wald test followed by multiple test correction using Benjamini-Hochberg FDR for adjusted p-value.108 and 73 genes were significantly differentially expressed in Sensitized USCs relative to (A) Naïve and (B) Resolved USCs (P-adj < 0.05). Enriched pathways in Sensitized USCs compared with (C) Naïve and (D) Resolved USCs are listed here. Overlapping pathways in both analyses are underlined. IPA determine significance using a right-tailed Fisher’s exact test, with P-adjusted <0.05 considered significantly enriched pathways. Source data
Extended Data Fig. 7
Extended Data Fig. 7. Juvenile Naïve USCs have a different gene expression profile with the other cell types, related to Fig. 4.
RNA was isolated from Juvenile Naïve, Adult Naïve, Resolved and Sensitized USCs (cell lines of n = 3, n = 4, n = 4, n = 3 from 14 mice). Then, an RNA-seq analysis was performed as described in Fig. 4a. Significance was determined by Wald test followed by multiple test correction using Benjamini-Hochberg FDR for adjusted p-value. (A) A volcano plot of differentially expressed genes (DEGs) comparing Juvenile Naïve vs Adult Naïve USCs identify 8 significantly DEGs (FDR cutoff 0.1). (B) The PCA biplot for the PCA shown in Fig. 4a indicates how strongly each gene influences the principal components (PC). Genes including Znfx1 and Ly6e strongly influence PC1 (Dim1) while genes including Kank1 and Krt1 strongly influence PC2 (Dim2). Source data
Extended Data Fig. 8
Extended Data Fig. 8. Differential transcriptomics of differentiated urothelia originating from convalescent mice recapitulate in vivo studies, related to Fig. 4.
RNA-seq data of UTI89 infected and mock-infected differentiated urothelia (Fig. 4c) was used to perform differential analysis. (A) Volcano plots comparing UPEC infected vs mock-infected Naïve, Resolved, and Sensitized differentiated urothelia (UPEC infection response). (B) Differential gene expression of Ptgs2 between Naïve, Resolved, and Sensitized differentiated urothelia with or without UTI89 infection is visualized as a heatmap. (C) A volcano plot comparing UTI89 infected Sensitized vs Resolved differentiated urothelia was performed. (D) Pathway analysis was used to assess the biological pathways enriched in differentially expressed genes in UPEC infected Sensitized differentiated urothelia relative to Resolved differentiated urothelia, and significance was determined by a right-tailed Fisher’s exact test, with P-adjusted <0.05 considered significantly enriched pathways. Shown are selected pathways with z-score > 2 and –log(p-value) > 2 from the specific enriched pathways by IPA. Source data
Extended Data Fig. 9
Extended Data Fig. 9. Differential gene expression of TFs between Sensitized vs. Resolved differentiated urothelia, related to Figs. 3 and 4.
(A-B) HOMER motif analysis of ATAC-seq data in Fig. 4 was performed to show differential TF binding motif enrichment in the DARs found in Sensitized and Resolved USCs. Using a list of each top 10 known and de novo motifs of Sensitized-accessible DARs (A) and Resolved-accessible DARs (B) (Extended Data Fig. 3a, b), differential gene expressions of these motif binding TFs in Naïve, Resolved, and Sensitized differentiated urothelia are visualized as heatmaps. Genes that are not found in RNA-seq data are excluded from the heatmap. (C) Top 10 differentially expressed TFs between Sensitized vs. Resolved differentiated urothelia are visualized as a heatmap with Log2(FC) and P-adj indicated. Significance of DEGs was determined by Wald test followed by multiple test correction using Benjamini-Hochberg FDR for adjusted p-value.
Extended Data Fig. 10
Extended Data Fig. 10. Increased chromatin accessibility for TF binding at Casp1 locus in Sensitized USCs, related to Figs. 3 and 5.
(A) Differences in chromatin accessibility, DNA methylation, and histone modifications, H3K4Me3 and H3K27Ac, in different USCs were assessed by ATAC-seq, whole genome bisulfite sequencing (WGBS), and CUT&RUN. Relative DNA methylation, chromatin accessibility, and histone modifications at the Casp1 promoter site comparing Naïve, Resolved and Sensitized USCs are shown as a heatmap by displaying the normalized signal using read coverage and fraction of reads under consensus peaks. (B) Potential TF binding sites near Casp1 promoter are visualized on the epigenome browser map.

Comment in

References

    1. Foxman B. Epidemiology of urinary tract infections: incidence, morbidity, and economic costs. Dis. Mon. 2003;49:53–70. doi: 10.1067/mda.2003.7. - DOI - PubMed
    1. Foxman B, Barlow R, D’Arcy H, Gillespie B, Sobel JD. Urinary tract infection: self-reported incidence and associated costs. Ann. Epidemiol. 2000;10:509–515. doi: 10.1016/S1047-2797(00)00072-7. - DOI - PubMed
    1. Godaly G, Ambite I, Svanborg C. Innate immunity and genetic determinants of urinary tract infection susceptibility. Curr. Opin. Infect. Dis. 2015;28:88–96. doi: 10.1097/QCO.0000000000000127. - DOI - PMC - PubMed
    1. Ferry SA, Holm SE, Stenlund H, Lundholm R, Monsen TJ. The natural course of uncomplicated lower urinary tract infection in women illustrated by a randomized placebo controlled study. Scand. J. Infect. Dis. 2004;36:296–301. doi: 10.1080/00365540410019642. - DOI - PubMed
    1. Hannan TJ, Mysorekar IU, Hung CS, Isaacson-Schmid ML, Hultgren SJ. Early severe inflammatory responses to uropathogenic E. coli predispose to chronic and recurrent urinary tract infection. PLoS Pathog. 2010;6:e1001042. doi: 10.1371/journal.ppat.1001042. - DOI - PMC - PubMed

Publication types

MeSH terms