. 2023 May;8(5):986-998.
doi: 10.1038/s41564-023-01345-7. Epub 2023 Apr 10.

Expanding known viral diversity in the healthy infant gut

Affiliations

Expanding known viral diversity in the healthy infant gut

Shiraz A Shah et al. Nat Microbiol. 2023 May.

Abstract

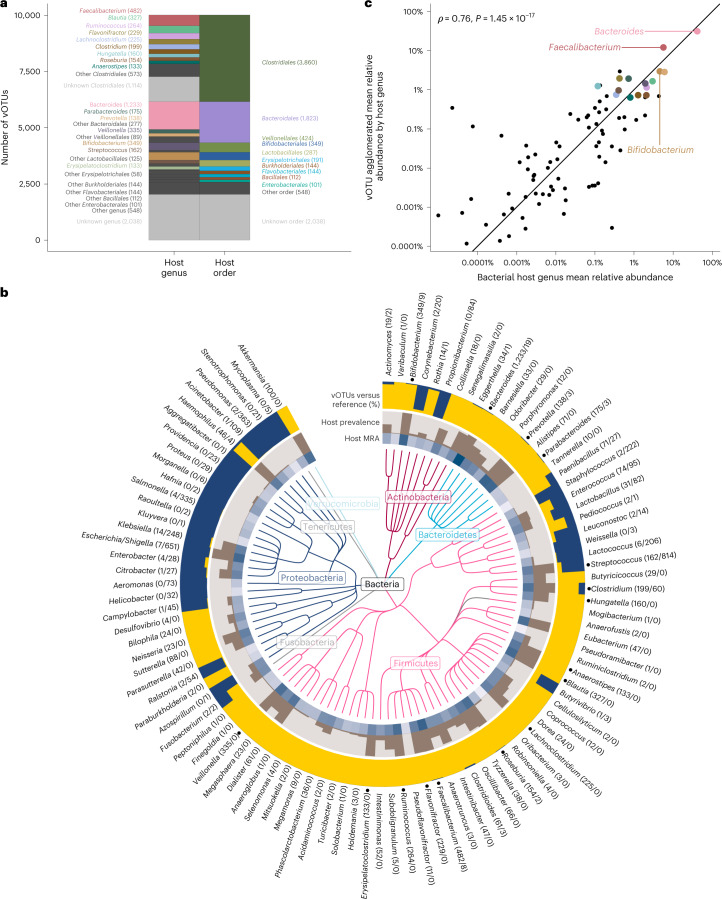
The gut microbiome is shaped through infancy and impacts the maturation of the immune system, thus protecting against chronic disease later in life. Phages, or viruses that infect bacteria, modulate bacterial growth by lysis and lysogeny, with the latter being especially prominent in the infant gut. Viral metagenomes (viromes) are difficult to analyse because they span uncharted viral diversity, lacking marker genes and standardized detection methods. Here we systematically resolved the viral diversity in faecal viromes from 647 1-year-olds belonging to Copenhagen Prospective Studies on Asthma in Childhood 2010, an unselected Danish cohort of healthy mother-child pairs. By assembly and curation we uncovered 10,000 viral species from 248 virus family-level clades (VFCs). Most (232 VFCs) were previously unknown, belonging to the Caudoviricetes viral class. Hosts were determined for 79% of phage using clustered regularly interspaced short palindromic repeat spacers within bacterial metagenomes from the same children. Typical Bacteroides-infecting crAssphages were outnumbered by undescribed phage families infecting Clostridiales and Bifidobacterium. Phage lifestyles were conserved at the viral family level, with 33 virulent and 118 temperate phage families. Virulent phages were more abundant, while temperate ones were more prevalent and diverse. Together, the viral families found in this study expand existing phage taxonomy and provide a resource aiding future infant gut virome research.


Conflict of interest statement

S.A.S. is a consultant for profluent.bio on a matter that is unrelated to the present study. D.S.N. has functioned as a consultant for the companies Pfizer and Sniprbiome on scientific matters not related to the present study. All remaining authors declare no conflicts of interest.

Figures

Fig. 1
Fig. 1. An atlas of infant gut DNA virus diversity.
Faecal viromes from 647 infants at age 1 year were deeply sequenced, assembled and curated, resulting in the identification of 10,021 viral species falling within 248 VFCs. Predicted host ranges for each VFC are given, and the VFCs have been grouped into 17 VOCs. Trees show how VFCs are interrelated within each VOC, and heat maps and histograms encode their genome size, lifestyle, host range, abundance and prevalence across the cohort as well as in published gut virus databases. For the 16 previously known viral families, names are written in red. An interactive version of the figure with expandable families can be accessed online, for browsing the gene contents and downloading the genome of each virus: http://copsac.com/earlyvir/f1y/fig1.svg.
Fig. 2
Fig. 2. Abundance, prevalence and richness of the viral clades in the 1-year-old infant gut.
Already-known viral clades are indicated in italics. ssDNA clades have been marked with a star as their abundances may be inflated from amplification bias. a, Prevalence and MRA of the 17 VOCs across samples. b, Prevalence and MRA of the 248 VFCs. The major VFCs were defined as the ten most abundant caudoviral VFCs in the data, and are coloured and labelled. Minor VFCs as well as ssDNA families are in grey. Predicted lifestyles for the ten major VFCs are indicated by different shapes. c, VOCs and VFCs scaled by species richness, ordered by MRA. VOC12 and Rowavirales are not shown due to their small sizes. The VFCs are represented underneath the VOCs they belong to. Clade prevalence, abundance and species richness are highly interrelated, and several previously undescribed clades outnumber crAssphage in the infant gut.
Fig. 3
Fig. 3. Temperate versus virulent viral families in the infant gut.
ae, Characteristics of temperate versus virulent VFCs in the data in terms of MRA (a), prevalence (b), genetic diversity as measured by unique branch length (c), number of metagenomic CRISPR spacer matches (d) and host range (number of host species) (e). f, Fit of the neutral community model, on the VFCs from Fig. 2b. g, Deriving neutral community model residuals from the log-transformed prevalences. h, Comparison of neutral community model residuals, showing that temperate VFCs tend to have positive residuals, whereas virulent VFCs tend towards negative residuals, indicating that temperate phages are present in lower abundance despite being found in more children, as compared with virulent phages. For ae and h, n = 151 (118 temperate + 33 virulent). Box plot elements: centre line, median; box limits, upper and lower quartiles; whiskers, 1.5× IQR; points, outliers. Two-sided Wilcoxon test P values reported. For f and g, n = 248 (118 temperate + 33 virulent + 97 unknown).
Fig. 4
Fig. 4. Phages and their bacterial hosts in the 1-year-old infant gut.
Prediction of bacterial hosts for the 10,021 vOTUs found in the infant gut virome shows that Bacteroides, Faecalibacterium and Bifidobacterium are the three most prominent host genera. a, Distribution of virus host predictions collapsed to bacterial order and genus levels, respectively. Numbers in parentheses denote the number of vOTUs with a given host genus or order, respectively. b, The top 100 gut bacterial genera found in gut metagenomes from the same infant faecal samples, as represented by a taxonomic tree. The MRA of each bacterial genus is shown in the blue heat map, while the fraction of the 647 infants harbouring the host genus (that is its prevalence) is shown with the brown bar plot. The outer ring displays per bacterial genus, the proportion of infant gut vOTUs (yellow) relative to reference phage species with known hosts (dark blue). Numbers behind each genus name denote the total number of vOTUs versus reference phage species per bacterial host genus. The 16 major host genera from a are indicated by a dot in front of their names in b. c, Each dot represents a genus from b, by its MRA in the metagenome against the aggregate MRA of all its vOTUs in the virome. Host abundances correlated strongly with corresponding phage abundances as tested by a Spearman’s rank test (two-sided P value).
Extended Data Fig. 1
Overview of decontamination and curation procedure.
Extended Data Fig. 2
Extended Data Fig. 2. Clickable gene map of vOTUs belonging to the the Ingridviridae family.
Available online at http://copsac.com/earlyvir/f1y/families/Ingridviridae.svg along with similar maps for the remaining 247 families, available via http://copsac.com/earlyvir/f1y/fig1.svg. Small vertical gaps between vOTUs denote genus boundaries, while large gaps denote subfamily boundaries. Ordering of the vOTUs follows the order in the APS tree and thus, related vOTUs are next to each other. ORFs are aligned vertically based on strandedness and colored by VOG affiliation. VOG definitions against the PhROGs database can be looked up by clicking on each ORF. ORF gene product (GP) numbers are displayed by mouse-over hovering. GenBank files for each vOTU can be viewed along with virus and host taxonomy by clicking on the OTU name. Caudoviral maps were inverted and zeroed according to TerL gene coordinates, while the GenBank files were not. Reference phages that belong to the same family were also included in the maps and are indicated by GenBank accession numbers.
Extended Data Fig. 3
Extended Data Fig. 3. From assembly to curated vOTUs in numbers.
After assembly, species-level deduplication and manual decontamination, most sequence clusters were inferred to be non-viral and had small sizes while viral OTUs were much fewer but longer (A). After mapping, vOTUs accounted for roughly half of the reads (B). 97% of the reads originally comprised “dark matter” but only 7% was left after resolution (C). The 10,021 curated vOTUs fell within five viral classes (caudoviruses [dsDNA], microviruses [ssDNA], anelloviruses [ssDNA], inoviruses [ssDNA] and adenoviruses [dsDNA]). Distributions of the viral classes by: mapped reads (D), MRAs, after normalising read counts for sequencing depth and genome size (E) and species richness, that is number of vOTUs (F) are shown. G) Same as F but at viral order-level, with orders colored as in Fig. 2.
Extended Data Fig. 4
Extended Data Fig. 4. Features of vOTUs versus non-viral sequence clusters within data.
Distribution of size, MRA and sample prevalence for contaminant non-viral sequence clusters and curated vOTUs respectively. The vOTU size distribution shows peaks corresponding to genome lengths for the three major classes of viruses in the dataset, namely anelloviruses, microviruses and caudoviruses (3 kb, 5.5 kb, and 40 kb). The contaminant size distribution peaks at the contig inclusion cutoff (1 kb) continuing with a long uniform tail, consistent with the unspecific origin expected for contaminating DNA. Curated vOTUs were more abundant and prevalent than contaminating species. The majority of the contaminating sequences were sample-specific, in contrast to most curated vOTUs which were found in more than one sample. The latter is consistent with their bacterial chromosomal origin, as unspecific subsampling of the large bacterial genome space is unlikely to yield overlaps between samples.
Extended Data Fig. 5
Extended Data Fig. 5. Comparison of three approaches for estimating the proportion of bacterial contamination.
Each graph has 647 dots, one for each sample. Axes denote the proportion of bacterial contamination as estimated by the indicated method. Each graph is a pairwise comparison of two different methods. A) mappings to non-viral sequence clusters versus ViromeQC B) non-viral sequence cluster mappings versus metagenome core gene depletion C) metagenome core gene depletion versus ViromeQC. Spearman’s correlation coefficients (ρ) are given for all three comparisons.
Extended Data Fig. 6
Extended Data Fig. 6. Viral family species-richness is linked to prevalence and abundance.
The species-richness within a family is highly correlated with both its prevalence (A) and the MRA across samples (B), shown here with Spearman’s correlation tests (two-sided P values). MRAs are correspondingly correlated with prevalence as already shown in Fig. 3. The correlation between all three measures is in line with predictions made by the neutral community model. MRA, mean relative abundance.
Extended Data Fig. 7
Extended Data Fig. 7. Sample-to-sample co-abundance of phages in the virome and host-bacteria in the metagenome.
Correlations between host bacterial relative genus abundances in the metagenomes with aggregate relative abundances for phages predicted to infect those host genera in the virome, compared across all children. A) Volcano plot showing how all significant correlations between phage-host pairs were positive (ρ > 0; n = 87 genera, Spearman’s correlation tests, two-sided P values). B) The distribution of these correlation values was significantly higher than zero (One-sample Wilcoxon test, two-sided P = 2.4·10-12, n = 87, right side), whereas random non-matched phage-host pairs were centered around zero (left side). C) These correlations were positive regardless of phage lifestyle (one-sample Wilcoxon tests with two-sided P values), and D) stood out against the background of all genus combinations tested (same data shown in panel B, diagonal is matched phage-host pairs and off-diagonal are non-matched pairs). Boxplots demonstrate median, middle line; lower and upper quartile, box bounds; and most extreme observations within 1.5 x interquartile range above/below box, whiskers. All individual data points are overlaid on the boxplots.
Extended Data Fig. 8
Extended Data Fig. 8. Mean co-abundance of phages and hosts regardless of viral lifestyle.
Correspondence between host genus abundances in the metagenome with aggregate abundances for all phages infecting those genera in the virome, as stratified by virus lifestyle, namely, temperate phages (A) and virulent phages (B). The MRA of both virulent and temperate phages correlates positively with host MRA. MRA, mean relative abundance. Correlations were tested using Spearman’s rank test (two-sided P values).
Extended Data Fig. 9
Extended Data Fig. 9. The sMDA amplified viromes are quantitative for dsDNA phages.
The relationship between experimentally determined PFU/g of faeces for 32 coliphages, against mapped virome and metagenome reads per kilobase per million (RPKM), from the corresponding 32 samples. The two panels show data for temperate and virulent coliphages respectively. Axes were log-transformed to capture the dynamic range. A linear model was fit following log-transformation. Temperate coliphages show only a tendency of being associated presumably because read-mappings were shared between induced phage DNA and bacterial chromosomal DNA. For the virulent coliphages, however, the relationship was quantitative throughout the range of PFU counts (from 270 to 1.6 M). The sMDA amplified virome is no less quantitative than the unamplified metagenomes for the same samples. sMDA: short multiple-displacement amplification. Paired viromes/metagenomes from the same samples are connected using dashed lines. Regression lines are drawn using linear models, the shaded area represents the 95% confidence band for the regression line. P values correspond to Spearman’s rank correlation tests, are two-sided and were not adjusted for multiple comparisons.

References

    1. Moeller AH, et al. Cospeciation of gut microbiota with hominids. Science. 2016;353:380–382. doi: 10.1126/science.aaf3951. - DOI - PMC - PubMed
    1. Milani C, et al. The first microbial colonizers of the human gut: composition, activities, and health implications of the infant gut microbiota. Microbiol. Mol. Biol. Rev. 2017;81:e00036-17. doi: 10.1128/MMBR.00036-17. - DOI - PMC - PubMed
    1. Johnson CC, Ownby DR. The infant gut bacterial microbiota and risk of pediatric asthma and allergic diseases. Transl. Res. 2017;179:60–70. doi: 10.1016/j.trsl.2016.06.010. - DOI - PMC - PubMed
    1. Kalliomäki M, Collado MC, Salminen S, Isolauri E. Early differences in fecal microbiota composition in children may predict overweight. Am. J. Clin. Nutr. 2008;87:534–538. doi: 10.1093/ajcn/87.3.534. - DOI - PubMed
    1. Stokholm J, et al. Maturation of the gut microbiome and risk of asthma in childhood. Nat. Commun. 2018;9:141. doi: 10.1038/s41467-017-02573-2. - DOI - PMC - PubMed

Publication types

Grants and funding