Clinical Trial
. 2023 Apr;4(4):535-549.
doi: 10.1038/s43018-023-00542-x. Epub 2023 Apr 10.

PD-L1 blockade in combination with carboplatin as immune induction in metastatic lobular breast cancer: the GELATO trial

Affiliations
Clinical Trial

PD-L1 blockade in combination with carboplatin as immune induction in metastatic lobular breast cancer: the GELATO trial

Leonie Voorwerk et al. Nat Cancer. 2023 Apr.

Abstract

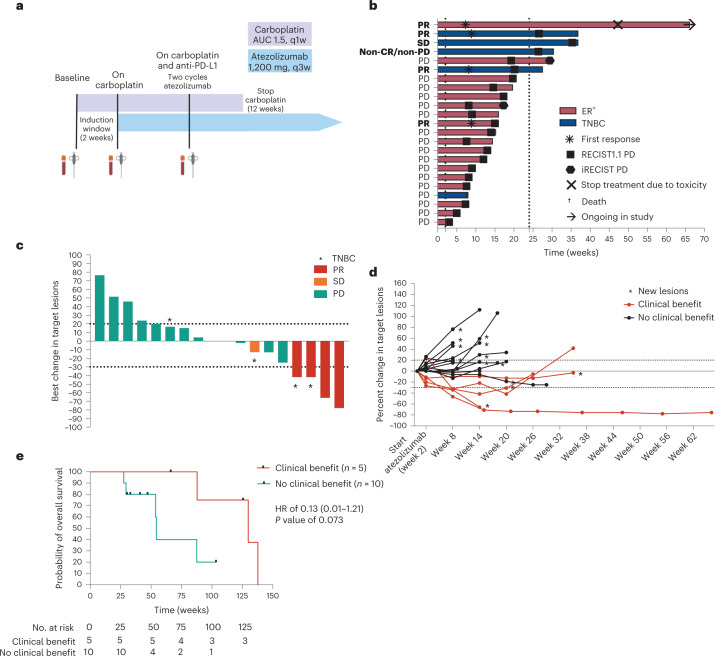
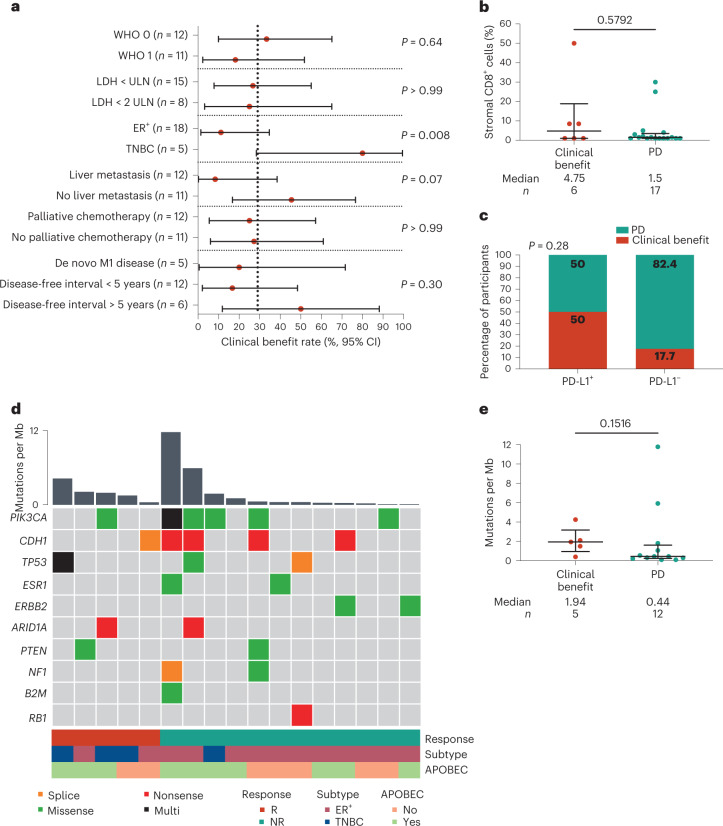
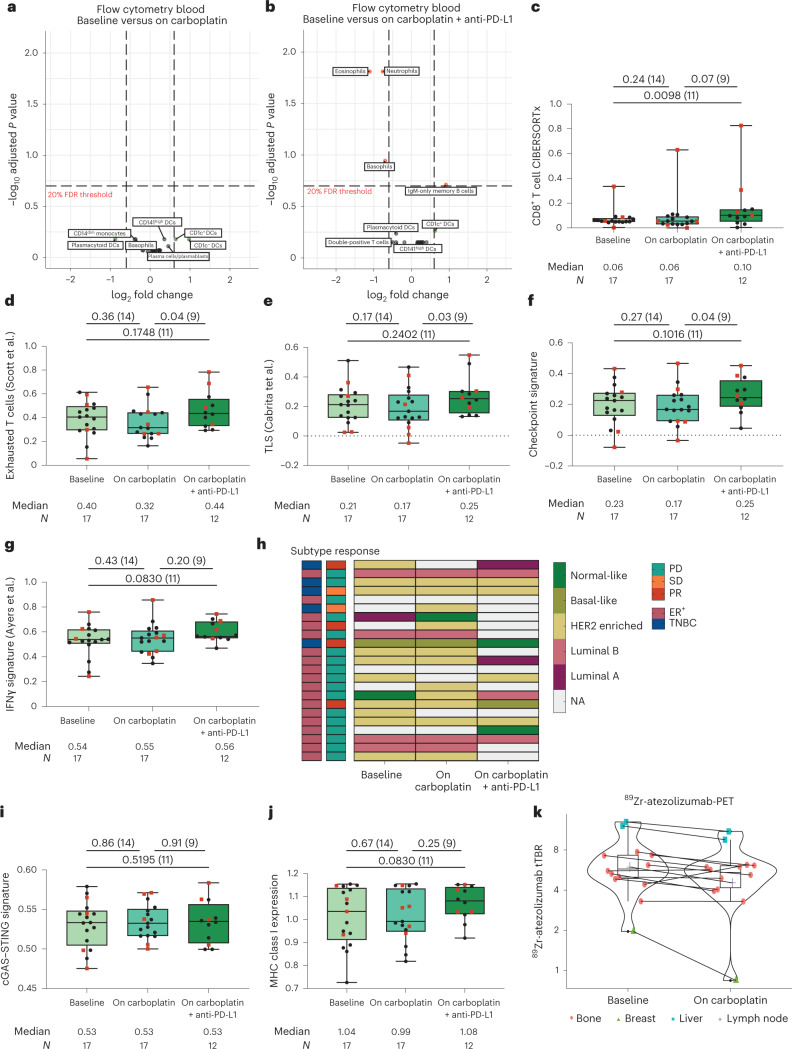
Invasive lobular breast cancer (ILC) is the second most common histological breast cancer subtype, but ILC-specific trials are lacking. Translational research revealed an immune-related ILC subset, and in mouse ILC models, synergy between immune checkpoint blockade and platinum was observed. In the phase II GELATO trial ( NCT03147040 ), patients with metastatic ILC were treated with weekly carboplatin (area under the curve 1.5 mg ml-1 min-1) as immune induction for 12 weeks and atezolizumab (PD-L1 blockade; triweekly) from the third week until progression. Four of 23 evaluable patients had a partial response (17%), and 2 had stable disease, resulting in a clinical benefit rate of 26%. From these six patients, four had triple-negative ILC (TN-ILC). We observed higher CD8+ T cell infiltration, immune checkpoint expression and exhausted T cells after treatment. With this GELATO trial, we show that ILC-specific clinical trials are feasible and demonstrate promising antitumor activity of atezolizumab with carboplatin, particularly for TN-ILC, and provide insights for the design of highly needed ILC-specific trials.


Conflict of interest statement

L.V., O.I.I., S.B., M.C., N.A.M.B., E.C., H.G., K.S., C.E.L., I.K., I.A.M.M., M.d.M., J.J.L.v.G., J.B., M.G.J.v.D. and A.J. have no competing interests to declare. H.M.H. reports consultancy fees from Roche Diagnostics paid to the institute and is an advisor for SlideScore and Ellogon from Roche Diagnostics, outside the submitted work. M.d.B. received funding from Roche, AstraZeneca, Novartis, Pfizer, Eisai and Eli Lilly, outside the submitted work. R.S. reports non-financial support from Merck and Bristol Myers Squibb (BMS), research support from Merck, Puma Biotechnology and Roche and personal fees from Roche, BMS and Exact Sciences for advisory boards, all outside the scope of this paper. G.S.S. reports research funding to the institute from Merck, Agendia, AstraZeneca, Roche and Novartis and a consulting role for Novartis, Seattle Genetics and Biovica, outside the submitted work. K.E.d.V. reports research funding from Roche and is a consultant for Macomics, outside the scope of this work. T.N.S. is a consultant for Third Rock Ventures and is a stockholder and advisor in Allogene Therapeutics, Asher Bio, Celsius, Merus, Scenic Biotech and Neogene Therapeutics, outside this work. C.U.B. has received research grants from Novartis, BMS and NanoString, is a paid advisory board member for BMS, MSD, Roche, Novartis, GlaxoSmithKline, AstraZeneca, Pfizer, Lilly, GenMab and Pierre Fabre and holds ownership interest in Uniti Card, Neon Therapeutics and Forty Seven, all outside this submitted work. L.F.A.W. reports funding to the institute from Genmab BV. V.C.G.T.-H. reports research funding to the institute from Roche, Eisai, Pfizer, Novartis, Lilly, Daiichi Sankyo/AstraZeneca and Gilead Sciences, a consulting role from Pfizer, Lilly, Accord Healthcare and Novartis and honoraria from Novartis, Roche, Lilly and AstraZeneca, all outside this submitted work. C.P.S. has received research funding to the institute from Pfizer, Roche, Genentech, SNS Oncology, G1 Therapeutics, Abbvie, Synthon and CytoMx Therapeutics, outside this work. S.C.L. reports research funding to the institute from Roche/Genentech, AstraZeneca, BMS, Tesaro, Merck, Immunomedics, Eurocept Pharmaceuticals, Agendia and Novartis and a consulting role and travel grant from Daiichi Sankyo, outside this work. M.K. reports funding to the institute from BMS, Roche and AstraZeneca/MedImmune and an advisory role for BMS, Roche, MSD and Daiichi Sankyo, outside the submitted work.

Figures

Fig. 1
Fig. 1. Design of the GELATO trial and efficacy data.
a, GELATO trial setup. Patients were treated with 12 cycles of low-dose carboplatin. Atezolizumab (anti-PD-L1) was added from the third cycle onward until disease progression or toxicity. Biopsies and blood were taken at baseline before the start of anti-PD-L1 treatment and during carboplatin + anti-PD-L1 treatment. Figure created with BioRender.com; q1w, weekly; q3w, triweekly. b, Swimmer’s plot of all included patients; n = 23 patients. Each bar reflects one patient and is annotated with events indicated by the legend and clinical response according to RECISTv1.1. The dotted lines indicate the start of anti-PD-L1 at 2 weeks and the 24-week landmark of the primary endpoint. Patients with clinical benefit are depicted in bold. c, Waterfall plot of patients with measurable disease; n = 18 patients. d, Change in target lesions of patients with measurable disease. The n is as in c. e, Kaplan–Meier curve of overall survival with a 24-week landmark in patients with clinical benefit versus no clinical benefit; n = 15 patients. The bottom table lists numbers at risk at indicated time points. A 24-week landmark was used, causing eight patients to be removed from the analysis (one patient with clinical benefit and seven patients with PD). The HR was calculated with Cox regression analysis on the patients alive at 24 weeks, including the 95% CI and P value.
Fig. 2
Fig. 2. Association of baseline clinical features and characteristics of the tumor microenvironment with clinical benefit.
a, Clinical benefit rate with 95% CI (shown as error bars) per indicated subgroup; n = 23 patients. Data were analyzed by two-sided Fisher’s exact test (two groups) or chi-squared test (multiple groups). b, Percentage of CD8+ cells in the stromal area of a metastatic lesion (IHC). Data are shown as median with interquartile range, and data were analyzed by two-sided Mann–Whitney U-test. The n is as in a. c, Percentage of patients with clinical benefit and PD-L1 expression (clone SP142). A cutoff of 1% expression on immune cells for PD-L1 positivity was used. Numbers in the graph indicate percentages. Data were analyzed by two-sided Fisher’s exact test. The n is as in a. d, Oncoplot of TMB (mutations per megabase (Mb)) and selected genes frequently altered in metastatic ILC assessed in biopsies of metastatic lesions. Data were available for 17 patients. Each column represents one patient and is annotated by response, subtype and enrichment of the APOBEC mutational signature; R, response; NR, no response. e, TMB of metastatic lesions in relation to response. The n is as in d. Data are presented as median with interquartile range. The statistics are as in b. In be, baseline metastatic lesions correspond to metastases presented in Fig. 3 and Extended Data Figs. 3 and 4.
Fig. 3
Fig. 3. Tumor-immune evolution in paired primary tumors, local recurrences and metastasis.
a, Gene set expression score of CD8+ T cells according to CIBERSORTx in paired primary tumors, recurrences and metastasis; N = 30 samples. b, Gene set expression score of resting mast cells according to CIBERSORTx in paired primary tumors, recurrences and metastasis. The N is as in a. c, Gene set expression score of memory B cells according to CIBERSORTx in paired primary tumors, recurrences and metastasis. The N is as in a. d, TMB in paired primary tumors, recurrences and metastasis; N = 26 samples. In ad, box plots display a minimum (Q0), a maximum (Q4), a median (Q2) and the interquartile range. Data were analyzed by two-sided Wilcoxon signed-rank test on paired primary tumors and metastases. The numbers of patients in each analysis are listed between brackets behind the P value. Red squares indicate patients with clinical benefit, and black dots indicate patients with no clinical benefit. Metastatic lesions correspond with baseline samples presented in Figs. 2 and 4 and Extended Data Figs. 2, 4 and 6.
Fig. 4
Fig. 4. Effects of carboplatin and anti-PD-L1 on circulating immune cells and the tumor microenvironment.
a, Volcano plot of the log2 (fold change) (horizontal axis) after two cycles of carboplatin to baseline in circulating immune cells, assessed by flow cytometry, and the adjusted P value (vertical axis). The dotted horizontal line indicates the 20% false discovery rate (FDR) threshold, and dotted vertical lines indicate a log2 (fold change) of 0.75. Sample pair dynamics were assessed analogously to the paired two-sided t-test. Multiple testing correction was performed by using the Benjamini–Hochberg procedure. For all tested populations, see Supplementary Table 5; n = 22 patients. b, Volcano plot of log2 (fold change) after carboplatin and anti-PD-L1 to baseline in circulating immune cells assessed by flow cytometry. Statistics are as in a; n = 18 patients. c, Gene set expression score of CD8+ T cells according to CIBERSORTx in serial metastatic biopsies taken at baseline after two cycles of carboplatin and after two cycles of anti-PD-L1 plus carboplatin; N = 46 samples. d, Gene expression of an exhausted T cell signature in serial biopsies of metastatic lesions. The N is as in c. e, Gene expression of a TLS signature in serial biopsies of metastatic lesions. The N is as in c. f, Gene expression of an immune checkpoint signature in serial biopsies of metastatic lesions. The N is as in c. g, Gene expression of an IFNγ signature in serial biopsies of metastatic lesions. The N is as in c. h, PAM50 molecular subtype assessed in serial biopsies of metastatic lesions. Each row is one patient, with the response annotated according to RECISTv1.1 and the subtype assessed on a metastatic lesion; n = 23 patients. NA, not applicable i, Gene expression of a cGAS–STING signature in serial biopsies of metastatic lesions. The N is as in c. j, Gene expression score of MHC class I-related genes (HLA-A, HLA-B and HLA-C). The N is as in c. k, TBR of 89Zr-atezolizumab-PET at baseline and after two cycles of carboplatin in 13 lesions of one patient. In cg and ik, box plots display a minimum (Q0), a maximum (Q4), a median (Q2) and the interquartile range. Data were analyzed by two-sided Wilcoxon signed-rank tests on paired samples. The numbers of patients in each analysis are listed between brackets behind the P value. Red squares indicate patients with clinical benefit, and black dots indicate patients with no clinical benefit. Baseline metastatic lesions correspond to metastases presented in Fig. 3 and Extended Data Figs. 3 and 4.
Extended Data Fig. 1
Flow chart of patient inclusion in the GELATO-trial.
Extended Data Fig. 2
Extended Data Fig. 2. Additional baseline tumor microenvironment features associated with clinical outcome.
(A) Percentage of stromal tumor-infiltrating lymphocytes (sTILs). N = 23 samples. (B) Gene expression of an IFNy signature. N = 17 samples. (C) Gene expression of an exhausted T-cell signature. N as in (B). (D) Gene expression of a tertiary lymphoid structure (TLS) signature. N as in (B). (E) Gene expression of an immune checkpoint signature. N as in (B). (F) Tumor mutational burden (TMB, mutations per MB) in ER + vs triple-negative ILC. N as in (B). (G) Mutational signatures enriched in metastatic lesions. N as in (B). (AF) Median with interquartile range, statistics by two-sided Mann-Whitney-U test. Baseline metastatic lesions correspond to metastases presented in Fig. 3 and Extended Data Figs. 3 and 4.
Extended Data Fig. 3
Extended Data Fig. 3. Evolution of sTILs, stromal CD8+ cells, PD-L1 expression and immune-related gene sets from paired primary tumors, local recurrences and metastasis.
(A) Percentage of stromal tumor-infiltrating lymphocytes (sTILs) in paired primary tumors, recurrences, and metastases. N = 43 samples. (B) Percentage of CD8+ T cells in the stromal area (immunohistochemistry). N as in (A). (C) Percentage of patients with clinical benefit and PD-L1 expression (clone SP142) in metastatic lesions. A cut-off of 1% expression on immune cells was used to determine PD-L1 positivity. Statistics by Fisher’s exact test (primary versus metastasis) for proportions. N as in (A). (D) Gene expression of an IFNy signature. N = 30 samples. (E) Gene expression of an exhausted T-cell signature. N as in (D). (F) Gene expression of a tertiary lymphoid structure (TLS) signature. N as in (D). (G) Gene expression of an immune checkpoint signature. N as in (D). (H) Gene set enrichment score of the HALLMARK Oxidative Phosphorylation gene set. N as in (D). (I) Gene set enrichment score of the HALLMARK Glycolysis gene set. N as in (D). (J) Gene set enrichment score of HALLMARK mTOR signaling gene set. N as in (D). (K) Gene set enrichment score of HALLMARK MYC targets gene set. N as in (D). (A, B), (DK) Boxplots display a minimum (Q0), a maximum (Q4), a median (Q2) and the interquartile range. Statistics with two-sided Wilcoxon-signed-rank on paired primary tumors and metastasis, the number of patients in each analysis are listed between brackets behind the p-value. Red squares indicate patients with clinical benefit, black dots patients with no clinical benefit. Metastatic lesions correspond with baseline samples presented in Fig. 2, Fig. 4, Extended Data Figs. 2, 4 and 6.
Extended Data Fig. 4
Extended Data Fig. 4. Unbiased analysis of treatment-related changes in gene expression.
(A) Heatmap of CIBERSORTx immune cell deconvolution across all primary tumor samples (FFPE). Rows correspond to one sample and are annotated with patient ID. N = 10 samples. (B) Heatmap of CIBERSORTx immune cell deconvolution across all baseline metastases (FF). Rows correspond to one sample and are annotated with patient ID. N = 17 samples. (C) Heatmap of gene-set enrichment analysis of Hallmark gene sets across all across all primary tumor samples (FFPE). Rows correspond to one sample and are annotated with patient ID. N as in (A). (D) Heatmap of gene-set enrichment analysis of Hallmark gene sets across all across all baseline metastases (FF). Rows correspond to one sample and are annotated with patient ID. N as in (B).
Extended Data Fig. 5
Extended Data Fig. 5. Flow cytometry-based assessment of circulating immune cell populations in paired blood samples at baseline, on carboplatin and during carboplatin/anti-PD-L1.
(A) Absolute circulating neutrophil counts by flow cytometry. N = 61 samples. (B) Neutrophil-to-lymphocyte ratio (total T cell count). N as in (A). (C) Absolute circulating total T-cell counts. N = 62 samples. (D) Absolute circulating CD8+ T-cell counts. N as in (C). (E) Absolute circulating CD4+ T-cell counts. N as in (C). (F) Percentage of circulating PD-1+CTLA-4+ CD4+ T cells. N as in (C). (G) Percentage of circulating PD-1+CTLA-4+ CD8+ T cells. N as in (C). (AG). Boxplots display a minimum (Q0), a maximum (Q4), a median (Q2) and the interquartile range. Statistics with two-sided Wilcoxon-signed-rank on paired samples, the number of patients in each analysis are listed between brackets behind the p-value. Red squares indicate patients with clinical benefit, black dots patients with no clinical benefit.
Extended Data Fig. 6
Extended Data Fig. 6. Changes in sTILs, stromal CD8+ cells and immune-related gene sets in serial biopsies of a metastatic lesion.
(A) Percentage of CD8+ T cells (immunohistochemistry) in the stromal area in serial biopsies of metastatic lesions measured at baseline, after two cycles of carboplatin and after two cycles of anti-PD-L1 plus carboplatin. N = 58 samples. (B) Percentage of stromal tumor-infiltrating lymphocytes (sTILs) in serial biopsies of metastatic lesions. N = 59 samples. (C) Gene set expression score of resting mast cells according to CIBERSORTx in serial biopsies of metastatic lesions. N = 46 samples. (D) Gene expression of an immunogenic cell death signature in serial biopsies of metastatic lesions. N as in (C). (E) Gene expression score of MHC class II related genes (HLA-DRA, HLA-DRB1, HLA-DOB, HLA-DPB2, HLA-DMA, HLA-DOA, HLA-DPA1, HLA-DPB1, HLA-DMB, HLA-DQB1, HLA-DQA1, HLA-DRB5, HLA-DQA2, HLA-DQB2, HLA-DRB6). N as in (C). (AE) Boxplots display a minimum (Q0), a maximum (Q4), a median (Q2) and the interquartile range. Statistics with two-sided Wilcoxon-signed-rank on paired samples, the number of patients in each analysis are listed between brackets behind the p-value. Red squares indicate patients with clinical benefit, black dots patients with no clinical benefit. Baseline metastatic lesions correspond to metastases presented in Fig. 3 and Extended Data Figs. 3 and 4.
Extended Data Fig. 7
Extended Data Fig. 7. Exploratory analysis of the use 89Zr-atezolizumab-PET to evaluate PD-L1 distribution in ILC patients.
Representative images of one patient imaged with FDG-PET and 89Zr-atezolizumab-PET. Left panel represents lateral view of baseline FDG-PET, the middle panel represents the lateral view of baseline 89Zr-atezolizumab-PET and the right panel 89Zr-atezolizumab-PET after two cycles of carboplatin.
Extended Data Fig. 8
Extended Data Fig. 8. Gating strategies for flow cytometry analysis of peripheral blood immune populations.
(A) T cell panel gating strategy identifying vδ1 γδ T cells (CD3+, vδ1+, pan γδ TCR+), vδ2 γδ T cells (CD3+, vδ2+), double positive T cells (CD3+, vδ1-, pan γδ TCR-, vδ2-, CD8+, CD4+), CD8 T cells (CD3+, vδ1-, pan γδ TCR-, vδ2-, CD8+, CD4-), conventional CD4 T cells (CD3+, vδ1-, pan γδ TCR-, vδ2-, CD8-, CD4+, FoxP3-) and Tregs (CD3+, vδ1-, pan γδ TCR-, vδ2-, CD8-, CD4+, FoxP3+, CD25high). (B) Gating strategy to identify B cell subsets identifying double negative B cells (CD19+, CD27-, IgD-), naïve B cells (CD19+, CD27-, IgD+), non-switched memory B cells (CD19+, CD27+, IgD+), IgM-only memory B cells (CD19+, CD27+, IgD-, IgM+), switched memory B cells (CD19+, CD27+, IgD-, IgM-, CD38-/+), and plasmacells/blasts (CD19+, CD27+, IgD-, IgM-, CD38high). (C) Myeloid panel gating strategy identifying eosinophils (lineage-, high side scatter, CD66b+ CD16−), neutrophils (lineage-, high side scatter, CD66b+ CD16+), basophils (lineage-, FcεRIα+, HLA-DR-), plasmacytoid DCs (lineage-, HLA-DR+, CD303+, CD123+), CD141high DCs (lineage-, HLA-DR+, CD33+, CD141+), CD14+ monocytes (lineage-, HLA-DR+, CD33+, CD14+, CD16-/+), CD14dim monocytes (lineage-, HLA-DR+, CD33+, CD14dim, CD16+), CD1c+ DCs (lineage-, HLA-DR+, CD33+, CD14-, CD16-, CD1c+, FcεRIα+) and CD1c- DCs (lineage-, HLA-DR+, CD33+, CD14-, CD16-, CD1c-, FcεRIα-).

Similar articles

Cited by

References

    1. Dalenc F, et al. Impact of lobular versus ductal histology on overall survival in metastatic breast cancer: a French retrospective multicentre cohort study. Eur. J. Cancer. 2022;164:70–79. doi: 10.1016/j.ejca.2021.12.031. - DOI - PubMed
    1. Pestalozzi BC, et al. Distinct clinical and prognostic features of infiltrating lobular carcinoma of the breast: combined results of 15 International Breast Cancer Study Group clinical trials. J. Clin. Oncol. 2008;26:3006–3014. doi: 10.1200/JCO.2007.14.9336. - DOI - PubMed
    1. Sledge GW, Chagpar A, Perou C. Collective wisdom: lobular carcinoma of the breast. Am. Soc. Clin. Oncol. Educ. Book. 2016;35:18–21. doi: 10.1200/EDBK_100002. - DOI - PubMed
    1. WHO Classification of Tumours Editorial Board. WHO Classification of Breast Tumours 5th edn, Vol. 2 (World Health Organization, 2019).
    1. Ciriello G, et al. Comprehensive molecular portraits of invasive lobular breast cancer. Cell. 2015;163:506–519. doi: 10.1016/j.cell.2015.09.033. - DOI - PMC - PubMed

Publication types

MeSH terms

Associated data