. 2023 Jun;10(16):e2207454.
doi: 10.1002/advs.202207454. Epub 2023 Apr 10.

An Integrative Multiomics Framework for Identification of Therapeutic Targets in Pulmonary Fibrosis

Affiliations

An Integrative Multiomics Framework for Identification of Therapeutic Targets in Pulmonary Fibrosis

Muhammad Arif et al. Adv Sci (Weinh). 2023 Jun.

Abstract

Pulmonary fibrosis (PF) is a heterogeneous disease with a poor prognosis. Therefore, identifying additional therapeutic modalities is required to improve outcome. However, the lack of biomarkers of disease progression hampers the preclinical to clinical translational process. Here, this work assesses and identifies progressive alterations in pulmonary function, transcriptomics, and metabolomics in the mouse lung at 7, 14, 21, and 28 days after a single dose of oropharyngeal bleomycin. By integrating multi-omics data, this work identifies two central gene subnetworks associated with multiple critical pathological changes in transcriptomics and metabolomics as well as pulmonary function. This work presents a multi-omics-based framework to establish a translational link between the bleomycin-induced PF model in mice and human idiopathic pulmonary fibrosis to identify druggable targets and test therapeutic candidates. This work also indicates peripheral cannabinoid receptor 1 (CB1 R) antagonism as a rational therapeutic target for clinical translation in PF. Mouse Lung Fibrosis Atlas can be accessed freely at https://niaaa.nih.gov/mouselungfibrosisatlas.

Keywords: CB1R; IPF; Irf5; bleomycin; metabolomics; mouse model; multi-omics; network biology; pulmonary fibrosis; systems biology; systems pharmacology; transcriptomics.


Conflict of interest statement

The authors declare no conflict of interest.

Figures
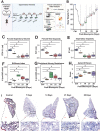
Figure 1
Figure 1
Study design and model validations. A) Experimental design. B) Body weight change of the mouse after a single dose of oropharyngeal bleomycin (1 U kg−1) administration (n = 5 per group). C–G) Pulmonary Function Test (PFT) parameters forced expiratory volume 0.1 s (FEV0.1), forced vital capacity (FVC), and inspiratory capacity (IC), stiffness index and peripheral airway resistance in all measured time points after the administration of bleomycin when compared to control (n = 5 per group; one‐way ANOVA; *: p‐value < 0.05). H) Ashcroft Score in all measured time points after the administration of bleomycin when compared to control. I) Masson's Trichrome staining of the mouse lung in day 0 (control), and 7‐, 14‐, 21‐, and 28‐days after the bleomycin administration.
Figure 2
Figure 2
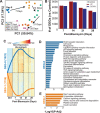
Transcriptomics data analysis. A) Principal Component Analysis (PCA) showed each time point from mice at day 0 (control), and 7‐, 14‐, 21‐, and 28‐days after the bleomycin administration (n = 5 per group). B) The number of differentially expressed genes (DEGs, FDR < 0.05) showed significant transcriptional differences between control and post‐bleomycin mice. C) The trend of normalized expressions of genes that were differentially expressed in all four time points compared to control showed that, even for the commonly dysregulated genes, the magnitudes of up‐ and down‐regulation (DEG‐0 and DEG‐1, respectively) were peaking in 14 days post‐bleomycin compared to control. D,E) Significantly associated pathways (FDR < 0.05) with genes in DEG‐0 and DEG‐1 of the commonly dysregulated genes in all time points.
Figure 3
Figure 3
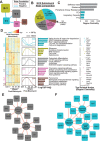
Gene Co‐Expression Network (GCN) analysis. A) Five subnetworks with distinct network architectures were detected in the GCN with node size proportional to their average local transitivity in the network (numbers in the bracket denoted the total number of genes and PFTs in each subnetwork). B) The node composition of GCN subnetworks. C) Centrality analysis of PFTs. Stiffness index, elastance, and peripheral airway resistance were the most central PFTs connected to more than 1000 genes in the GCN, while other PFTs (FEV, inspiratory capacity, and FVC) were connected to less than 400 genes. D) The detailed view of each subnetwork, including the normalized gene expression trends in each sample, the median trajectory of the gene and PFTs in control and four post‐bleomycin time points, associated KEGG pathways to the subnetworks, and the genes with the highest degree related to the KEGG pathways. E) The top 10 highest correlated GCN nodes to stiffness index and peripheral airway resistance. F) Forced vital capacity, forced expiratory volume, and inspiratory capacity.
Figure 4
Figure 4
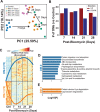
Metabolomics data analysis. A) Principal Component Analysis (PCA) showed each time point from mice at day 0 (control), and 7‐, 14‐, 21‐, and 28‐days after the bleomycin administration (n = 5 per group). B) The number of differential metabolites (DMs, FDR < 0.05) showed significant metabolic differences between control and post‐bleomycin mice. C) The trend of normalized relative peak area of metabolites that were significantly different in at least two time points compared to control showed that most up‐regulated metabolites (DM‐0) were peaking on 21 days and down‐regulated metabolites (DM‐1) on 7 days post bleomycin. D,E) Significantly associated pathways (p‐value < 0.05) with metabolites in DM‐0 and DM‐1 of the commonly dysregulated genes in at least two time points.
Figure 5
Figure 5
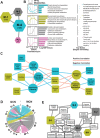
Metabolite Correlation Network (MCN) analysis. A) Four subnetworks with distinct network architectures were detected in the MCN with node size proportional to their average local transitivity in the network (numbers in the bracket denoted the total number of metabolites and PFTs in each subnetwork). B) The detailed view of each subnetwork, including the median trajectory of the metabolites and PFTs in control and four post‐bleomycin time points, associated metabolic pathways, and top metabolite nodes, based on the degree centrality, of each subnetwork. C) The top 10 highest correlated MCN nodes to pulmonary functions. D) GCN and MCN clusters were integrated based on their metabolic subsystems based on mouse metabolic models retrieved from https://metabolicatlas.org. E) Metabolic subsystems connecting two main GCN clusters (G‐1 and G‐2) to the MCN clusters.
Figure 6
Figure 6
Translational link in fibrotic lung transcriptome between human IPF patients and bleomycin‐induced PF in mice A) 2,939 genes (≈45%) from two main GCN clusters (G‐1 and G‐2) were significantly differentially expressed in late‐stage human IPF patients based on an independent cohort (GSE92592) B) Validation with two independent human IPF cohorts (55 Subjects) showed high transcriptional profile similarities (1051 validated genes) between human IPF patients and 14 days post‐bleomycin mice. C,D) Significant KEGG pathways (FDR < 0.05) associated with the up‐ and down‐regulated genes validated in 2 independent human cohorts. E) The composition of GCN subnetworks in the validated DEGs in two late‐stage human IPF patients’ cohorts (6B). More than 45% of the genes belong to the two main GCN clusters (G‐1 and G‐2).
Figure 7
Figure 7
Identifying common transcriptional regulators of critical fibroproliferative pathways. A) Predicted transcriptional regulation models from the iDREM analysis showed 13 gene tracks with distinct trajectories. Each dot annotated the junction where transcription factors and their regulated gene expressions diverge. B) The association of GCN subnetworks to the identified gene tracks. C) Top five enriched KEGG Pathways for each gene track. D) 55 validated T‐1 and T‐2 target genes in fibrotic lungs transcriptome shared in both human IPF patients’ cohorts and bleomycin‐challenged mice. E) The transcription factors that regulated the progression of genes in tracks T‐1 and T‐2 at each time point. T‐1 and T‐2 were associated with important functions related to pulmonary fibrosis, inflammation, and associated specifically with the two most central GCN subnetworks (G‐1 and G‐2).
Figure 8
Figure 8
Identifying cannabinoid receptor 1 (CB1R) antagonism as a rational therapeutic target in pulmonary fibrosis. A–E) Deletion of CB1R prevented bleomycin‐induced decline in pulmonary function parameters (stiffness index, peripheral airway resistance, inspiratory capacity [IC], forced expiratory volume 0.1 s [FEV0.1], and forced vital capacity [FVC]; n = 4 for Ctrl and CB1R KO, and n = 5 for WT; one‐way ANOVA; *: p‐value < 0.05). F) Hydroxyproline level decreased significantly in CB1R KO mice compared to wild‐type after the administration of bleomycin (n = 4 for Ctrl and CB1R KO, and n = 5 for WT; one‐way ANOVA; *: p‐value < 0.05). G) Gene expression of Irf5, Irf7, Traf4, and Nfil3, transcriptional regulators of T‐1 and T‐2 gene tracks (n = 6 for Ctrl and CB1R KO, and n = 4 for WT; one‐way ANOVA; *: p‐value < 0.05). H) PF‐induced 31 validated T‐1 and T‐2 target genes in both human and mice were significantly attenuated with the deletion of CB1R compared to wild‐type mice at 14 days post bleomycin. (p‐value < 0.05) I) The majority of important pulmonary fibrosis‐related KEGG pathways, such as ECM‐receptor interaction, PI3K‐Akt signaling, focal adhesion, amino‐acid metabolism, and immune and inflammatory pathways, were significantly attenuated with the deletion of CB1R compared to wild‐type mice at 14 days post bleomycin. J) The deletion of CB1R in the lung reversed the dysregulation of genes 14 days post‐bleomycin in the three biggest GCN subnetworks: G‐0 (up‐regulated), G‐1 (down), and G‐2 (down), while G‐3 and G‐4 remained unchanged, compared to wild‐type mouse 14 days post‐bleomycin.

References

    1. Glass D. S., Grossfeld D., Renna H. A., Agarwala P., Spiegler P., Deleon J., Reiss A. B., Clin. Respir. J. 2022, 16, 84. - PMC - PubMed
    1. Kolb M., Bonella F., Wollin L., Respir. Med. 2017, 131, 49. - PubMed
    1. Raghu G., Eur. Respir. J. 2017, 50, 1701209. - PubMed
    1. Macagno F., Varone F., Leone P. M., Mari P. ‐. V., Panico L., Berardini L., Richeldi L., Expert Rev. Respir. Med. 2017, 11, 533. - PubMed
    1. Jenkins R. G., Moore B. B., Chambers R. C., Eickelberg O., Königshoff M., Kolb M., Laurent G. J., Nanthakumar C. B., Olman M. A., Pardo A., Selman M., Sheppard D., Sime P. J., Tager A. M., Tatler A. L., Thannickal V. J., White E. S., Am. J. Respir. Cell Mol. Biol. 2017, 56, 667. - PMC - PubMed

Publication types