. 2023 Apr 10;21(1):123.
doi: 10.1186/s12951-023-01874-7.

Biomimetic liposomal nanozymes improve breast cancer chemotherapy with enhanced penetration and alleviated hypoxia

Affiliations

Biomimetic liposomal nanozymes improve breast cancer chemotherapy with enhanced penetration and alleviated hypoxia

Juanjuan Li et al. J Nanobiotechnology. .

Abstract

Background: Doxorubicin (Dox) has been recommended in clinical guidelines for the standard-of-care treatment of breast cancer. However, Dox therapy faces challenges such as hypoxia, acidosis, H2O2-rich conditions and condensed extracellular matrix in TME as well as low targeted ability.

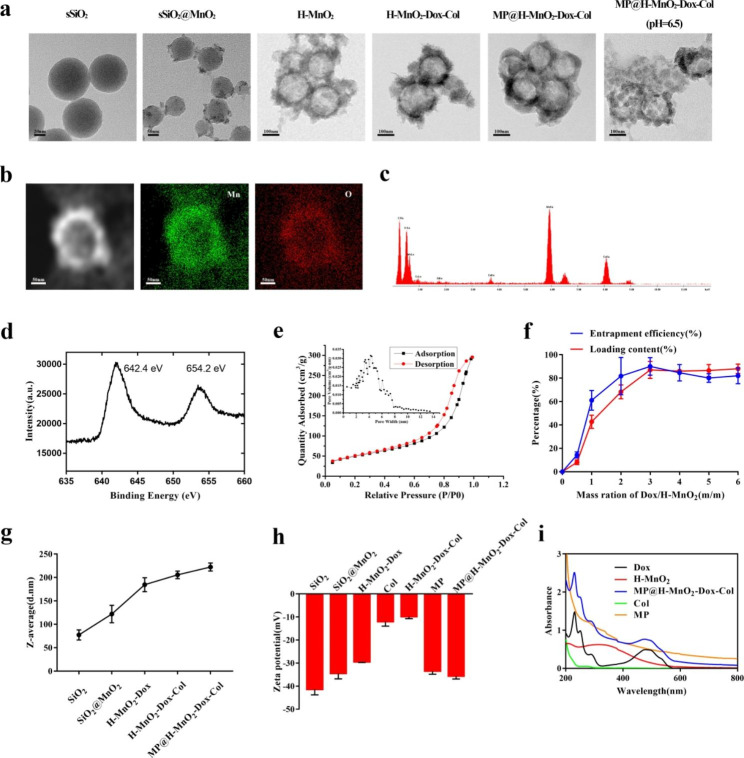
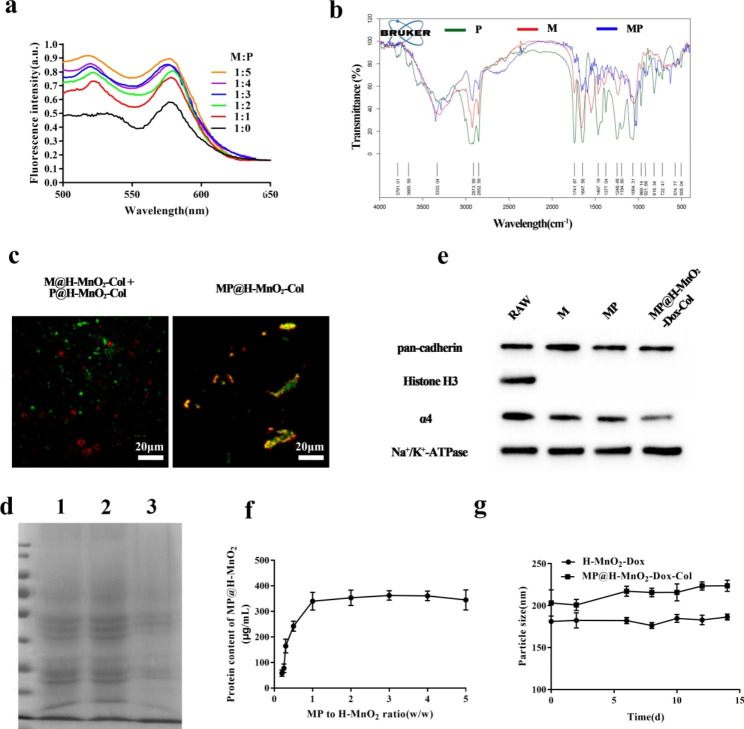
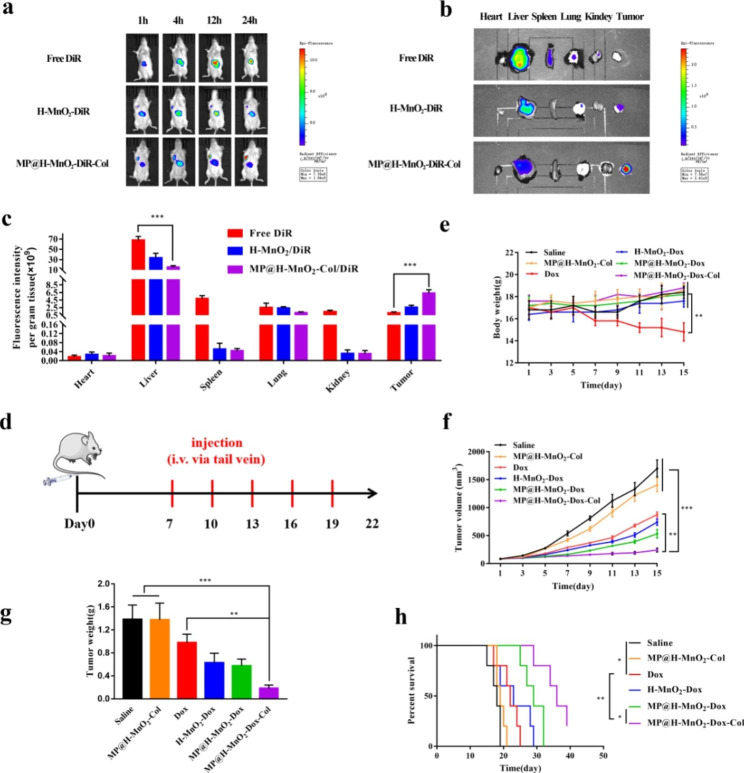
Methods: We developed a nanosystem H-MnO2-Dox-Col NPs based on mesoporous manganese dioxide (H-MnO2) in which Dox was loaded in the core and collagenase (Col) was wrapped in the surface. Further the H-MnO2-Dox-Col NPs were covered by a fusion membrane (MP) of inflammation-targeted RAW264.7 cell membrane and pH-sensitive liposomes to form biomimetic MP@H-MnO2-Dox-Col for in vitro and in vivo study.

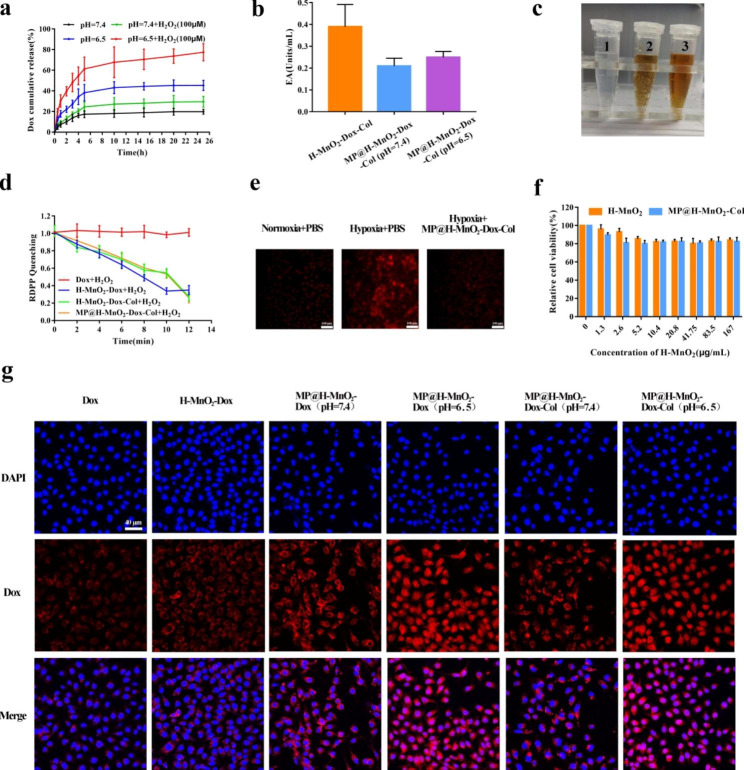
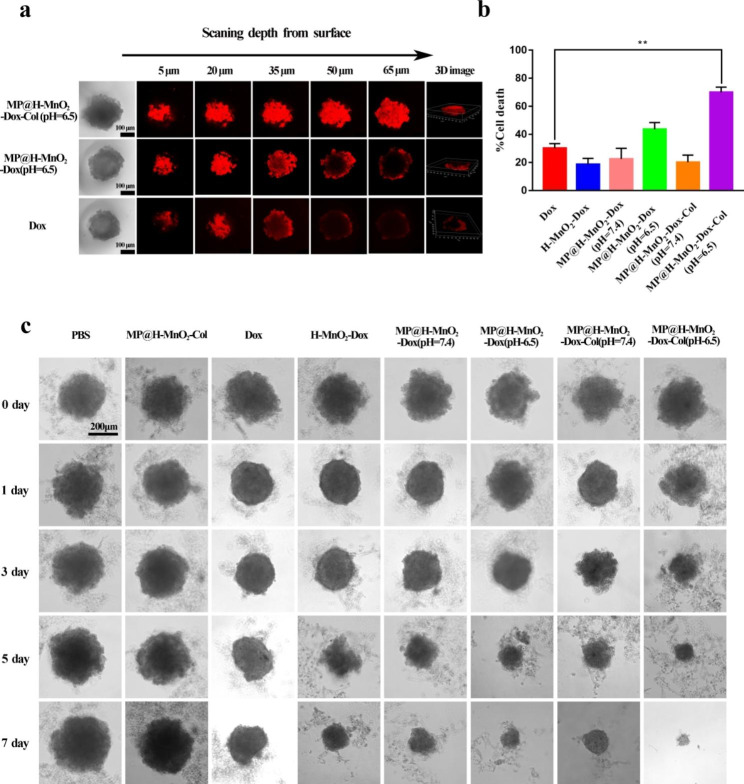
Results: Our results shows that MP@H-MnO2-Dox-Col can increase the Dox effect with low cardiotoxicity based on multi-functions of effective penetration in tumor tissue, alleviating hypoxia in TME, pH sensitive drug release as well as targeted delivery of Dox.

Conclusions: This multifunctional biomimetic nanodelivery system exhibited antitumor efficacy in vivo and in vitro, thus having potential for the treatment of breast cancer.

Keywords: Biomimetic nanoparticles; Breast cancer; Chemotherapy; Hypoxia; Penetration.


Conflict of interest statement

There is no conflict of interest to declare.

Figures

Scheme 1
Scheme 1
Schematic illustration of the mechanism of MP@H-MnO2-Dox-Col NPs with enhanced in vivo chemotherapy
Fig. 1
Fig. 1
Synthesis and characterization of MP@H-MnO2-Dox-Col nanoparticles (NPs). (a) Transmission electron microscopy images (TEM) of the NPs at each step of preparation and MP@H-MnO2-Dox-Col NPs after treatment in pH 6.5 buffers for 2 h. (b) High-angle annular dark-field scanning TEM (HAADF-STEM) images and elemental mapping for H-MnO2. (c) Energy dispersive X-ray spectroscopy data of H-MnO2. (d) X-ray photoelectron spectroscopy spectrum of H-MnO2. (e) Pore-size distribution curve (inset) and N2 adsorption/desorption isotherms of the H-MnO2 sample. (f) Dox loading rate and encapsulation rate in H-MnO2 at different feeding Dox: H-MnO2 ratios. Data are presented as the mean ± standard deviation (SD) (n = 3). (g) Particle size and (h) the surface charge potential of different NPs during the preparation process. (i) UV/VIS/NIR spectrum of the aqueous dispersion of different NPs
Fig. 2
Fig. 2
Characterization of hybrid membrane MP. (a) The RAW264.7 cell membranes labeled with DOPE-RhB/C6-NBD were fused with increasing amounts of liposomes, and their fluorescence spectra were recorded. M:P indicates the weight ratio of RAW264.7 cell membrane proteins to liposomes. (b) The Fourier transform infrared (FTIR) spectra of M, P, and MP confirmed the retention of RAW264.7 cell membrane proteins in MP. (c) Representative laser-scanning microscopy images of the M@H-MnO2-Col NPs and P@H-MnO2-Col NPs mixture and fused MP@H-MnO2-Col NPs (scale bars = 40 μm). (d) Profiles of proteins in M (1), MP (2), and MP@H-MnO2-Dox-Col NPs (3) determined via SDS-PAGE. (e) Western blot analysis of RAW264.7 cells, M, MP, and MP@H-MnO2-Dox-Col NPs for characteristic RAW264.7 membrane marker α4 (Na+-K+-ATPase was used as a reference protein). (f) Optimization of MP-to-H-MnO2 weight ratios (w/w) via BCA analysis. (g) Z-average size of H-MnO2-Dox NPs and MP@H-MnO2-Dox-Col NPs over 15 days in water
Fig. 3
Fig. 3
Characterization of functional properties in vitro. (a) Dox release profiles from MP@H-MnO2-Dox-Col NPs with or without 100 µM H2O2 at different pH values. Data are presented as the mean ± SD (n = 3). (b) Relative viabilities of 4T1 cells after incubation with various concentrations of H-MnO2 in the dark for 24 h. Data are presented as the mean ± SD (n = 6). (c) Quantification of the enzyme activity (EA) of collagenase-modified NPs (n = 3). (d) Digital images of MP@H-MnO2-Dox-Col NPs with or without H2O2 to measure O2 generation: (1) only H2O2; (2) H2O2; (3) without H2O2; (e) The generation of oxygen as determined based on quenched RDPP fluorescence; (f) Fluorescence images of MP@H-MnO2-Dox-Col NPs induced hypoxia attenuation; (g) CLSM images of intracellular distribution of Dox in each group (scale bars = 40 μm)
Fig. 4
Fig. 4
In vitro efficacy of NPs in the 3D tumor spheroid model. (a) CLSM images showing in vitro penetration of MP@H-MnO2-Dox-Col NPs (pH = 6.5), MP@H-MnO2-Dox NPs (pH = 6.5) and free Dox in 3D-cultured 4T1 multicellular spheroids. (b) Spheroid cytotoxicity under treatment with the different NPs formulations for 72 h was evaluated via LDH assays. (c) Representative images of 4T1 3D tumor spheroids incubated with different NPs treatment on different days
Fig. 5
Fig. 5
Biodistribution and antitumor effect in vivo. (a) Digital photo of breast cancer model. (b) In vitro biodistribution in 4T1 tumor-bearing mice after intravenous injection of free DiR, H-MnO2-DiR, and MP@H-MnO2-Col-DiR was observed over various time intervals. (c) Ex vivo fluorescence images of tumor and organs collected from each group were taken at 24 h post-injection. (d) Fluorescence quantitative analysis of DiR distribution in the ex vivo tumor and organ. (e) In vivo administration protocol for different NPs treatment. (f) Mean body weights of mice from each treatment group. (g) Tumor growth curves of mice after treatments. (h) Weights of tumors excised after 15 days of treatment. (i) Survival of mice from different treatment groups. (p-values were calculated via the Student’s t test: *p < 0.05, **p < 0.01, ***p < 0.001, n = 5)
Fig. 6
Fig. 6
In vivo antitumor efficacy and safety evaluation. (a) Immunofluorescence images of TUNEL-stained tumor slices. (b) Ki67 staining of tumor tissues. (c) H&E staining of the tumor, heart, liver, spleen, lung, and kidney
Fig. 7
Fig. 7
Study on promoting penetration and alleviating hypoxia of NPs. (a) Scan images of tumor tissue, Dox (red). (b) Blood vessels are indicated by CD31 staining (green). (c) Masson’s trichrome analysis of tumors, showing collagen fibers (blue), muscle fibers, cellulose, and red blood cells (red). (d) Representative immunofluorescence images of collagen I (green). (e) Immunofluorescence images of hypoxic areas within tumors. The nuclei and hypoxic areas were stained with DAPI (blue) and an anti-pimonidazole antibody (green), respectively

References

    1. Siegel RL, Miller KDM, Wagle NS, Jemal A. Cancer statistics, 2023. CA Cancer J Clin. 2023;73(1):17–48. doi: 10.3322/caac.21763. - DOI - PubMed
    1. Milani M, Harris AL. Targeting tumour hypoxia in breast cancer. Eur J Cancer. 2008;4:2766–73. doi: 10.1016/j.ejca.2008.09.025. - DOI - PubMed
    1. Tang M, Bolderson E, O’Byrne KJ, Richard DJ. Tumor hypoxia drives genomic instability. Front Cell Dev Biol. 2021;9:626229. doi: 10.3389/fcell.2021.626229. - DOI - PMC - PubMed
    1. Zhu XH, Du JX, Zhu D, Ren SZ, Chen K, Zhu HL. Recent research on methods to improve tumor hypoxia environment. Oxid Med Cell Longev. 2020; 2020: 5721258. - PMC - PubMed
    1. Qian C, Yu J, Chen Y, Hu Q, Xiao X, Sun W, Wang C. FengP., SheQ., GuZ., Light-activated hypoxia-responsive nanocarriers for enhanced anticancer therapy. Adv Mater. 2016; 28: 3313–3320. - PMC - PubMed