. 2023 Apr 10;20(1):93.
doi: 10.1186/s12974-023-02770-5.

The cervical lymph node contributes to peripheral inflammation related to Parkinson's disease

Affiliations

The cervical lymph node contributes to peripheral inflammation related to Parkinson's disease

Zongran Liu et al. J Neuroinflammation. .

Abstract

Background: Peripheral inflammation is an important feature of Parkinson's disease (PD). However, if and how CNS pathology is involved in the peripheral inflammation in PD remains to be fully investigated. Recently, the existence of meningeal lymphatics and its involvement in draining cerebral spinal fluid (CSF) to the cervical lymph node has been discovered. It is known that meningeal lymphatic dysfunction exists in idiopathic PD. The deep cervical lymph node (dCLN) substantially contributes to the drainage of the meningeal lymphatics. In addition, one of the lymphatics draining components, CSF, contains abundant α-synuclein (α-syn), a protein critically involved in PD pathogenesis and neuroinflammation. Thus, we began with exploring the possible structural and functional alterations of the dCLN in a PD mouse model (A53T mice) and investigated the role of pathological α-syn in peripheral inflammation and its potential underlying molecular mechanisms.

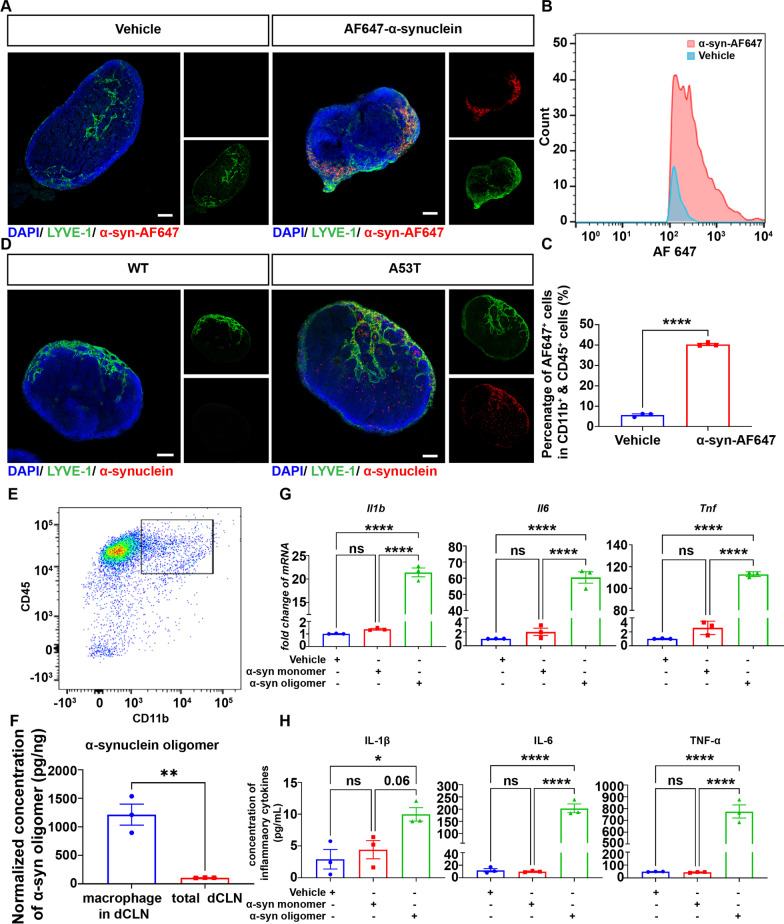
Methods: In this study, the transgenic mice (prnp-SNCA*A53T) which specifically overexpressed A53T mutant α-syn in CNS were employed as the PD animal model. Immunofluorescent and Hematoxylin and eosin staining were used to evaluate structure of dCLN. Inflammation in dCLNs as well as in bone-marrow-derived macrophages (BMDMs) was assessed quantitatively by measuring the mRNA and protein levels of typical inflammatory cytokines (including IL-1β, IL-6 and TNF-α). Intra-cisterna magna injection, flow cytometric sorting and electrochemiluminescence immunoassays were applied to investigate the lymphatic drainage of α-syn from the CNS. RNA-seq and Western blot were used to explore how pathological α-syn mediated the inflammation in PD mice.

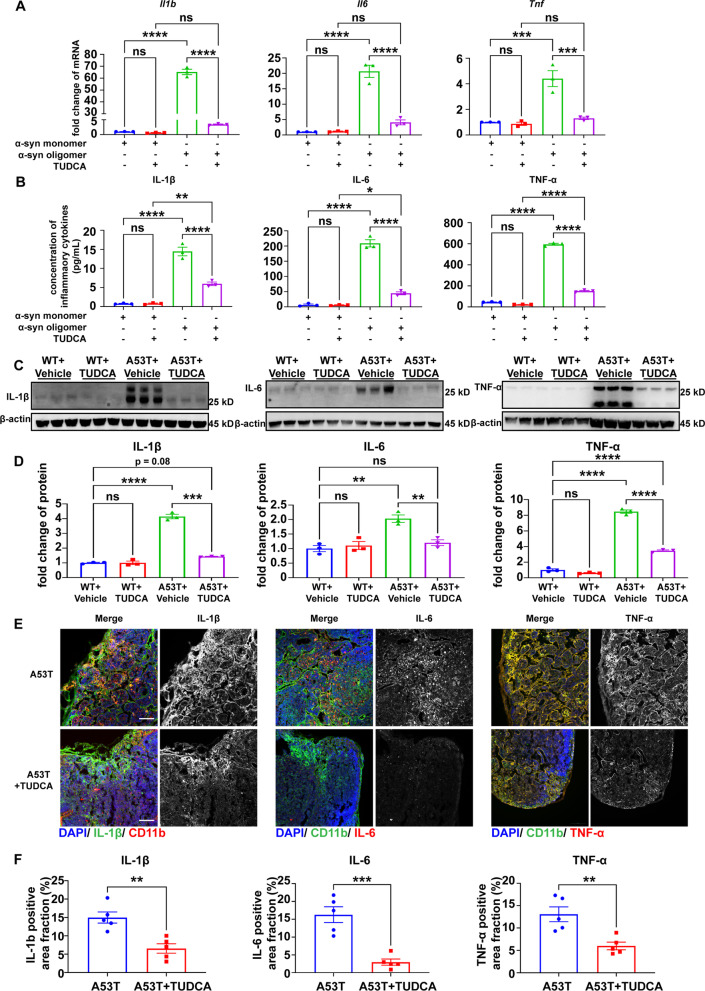
Results: The results unequivocally revealed substantially enlarged dCLNs, along with slow lymphatic flow, and increased inflammation in the dCLNs of A53T mice. Oligomeric α-syn drained from CSF potently activated macrophages in the dCLN via endoplasmic reticulum (ER) stress. Notably, inhibition of ER stress effectively suppressed peripheral inflammation in PD mice.

Conclusions: Our findings indicate that lymph node enlargement is closely related to macrophage activation, induced by meningeal lymphatics draining oligomeric α-syn, and contributes to the peripheral inflammation in PD. In addition, ER stress is a potential therapeutic target to ameliorate PD pathogenesis.

Keywords: Cervical lymph node; Endoplasmic reticulum stress; Inflammation; Macrophage; Parkinson’s disease; α-Synuclein.


Conflict of interest statement

The authors declare that they have no competing interests.

Figures

Fig. 1
Fig. 1
Tissue structural and fluid dynamics alteration in dCLNs of A53T mice. A Histology of representative dCLNs of WT and A53T mice. Scale bar, 200 μm. B Quantitative analysis of the cross-sectional area of dCLNs of WT and A53T mice. N = 5 independent animals in each group. C Representative fluorescence images of dCLNs of WT and A53T mice immunolabeled with LYVE-1 (red) and CD169 (green). Scale bar, 200 μm. D Quantitative analysis of the LYVE-1 positive area in dCLNs of WT and A53T mice. N = 4 independent animals in WT and N = 6 independent animals in A53T. E Representative fluorescence images of dCLNs of WT and A53T mice immunolabeled with PDPN. Yellow dotted box indicates reticular meshwork, and purple dotted box indicates medullary cord. Scale bar, 200 μm. F Quantitative analysis of the total surface area of PDPN positive reticular meshwork in dCLNs of WT and A53T mice. N = 5 independent animals in WT and N = 4 independent animals in A53T. G Quantitative analysis of the area of medullary cord in dCLNs of WT and A53T mice. N = 5 independent animals in WT and N = 4 independent animals in A53T. H Schematic of the experimental setup for the monitoring of lymph flow in dCLNs. I Representative images of dCLNs in WT and A53T mice from pre-infusion to 10 min, 20 min, 60 min post-infusion. White dotted circle indicates the dCLN. J Quantitative analysis of Qdot605 signal intensity over 80 min in dCLNs (relative to 8 min post-infusion). t Test was performed at signals between WT and A53T mice at 80 min. N = 4 independent animals. Values are means ± S.E.M, t test (D, F, G, and J), Mann–Whitney U test (B). *, P < 0.05; **, P < 0.01; ****, P < 0.0001
Fig. 2
Fig. 2
Peripheral inflammation in A53T mice. A Quantitative analysis of mRNA levels of Il1b, Il6 and Tnf in dCLNs of WT and A53T mice using qPCR. N = 3 independent animals in each group. B Western blot to assess the level of IL-1β, IL-6 and TNF-α in dCLNs of WT and A53T mice. C Quantitative analysis of the protein level of IL-1β, IL6 and TNF-α in dCLNs of WT and A53T mice, N = 3 independent in each group (3 samples were pooled from 6 animals). D Representative fluorescence images of dCLNs from WT and A53T mice immunolabeled by CD11b (red or green) with IL-1β (green), IL-6 (red), or TNF-α (red). Scale bar, 100 μm. E Quantitative analysis of IL-1β, IL6 and TNF-α positive area in dCLNs of WT and A53T mice. N = 5 independent animals in WT and A53T. F Quantitative analysis of the levels of IL-1β, IL6 and TNF-α using ELISA, in plasma of WT and A53T mice. N = 4 independent animals in WT group and N = 5 independent animals in A53T group. Values are means ± S.E.M, t test. *, P < 0.05; **, P < 0.01; ***, P < 0.001
Fig. 3
Fig. 3
α-Synuclein in CNS was drained to the macrophage and activated it in the dCLN through meningeal lymphatics. A Representative fluorescence images of dCLNs of C57 mice injected (i.c.m) with vehicle or AF647-α-synuclein (red). Scale bar, 200 μm. B Number of macrophages containing AF647-α-synuclein in dCLNs of C57 mice injected (i.c.m) with vehicle or AF647-α-synuclein was evaluated by flow cytometry. The macrophages were labelled by CD11b-FITC and CD45-PE-Cy7. C Quantitative analysis of the number of macrophages containing AF647-α-synuclein in dCLNs of C57 mice. D Representative fluorescence images of dCLNs in WT and A53T mice. α-Synuclein in dCLN was immunolabelled by MJFR-1 (red). Scale bar, 200 μm. E Macrophages in dCLN were sorted by FACS. The macrophages were labelled by CD11b-FITC and CD45-PE-Cy7. F Quantitative analysis of α-synuclein oligomer in macrophages of dCLNs and total dCLNs using MSD. N = 3 independent experiments in each group. G Quantitative analysis mRNA levels of Il1b, Il6 and Tnf in BMDMs treated with vehicle control, 100 nM α-syn monomer, or 100 nM α-syn oligomer using qPCR. N = 3 independent experiments in each group. H Quantitative analysis of the levels of IL-1β, IL6 and TNF-α using ELISA, released by BMDMs treated with vehicle control, α-syn monomer, or α-syn oligomer. N = 3 independent sample pools in each group. Values are means ± S.E.M, t test (C, F), one-way ANOVA test (G, H). *, P < 0.05; **, P < 0.01; ****, P < 0.0001
Fig. 4
Fig. 4
Endoplasmic reticulum stress was increased in the dCLN of A53T mice. A Functional enrichment of differentially expressed genes in dCLNs of WT and A53T mice. Red represented the number of increased genes and blue represented the number of decreased genes. B Heat map partly showing the relative expression levels of genes involved in response to endoplasmic reticulum stress signaling pathway. Red represents gene expression levels above the mean; blue represents gene expression levels below the mean. N = 3 independent in each group (3 WT samples were pooled from 6 animals; 3 A53T samples were pooled from 4 animals). C Western blot to assess the level of p-IRE1α, IRE1α, GRP78, ATF6, ATF6-p, ATF4, sXBP-1, p-eIF2α, eIF2α and α-synuclein in dCLNs of WT and A53T mice. D–K Quantitative analysis of the level of IRE1α, p-IRE1α, sXBP-1, ATF6, ATF6-p, p-eIF2α, eIF2α and ATF4 in dCLNs of WT and A53T mice, N = 4 independent in WT group (4 WT samples were pooled from 8 animals) and N = 4 independent animals in A53T group. L Quantitative analysis of Ddit3 mRNA levels using qPCR, in dCLNs of WT and A53T mice. N = 3 independent animals in each group. M Quantitative analysis of the level of GRP78 in dCLNs of WT and A53T mice. Values are means ± S.E.M, t test. *, P < 0.05; **, P < 0.01; ***, P < 0.001; ****, P < 0.0001
Fig. 5
Fig. 5
Endoplasmic reticulum stress in dCLNs of A53T mice mainly existed in macrophages. A Representative fluorescence images of GRP78 in macrophages (CD11b positive), B cells (B220 positive) and T cells (CD3e positive) in dCLNs of WT and A53T mice. Scale bar, 200 μm in upper images, 20 μm in lower images. B Quantitative analysis of the intensity of GRP78 in dCLNs of WT and A53T mice. N = 9 images from 3 independent animals in WT group and N = 12 images from 4 independent animals in A53T group. C Quantitative analysis of the intensity of GRP78 in macrophages, B cells and T cells in dCLNs of WT and A53T mice. N = 5 independent animals. Values are means ± S.E.M, t test (B), two-way ANOVA test (C). ns, not significant; ***, P < 0.001; ****, P < 0.0001
Fig. 6
Fig. 6
α-Synuclein aggregate elicited severe ER stress in the macrophage. A Western blot to assess the levels of p-IRE1α, IRE1α, GRP78, ATF6, ATF6-p, ATF4, sXBP-1, p-eIF2α, eIF2α and α-synuclein in BMDMs treated with vehicle control, 100 nM α-synuclein monomer or 100 nM α-synuclein oligomer. BJ Quantitative analysis of the level of ATF6, ATF6-p, GRP78, IRE1α, p-IRE1α, p-eIF2α, eIF2α, sXBP-1, and ATF4 in BMDMs treated with vehicle control, α-synuclein monomer or α-synuclein oligomer. N = 3 independent experiments in each group. K Quantitative analysis of Ddit3 mRNA levels in BMDMs treated with vehicle control, α-synuclein monomer or α-synuclein oligomer using qPCR. N = 3 independent experiments in each group. L Interaction between α-syn and GRP78 was examined by co-IP in RAW 264.7 cells. M Co-localization of α-syn (green) and GRP78 (red) in RAW 264.7 cells after treatment with α-syn. Scale bar, 50 μm. Values are means ± S.E.M, one-way ANOVA test. ns, not significant; *, P < 0.05; **, P < 0.01; ***, P < 0.001; ****, P < 0.0001
Fig. 7
Fig. 7
ER stress was involved in the peripheral inflammation in PD mice. A Quantitative analysis mRNA levels of Il1b, Il6 and Tnf in BMDMs treated with 100 nM α-syn monomer or oligomer and vehicle control or 100 μM TUDCA using qPCR. N = 3 independent experiments in each group. B Quantitative analysis of the levels of IL-1β, IL6 and TNF-α released by BMDMs treated with 100 nM α-syn monomer or oligomer and vehicle control or 100 μM TUDCA using ELISA. N = 3 independent in α-syn oligomer group, N = 6 independent in α-syn oligomer and TUDCA group. C Western blot to assess the level of IL-1β, IL6 and TNF-α in dCLNs of WT or A53T mice treated with vehicle control and TUDCA (100 mg/kg). D Quantitative analysis of the levels of IL-1β, IL6 and TNF-α in dCLNs of WT or A53T mice treated with vehicle control and TUDCA. N = 3 independent in each group (3 WT + Vehicle samples were pooled from 7 animals; 3 WT + TUDCA samples were pooled from 7 animals; 3 A53T + Vehicle samples were pooled from 5 animals; 3 A53T + TUDCA samples were pooled from 6 animals). E Representative fluorescence images of IL-1β, IL6 and TNF-α in dCLNs of A53T mice treated with or without TUDCA. Scale bar, 100 μm. F Quantitative analysis of IL-1β, IL6 and TNF-α positive area in dCLNs of A53T mice treated with or without TUDCA. N = 5 independent animals in each group. Values are means ± S.E.M, one-way ANOVA test (A, B, D), t test (F). *, P < 0.05; **, P < 0.01; ***, P < 0.001; ****, P < 0.0001

Similar articles

Cited by

References

    1. Deng H, Wang P, Jankovic J. The genetics of Parkinson disease. Ageing Res Rev. 2018;42:72–85. doi: 10.1016/j.arr.2017.12.007. - DOI - PubMed
    1. Kalia LV, Lang AE. Parkinson’s disease. Lancet. 2015;386:896–912. doi: 10.1016/S0140-6736(14)61393-3. - DOI - PubMed
    1. Vázquez-Vélez GE, Zoghbi HY. Parkinson’s disease genetics and pathophysiology. Annu Rev Neurosci. 2021;44:87–108. doi: 10.1146/annurev-neuro-100720-034518. - DOI - PubMed
    1. Nalls MA, Pankratz N, Lill CM, Do CB, Hernandez DG, Saad M, DeStefano AL, Kara E, Bras J, Sharma M, et al. Large-scale meta-analysis of genome-wide association data identifies six new risk loci for Parkinson’s disease. Nat Genet. 2014;46:989–993. doi: 10.1038/ng.3043. - DOI - PMC - PubMed
    1. Polymeropoulos MH, Lavedan C, Leroy E, Ide SE, Dehejia A, Dutra A, Pike B, Root H, Rubenstein J, Boyer R, et al. Mutation in the alpha-synuclein gene identified in families with Parkinson’s disease. Science. 1997;276:2045–2047. doi: 10.1126/science.276.5321.2045. - DOI - PubMed

Substances