. 2023 Apr 10;23(1):36.
doi: 10.1186/s40644-023-00553-y.

Magnetic resonance imaging to assess the brain response to fasting in glioblastoma-bearing rats as a model of cancer anorexia

Affiliations

Magnetic resonance imaging to assess the brain response to fasting in glioblastoma-bearing rats as a model of cancer anorexia

Irene Guadilla et al. Cancer Imaging. .

Abstract

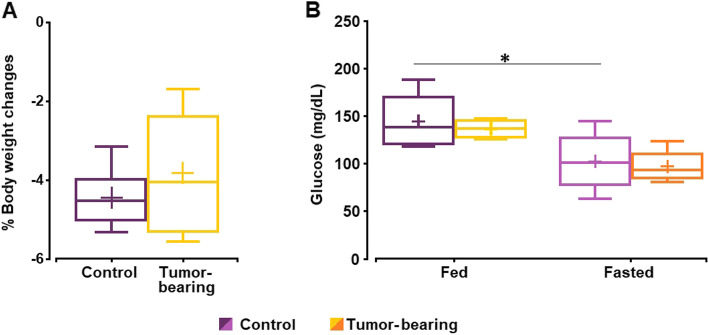
Background: Global energy balance is a vital process tightly regulated by the brain that frequently becomes dysregulated during the development of cancer. Glioblastoma (GBM) is one of the most investigated malignancies, but its appetite-related disorders, like anorexia/cachexia symptoms, remain poorly understood.

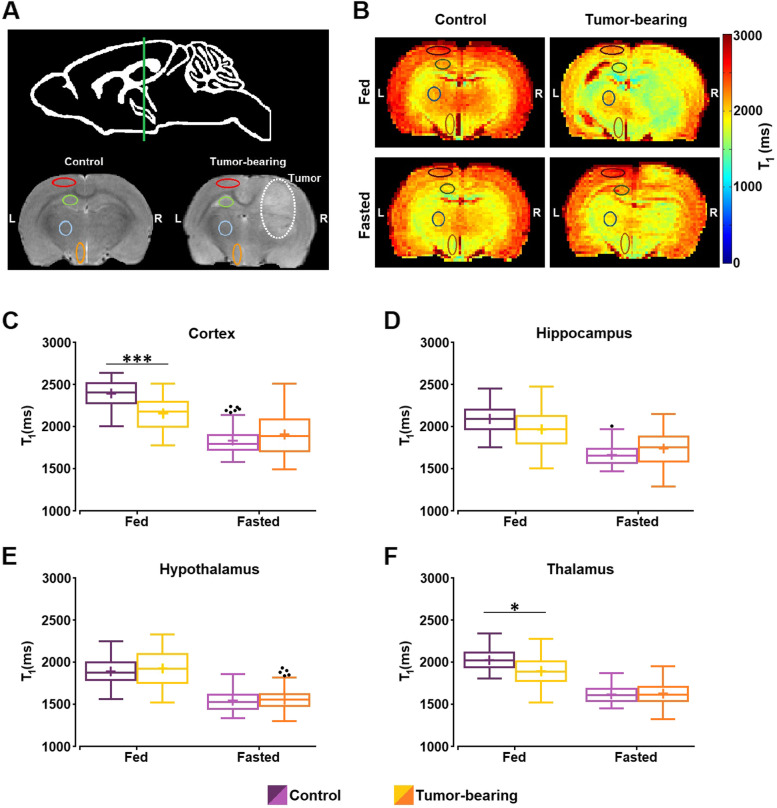
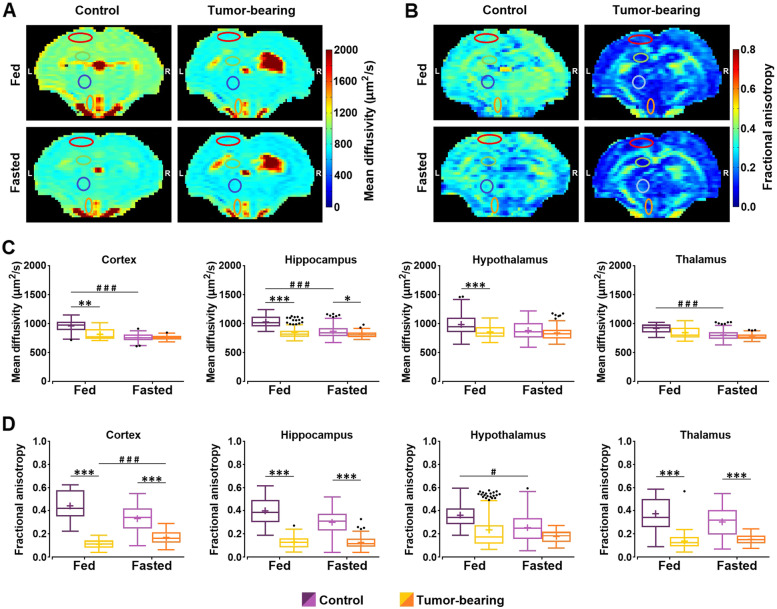
Methods: We performed manganese enhanced magnetic resonance imaging (MEMRI) and subsequent diffusion tensor imaging (DTI), in adult male GBM-bearing (n = 13) or control Wistar rats (n = 12). A generalized linear model approach was used to assess the effects of fasting in different brain regions involved in the regulation of the global energy metabolism: cortex, hippocampus, hypothalamus and thalamus. The regions were selected on the contralateral side in tumor-bearing animals, and on the left hemisphere in control rats. An additional DTI-only experiment was completed in two additional GBM (n = 5) or healthy cohorts (n = 6) to assess the effects of manganese infusion on diffusion measurements.

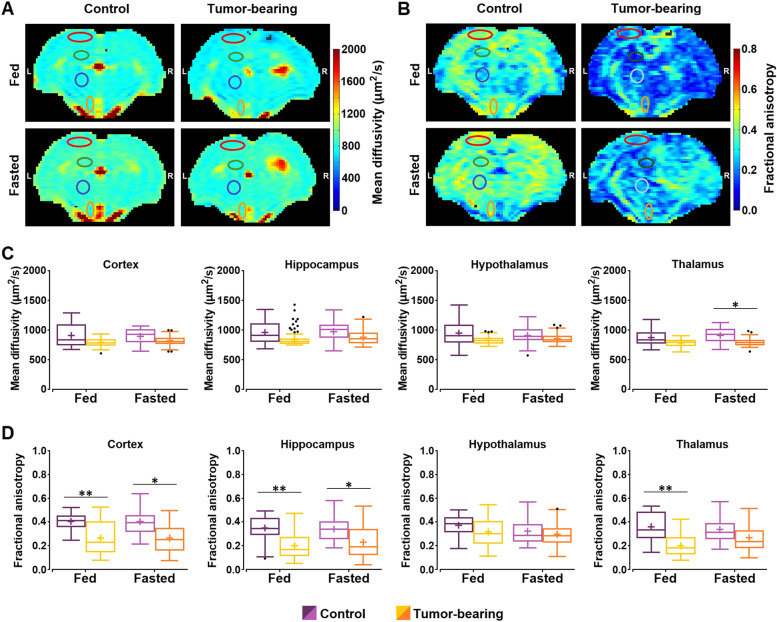
Results: MEMRI results showed lower T1 values in the cortex (p-value < 0.001) and thalamus (p-value < 0.05) of the fed ad libitum GBM animals, as compared to the control cohort, consistent with increased Mn2+ accumulation. No MEMRI-detectable differences were reported between fed or fasting rats, either in control or in the GBM group. In the MnCl2-infused cohorts, DTI studies showed no mean diffusivity (MD) variations from the fed to the fasted state in any animal cohort. However, the DTI-only set of acquisitions yielded remarkably decreased MD values after fasting only in the healthy control rats (p-value < 0.001), and in all regions, but thalamus, of GBM compared to control animals in the fed state (p-value < 0.01). Fractional anisotropy (FA) decreased in tumor-bearing rats due to the infiltrate nature of the tumor, which was detected in both diffusion sets, with (p-value < 0.01) and without Mn2+ administration (p-value < 0.001).

Conclusions: Our results revealed that an altered physiological brain response to fasting occurred in hunger related regions in GBM animals, detectable with DTI, but not with MEMRI acquisitions. Furthermore, the present results showed that Mn2+ induces neurotoxic inflammation, which interferes with diffusion MRI to detect appetite-induced responses through MD changes.

Keywords: Cancer anorexia; Diffusion tensor imaging; Fasting paradigm; Glioblastoma; Manganese enhanced MRI.


Conflict of interest statement

The authors declare that the research was conducted in the absence of any commercial or financial relationships that could be construed as a potential conflict of interest.

Figures

Fig. 1
Fig. 1
Decrease in body weight and blood glucose level in control and GBM rats under fed or fasted conditions. A Body weight changes after 16 h of food deprivation. B Blood glucose levels before the MRI session in fed and fasted conditions. In each box-plot, the central mark indicates the median, the cross mark the mean, and the bottom and top edges refer to the 25-th and 75-th percentiles, respectively. The upper and lower limits of the box extend to the most extreme data points not considered outliers (* p-value < 0.05)
Fig. 2
Fig. 2
MEMRI of control and GBM rats, 24 h after Mn2+ administration, under fed or fasted conditions. A Anatomical location of the slice selected, including the perimeters of the investigated ROIs in the left contralateral hemisphere: cortex (red), hippocampus (green), thalamus (blue) and hypothalamus (orange). B Representative T1 maps of a control and a tumor-bearing animal, 24 h after Mn.2+ administration, under fed and fasted conditions. The ROIs (cortex, hippocampus, hypothalamus and thalamus) are outlined in the maps. C-F Boxplots of T1 values from the different ROIs investigated, in control and GBM rats, under fed and fasted conditions. Box plots are represented as indicated in Fig. 1. Outliers are plotted individually using the '•' symbol. (* p-value < 0.05, *** p-value < 0.001)
Fig. 3
Fig. 3
Mean diffusivity and fractional anisotropy in the brain of control and GBM rats under fed or fasted conditions 24 h after Mn2+ administration. A, B Representative parametric maps of mean diffusivity (MD) and fractional anisotropy (FA) of a control and a tumor-bearing rat, under fed and fasted conditions, respectively. The ROIs (cortex, hippocampus, hypothalamus and thalamus) are outlined in the maps. C, D Boxplots of the MD and FA values, respectively, from the different regions investigated (cortex, hippocampus, hypothalamus and thalamus) in control cohort and tumor-bearing rats under fed and fasted conditions. Box plots are represented as indicated in Fig. 1. Outliers are plotted individually using the '•' symbol. (* p-value < 0.05, ** p-value < 0.01)
Fig. 4
Fig. 4
Mean diffusivity and fractional anisotropy in the brain of control and GBM rats under fed or fasted conditions without Mn.2+ administration. A, B Representative parametric maps of mean diffusivity (MD) and fractional anisotropy (FA) of a control and a tumor-bearing rat, under fed and fasted conditions, respectively. The ROIs (cortex, hippocampus, hypothalamus and thalamus) are outlined in the maps. CD Boxplots of the MD and FA values, respectively, from the different regions investigated (cortex, hippocampus, hypothalamus and thalamus) in control cohort and tumor-bearing rats under fed and fasted conditions. Box plots are represented as indicated in Fig. 1. Outliers are plotted individually using the '•' symbol. (*/# p-value < 0.05, ** p-value < 0.01, ***/### p-value < 0.001)

Similar articles

Cited by

References

    1. Schwartz MW, Morton GJ. Keeping hunger at bay. Nature. 2002;418:595–597. doi: 10.1038/418595a. - DOI - PubMed
    1. Ezeoke CC, Morley JE. Pathophysiology of anorexia in the cancer cachexia syndrome: pathophysiology of anorexia. J Cachexia Sarcopenia Muscle. 2015;6:287–302. doi: 10.1002/jcsm.12059. - DOI - PMC - PubMed
    1. von Haehling S, Anker SD. Prevalence, incidence and clinical impact of cachexia: facts and numbers-update 2014. J Cachexia Sarcopenia Muscle. 2014;5:261–263. doi: 10.1007/s13539-014-0164-8. - DOI - PMC - PubMed
    1. Cui P, Shao W, Huang C, Wu C-J, Jiang B, Lin D. Metabolic derangements of skeletal muscle from a murine model of glioma cachexia. Skeletal Muscle. 2019;9:3. doi: 10.1186/s13395-018-0188-4. - DOI - PMC - PubMed
    1. Griffith JL, Hochberg FH. Anorexia and weight loss in glioma patients. Psychosomatics. 1988;29:335–337. doi: 10.1016/S0033-3182(88)72373-7. - DOI - PubMed

LinkOut - more resources