Review
. 2023 Aug;39(4):289-300.
doi: 10.3393/ac.2022.00920.0131. Epub 2023 Apr 11.

Total neoadjuvant therapy in rectal cancer: a network meta-analysis of randomized trials

Affiliations
Review

Total neoadjuvant therapy in rectal cancer: a network meta-analysis of randomized trials

Sergey Sychev et al. Ann Coloproctol. 2023 Aug.

Abstract

Purpose: To assess the efficacy of total neoadjuvant therapy (TNT) for rectal carcinoma in comparison with conventional chemoradiotherapy (CRT).

Methods: A systematic review was performed according to the PRISMA guidelines. A Bayesian network meta-analysis was done using NetMetaXL and WinBUGS. This study was registered in PROSPERO on March 3, 2022 (No. CRD-42022307867).

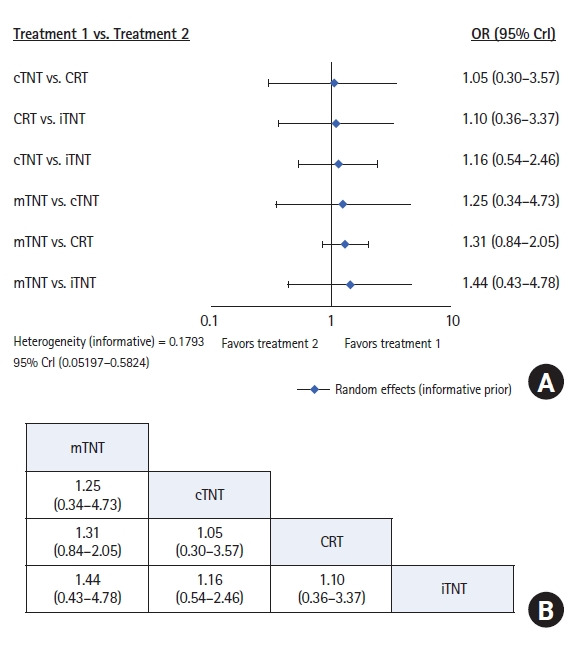
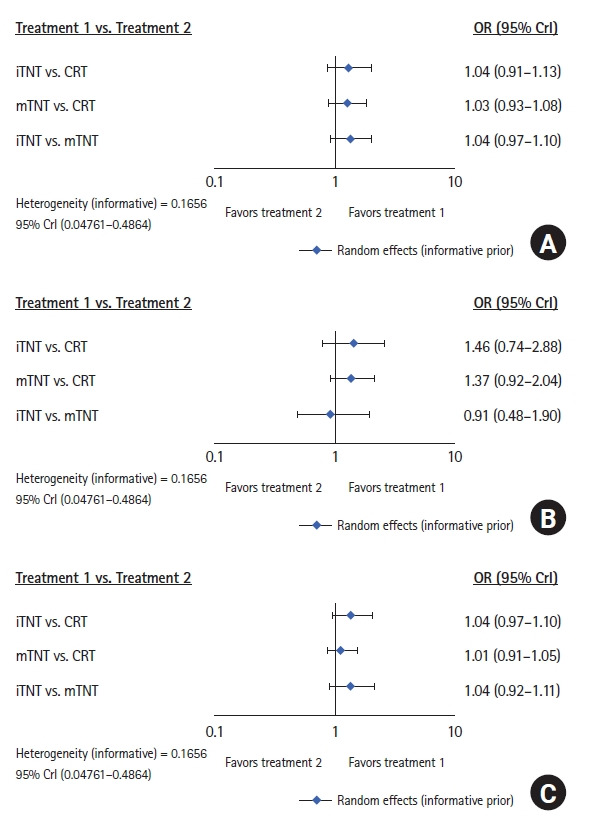
Results: Outcomes of 2,719 patients from 10 randomized trials between 2010 and 2022 were selected. Of these 1,191 (44%) had conventional long-course CRT (50-54 Gy) and capecitabine, 506 (18%) had induction chemotherapy followed by CRT (50-54 Gy) and capecitabine (iTNT), 230 (9%) had long-course CRT (50-54 Gy) followed by consolidation chemotherapy (cTNT), and 792 (29%) undergone modified short-course radiotherapy (25 Gy) with subsequent chemotherapy (mTNT). Total pathologic complete response (pCR) was 20% in the iTNT group, 21% in the mTNT group, 22% in the cTNT group, and 12% in the CRT group. Statistically significant difference in pCR rates was detected when comparing iTNT with CRT (odds ratio [OR], 1.76; 95% credible interval [CrI], 1.06-2.8), mTNT with CRT (OR, 1.90; 95% CrI, 1.25-2.74), and cTNT with CRT groups (OR, 2.54; 95% CrI, 1.26-5.08). No differences were found in R0 resection rates. No significant difference was found in long-term outcomes.

Conclusion: The early administration of systemic chemotherapy in the TNT regimen has improved short-term outcomes, though long-term results are underreported. Randomized trials with survival as the endpoint are necessary to evaluate the possible advantages of TNT modes.

Keywords: Colorectal disease; Neoadjuvant therapy; Network meta-analysis; Rectal neoplasms; Total neoadjuvant therapy.


Conflict of interest statement

Conflict of interest

No potential conflict of interest relevant to this article was reported.

Figures

Fig. 1.
Fig. 1.
Stepwise procedures for database search and the selection of eligible studies. CRT, chemoradiotherapy; TNT, total neoadjuvant treatment; cTNT, long-course CRT (50–54 Gy) followed by consolidation chemotherapy; iTNT, induction chemotherapy followed by CRT (50–54 Gy) and capecitabine ; mTNT, short-course radiotherapy (25 Gy) followed by consolidation chemotherapy.
Fig. 2.
Fig. 2.
Network plot of relevant studies. CRT, chemoradiotherapy; TNT, total neoadjuvant treatment; cTNT, long-course CRT (50–54 Gy) followed by consolidation chemotherapy; iTNT, induction chemotherapy followed by CRT (50–54 Gy) and capecitabine; mTNT, short-course radiotherapy (25 Gy) followed by consolidation chemotherapy
Fig. 3.
Fig. 3.
Forest plot of the pathologic complete response rate. (A) Forest plot. (B) League table. OR, odds ratio; CrI, credible interval; CRT, chemoradiotherapy; TNT, total neoadjuvant therapy; cTNT, long-course CRT (50–54 Gy) followed by consolidation chemotherapy; mTNT, short-course radiotherapy (25 Gy) followed by consolidation chemotherapy; iTNT, induction chemotherapy followed by CRT (50–54 Gy) and capecitabine.
Fig. 4.
Fig. 4.
Ranking plots for the efficacy of the comparison of outcomes among different neoadjuvant regimens. (A) Pathologic complete response. (B) Overall survival. (C) Local recurrence rate. (D) Metastasis rate. SUCRA, surface under the cumulative ranking curve. CRT, chemoradiotherapy; TNT, total neoadjuvant treatment; cTNT, long-course CRT (50–54 Gy) followed by consolidation chemotherapy; iTNT, induction chemotherapy followed by CRT (50–54 Gy) and capecitabine; mTNT, short-course radiotherapy (25 Gy) followed by consolidation chemotherapy.
Fig. 5.
Fig. 5.
Forest plot of the R0 resection rate. (A) Forest plot. (B) League table. OR, odds ratio; CrI, credible interval; CRT, chemoradiotherapy; TNT, total neoadjuvant therapy; cTNT, long-course CRT (50–54 Gy) followed by consolidation chemotherapy; iTNT, induction chemotherapy followed by CRT (50–54 Gy) and capecitabine; mTNT, short-course radiotherapy (25 Gy) followed by consolidation chemotherapy.
Fig. 6.
Fig. 6.
Network-plot of relevant studies with long-term outcomes. CRT, chemoradiotherapy; TNT, total neoadjuvant therapy; mTNT, short-course radiotherapy (25 Gy) followed by consolidation chemotherapy; iTNT, induction chemotherapy followed by CRT (50–54 Gy) and capecitabine.
Fig. 7.
Fig. 7.
Forest plots of long-term outcomes. (A) Overall survival. (B) Metastasis rate. (C) Local recurrence rate. RR, relative ratio; CrI, credible interval; CRT, chemoradiotherapy; TNT, total neoadjuvant therapy; iTNT, induction chemotherapy followed by CRT (50–54 Gy) and capecitabine; cTNT, long-course CRT (50–54 Gy) followed by consolidation chemotherapy; mTNT, short-course radiotherapy (25 Gy) followed by consolidation chemotherapy.
Fig. 8.
Fig. 8.
Plots showing the posterior mean deviance of the individual data points in the inconsistency model against their posterior mean deviance in the consistency model. Inconsistency model of pathology complete response (A), overall survival (B), local recurrence rates (C), and metastasis rates (D).
Fig. 9.
Fig. 9.
Overall assessment of the risk of bias. This diagram summarizes the bias risk for each included study as a generalized bias risk for the whole meta-analysis.
Fig. 10.
Fig. 10.
Table of the risk of bias. The plus sign indicates low risk of bias, the empty field indicates unclear risk of bias, and the minus sign indicates high risk of bias.

References

    1. Bosset JF, Collette L, Calais G, Mineur L, Maingon P, RadosevicJelic L, et al. Chemotherapy with preoperative radiotherapy in rectal cancer. N Engl J Med. 2006;355:1114–23. - PubMed
    1. Braendengen M, Tveit KM, Berglund A, Birkemeyer E, Frykholm G, Påhlman L, et al. Randomized phase III study comparing preoperative radiotherapy with chemoradiotherapy in nonresectable rectal cancer. J Clin Oncol. 2008;26:3687–94. - PubMed
    1. Zorcolo L, Rosman AS, Restivo A, Pisano M, Nigri GR, Fancellu A, et al. Complete pathologic response after combined modality treatment for rectal cancer and long-term survival: a meta-analysis. Ann Surg Oncol. 2012;19:2822–32. - PubMed
    1. Martin ST, Heneghan HM, Winter DC. Systematic review and meta-analysis of outcomes following pathological complete response to neoadjuvant chemoradiotherapy for rectal cancer. Br J Surg. 2012;99:918–28. - PubMed
    1. Rödel C, Martus P, Papadoupolos T, Füzesi L, Klimpfinger M, Fietkau R, et al. Prognostic significance of tumor regression after preoperative chemoradiotherapy for rectal cancer. J Clin Oncol. 2005;23:8688–96. - PubMed