. 2023 Mar 30;5(2):fcad101.
doi: 10.1093/braincomms/fcad101. eCollection 2023.

Cognitive training, but not EEG-neurofeedback, improves working memory in healthy volunteers

Affiliations

Cognitive training, but not EEG-neurofeedback, improves working memory in healthy volunteers

Beatrice Barbazzeni et al. Brain Commun. .

Abstract

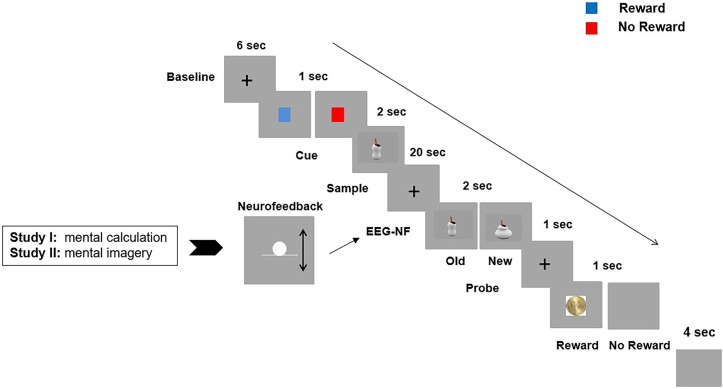
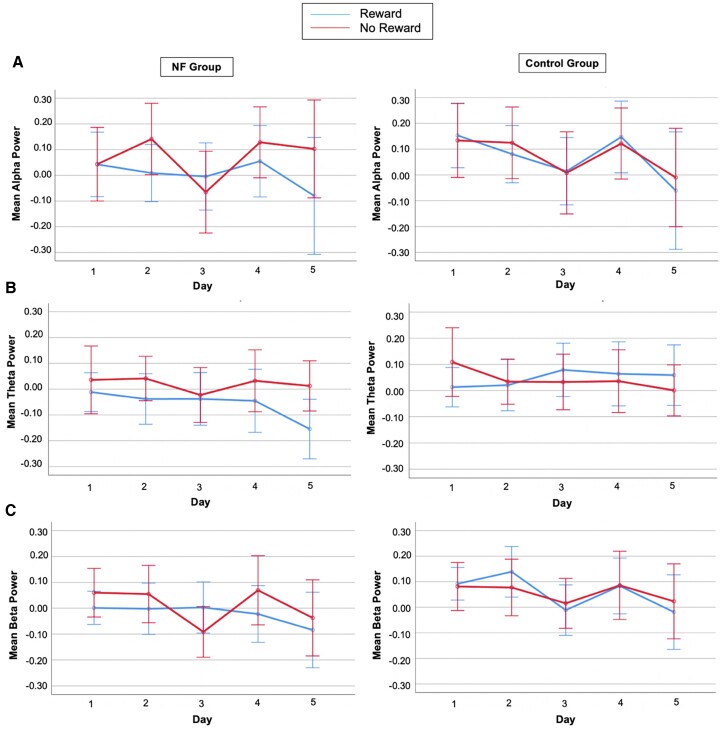
Working memory performance can be influenced by motivational factors, which may be associated with specific brain activities, including suppression of alpha oscillations. We investigated whether providing individuals online feedback about their ongoing oscillations (EEG-neurofeedback) can improve working memory under high and low reward expectancies. We combined working memory training with neurofeedback to enhance alpha suppression in a monetary-rewarded delayed match-to-sample task for visual objects. Along with alpha, we considered the neighbouring theta and beta bands. In a double-blind experiment, individuals were trained over 5 days to suppress alpha power by receiving real-time neurofeedback or control neurofeedback (placebo) in reward and no-reward trials. We investigated (i) whether neurofeedback enhances alpha suppression, (ii) whether monetary reward enhances alpha suppression and working memory, and (iii) whether any performance benefits of neurofeedback-training would transfer to unrelated cognitive tasks. With the same experimental design, we conducted two studies with differing instructions given at the maintenance, yielding together 300 EEG recording sessions. In Study I, participants were engaged in a mental calculation task during maintenance. In Study II, they were instructed to visually rehearse the sample image. Results from Study I demonstrated a significant training and reward-anticipation effect on working memory accuracy and reaction times over 5 days. Neurofeedback and reward anticipation showed effects on theta suppression but not on alpha suppression. Moreover, a cognitive training effect was observed on beta suppression. Thus, neurofeedback-training of alpha was unrelated to working memory performance. Study II replicated the training and reward-anticipation effect on working memory but without any effects of neurofeedback-training on oscillations or working memory. Neither study showed transfer effects of either working memory or neurofeedback-training. A linear mixed-effect model analysis of neurofeedback-independent training-related improvement of working memory combining both studies showed that improved working memory performance was related to oscillatory changes over training days in the encoding and maintenance phases. Improvements in accuracy were related to increasing beta amplitude in reward trials over right parietal electrodes. Improvements in reaction times were related to increases in right parietal theta amplitude during encoding and increased right parietal and decreased left parietal beta amplitudes during maintenance. Thus, while our study provided no evidence that neurofeedback targeting alpha improved the efficacy of working memory training or evidence for transfer, it showed a relationship between training-related changes in parietal beta oscillations during encoding and improvements in accuracy. Right parietal beta oscillations could be an intervention target for improving working memory accuracy.

Keywords: alpha suppression; cognitive training; monetary reward; neurofeedback training; working memory.


Conflict of interest statement

The authors report no competing interests. Emrah Düzel is co-founder of the company Neotiv GmbH. He has conducted paid consultancy work for Roche, Biogen, Lilly, RoxHealth.

Figures

Graphical Abstract
Graphical Abstract
Figure 1
Figure 1
Representation of one single trial in the monetary-rewarded DMST. After a baseline represented as a fixation cross (6 s), a coloured cue was displayed (1 s). The cue could have been red or blue; the red cue predicted no monetary reward independent of the performance, whereas the blue cue predicted monetary reward depending on WM performance. Afterwards, the sample image was displayed for 2 s (i.e. a visual object). Then, the neurofeedback represented as a bouncing ball was given for 20 s, where participants were asked to control the movement of the ball towards the top of the screen. The movement of the ball towards the top was inversely proportional to the power of alpha in the NF group, whereas in the CO group, the movement of the ball was generated by random numbers. To enhance alpha power suppression, all participants in Study I were instructed to perform a mental calculation task, whereas all participants in Study II were instructed to perform a mental imagery task (to visually rehearse the sample image). Successively, the probe image was displayed (2 s), and participants were asked to make a choice between ‘old’ and ‘new’, where RTs were computed. Depending on the cue condition and participants’ performance, after a fixation cross of 1 s, a monetary reward was displayed (i.e. displayed as a 50-cent image) or not (i.e. grey screen) for 1 s. To switch from one trial to the other, a break of 4 s between trials was given (i.e. grey screen).
Figure 2
Figure 2
Accuracy and reaction time results in Study I and Study II. A Accuracy is represented for the NF group (left) and for the CO group (right) in Study I. In both figures, training days are represented on the x-axis, and mean accuracy is represented on the y-axis. Blue lines denote behavioural data from the reward condition. Red lines denote behavioural data from the no-reward condition. Accuracy improved across 5 days (F(4,112) = 8.302, P = 0.000, ηp2 = 0.229). B RTs are represented for the NF group (left) and for the CO group (right) in Study I. In both figures, training days are represented on the x-axis, and mean RTs are represented on the y-axis. Blue lines denote behavioural data from the reward condition. Red lines denote behavioural data from the no-reward condition. RTs improved across 5 days (F(2.800,75.601) = 3.318, P = 0.027, ηp2 = 0.109) with a significant reward-anticipation effect (F(1,27) = 8.344, P = 0.008, ηp2 = 0.236). C Accuracy is represented for the NF group (left) and for the CO group (right) in Study II. In both figures, training days are represented on the x-axis and mean accuracy on the y-axis. Blue lines denote behavioural data from the reward condition. Red lines denote behavioural data from the no-reward condition. Accuracy improved across 5 days (F(4,112) = 8.991, P = 0.000, ηp2 = 0.243) with a significant reward-anticipation effect (F(1,28) = 5.313, P = 0.029, ηp2 = 0.159). D RTs are represented for the NF group (left) and for the CO group (right) in Study II. In both figures, training days are represented on the x-axis and mean RTs on the y-axis. Blue lines denote behavioural data from the reward condition. Red lines denote behavioural data from the no-reward condition. RTs improved across 5 days (F(2.009,54.241) = 3.183, P = 0.049, ηp2 = 0.105) with a significant reward-anticipation effect (F(1,27) = 4.458, P = 0.044, ηp2 = 0.142 Red lines denote behavioural data from the no-reward condition. Error bars are 95% confidence intervals (CI) and factor gender as covariates.
Figure 3
Figure 3
Mean alpha, theta, and low-beta power results in Study I. A Channels P3, Pz, and P4 were considered for the time-frequency analysis, and the displayed signal is the grand average across these channels. Alpha power is represented for the NF group (left) and for the CO group (right). In both figures, training days are represented on the x-axis and mean alpha power on the y-axis. Blue lines denote time-frequency data from the reward condition. Red lines denote time-frequency data from the no-reward condition. B Channels P3, Pz, and P4 have been considered for the time-frequency analysis, and the displayed signal is the grand average across these channels. Theta power is represented for the NF group (left) and for the CO group (right). In both figures, training days are represented on the x-axis and mean theta power on the y-axis. Blue lines denote time-frequency data from the reward condition. Red lines denote time-frequency data from the no-reward condition. Although no significant differences were found in the relative theta power across 5 days, groups, or reward anticipation, the interaction between reward anticipation and the type of NF or CO training (F(1,27) = 4.881, P = 0.036, ηp2 = 0.153) was significant. Furthermore, when considering Day 1 and Day 5, the interaction between NF training and reward anticipation (F(1,27) = 5.056, P = 0.033, ηp2 = 0.158) was also significant. C Channels P3, Pz, and P4 were considered for the time-frequency analysis, and the displayed signal is the grand average across these channels. Beta power is represented for the NF group (left) and for the CO group (right). In both figures, training days are represented on the x-axis and mean beta power on the y-axis. Blue lines denote time-frequency data from the reward condition. Red lines denote time-frequency data from the no-reward condition. Error bars are 95% confidence intervals (CI) and factor gender as covariates. A significant decrease in relative low-beta power was found across 5 days (F(2.581,69.677) = 3.775, P = 0.019, ηp2 = 0.123).
Figure 4
Figure 4
Study I: for illustration purposes, graphical representations of the power spectrum from the time-frequency analysis for both groups in reward condition. The power spectrum is represented for channel P4 for the NF (left) and CO groups (right). Only Day 1 (top) and Day 5 (bottom) are represented for the reward condition. On the x-axis, the time is represented from −5000 to 23 000 ms. This time period includes baseline, cue presentation, sample image, and neurofeedback period, where 0 ms represents the presentation of the cue predicting reward. The red line indicates the beginning of the neurofeedback period. In addition, black lines that separate the events and numbers clarify which events appeared for this event time period. Thus, number 1 indicated the baseline, number 2 the presentation of the cue predicting reward, number 3 the sample image presentation, and number 4 the neurofeedback period. On the y-axis, frequencies from 2 to 20 Hz with a resolution of 0.5 Hz are represented.
Figure 5
Figure 5
Mean alpha, theta, and low-beta power results in Study II. A Channels P3, Pz, and P4 were considered for the time-frequency analysis, and the displayed signal is the grand average across these channels. Alpha power is represented for the NF group (left) and for the CO group (right). In both figures, training days are represented on the x-axis and mean alpha power on the y-axis. Blue lines denote time-frequency data from the reward condition. Red lines denote time-frequency data from the no-reward condition. B Channels P3, Pz, and P4 have been considered for the time-frequency analysis, and the displayed signal is the grand average across these channels. Theta power is represented for the NF group (left) and for the CO group (right). In both figures, training days are represented on the x-axis and mean theta power on the y-axis. Blue lines denote time-frequency data from the reward condition. Red lines denote time-frequency data from the no-reward condition. C Channels P3, Pz, and P4 were considered for the time-frequency analysis, and the displayed signal is the grand average across these channels. Beta power is represented for the NF group (left) and for the CO group (right). In both figures, training days are represented on the x-axis and mean beta power on the y-axis. Blue lines denote time-frequency data from the reward condition. Red lines denote time-frequency data from the no-reward condition. Error bars are 95% confidence intervals (CI) and factor gender as covariates.
Figure 6
Figure 6
Study II: for illustration purposes, graphical representations of the power spectrum from the time-frequency analysis for both groups in reward condition. The power spectrum is represented for channel P4 for the NF (left) and CO groups (right). Only Day 1 (top) and Day 5 (bottom) are represented for the reward condition. On the x-axis, the time is represented from −5000 to 23 000 ms. This time period includes baseline, cue presentation, sample image, and neurofeedback period, where 0 ms represents the presentation of the cue predicting reward. The red line indicates the beginning of the neurofeedback period. On the y-axis, frequencies from 2 to 20 Hz with a resolution of 0.5 Hz are represented.

Similar articles

Cited by

References

    1. Cowan N. Working memory underpins cognitive development, learning, and education. Educ Psychol Rev. 2014;26(2):197–223. - PMC - PubMed
    1. Malecki U, Stallforth S, Lavie N, Duezel E. Neural generators of sustained activity differ of stimulus-encoding and delay maintenance. Eur J Neurosci. 2009;30(5):924–933. - PubMed
    1. Klimesh W. Alpha-band oscillations, attention, and controlled access to stored information. Trends Cogn Sci (Regul Ed). 2012;16:606–617. - PMC - PubMed
    1. Klimesch W. Episodic and semantic memory: An analysis in the EEG-theta and alpha band. Electroencephalogr Clin Neurophysiol. 1994;91:428–441. - PubMed
    1. Klimesh W. EEG-alpha rhythms and memory processes. Int J Psychophysiol. 1997;26:319–340. - PubMed

LinkOut - more resources