

Counting animals in aerial images with a density map estimation model
- PMID: 37038528
- PMCID: PMC10082175
- DOI: 10.1002/ece3.9903
Counting animals in aerial images with a density map estimation model
Abstract
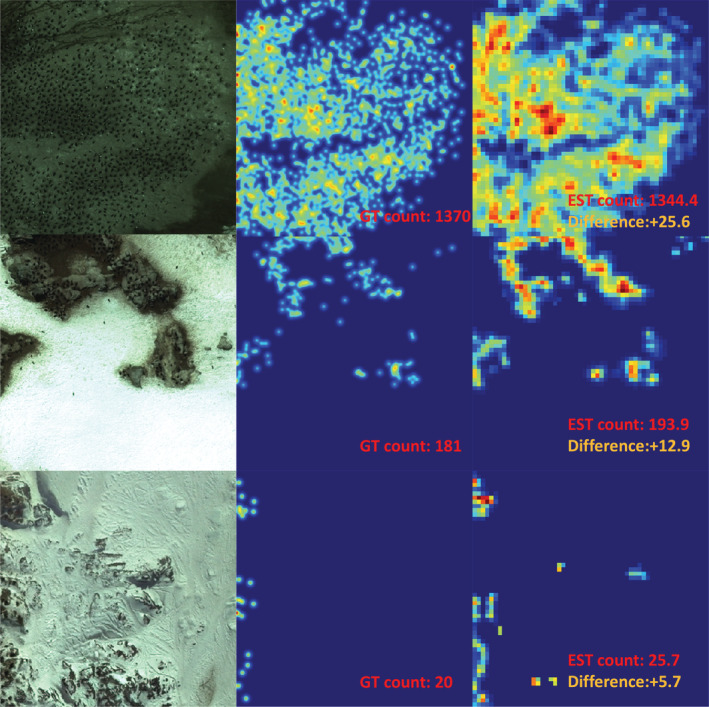
Animal abundance estimation is increasingly based on drone or aerial survey photography. Manual postprocessing has been used extensively; however, volumes of such data are increasing, necessitating some level of automation, either for complete counting, or as a labour-saving tool. Any automated processing can be challenging when using such tools on species that nest in close formation such as Pygoscelis penguins. We present here a customized CNN-based density map estimation method for counting of penguins from low-resolution aerial photography. Our model, an indirect regression algorithm, performed significantly better in terms of counting accuracy than standard detection algorithm (Faster-RCNN) when counting small objects from low-resolution images and gave an error rate of only 0.8 percent. Density map estimation methods as demonstrated here can vastly improve our ability to count animals in tight aggregations and demonstrably improve monitoring efforts from aerial imagery.
Keywords: abundance estimation; density map estimation; image processing; machine learning.
© 2023 The Authors. Ecology and Evolution published by John Wiley & Sons Ltd.
Conflict of interest statement
The authors declare no competing interests.
Figures


References
-
- Afán, I. , Máñez, M. , & Díaz‐Delgado, R. (2018). Drone monitoring of breeding waterbird populations: The case of the glossy ibis. Drones, 2(4), 42. 10.3390/drones2040042 - DOI
-
- Buchholz, T.‐O. , Prakash, M. , Schmidt, D. , Krull, A. , & Jug, F. (2020). Denoiseg: Joint denoising and segmentation. ECCV 2020 Workshop on BioImage Computing.
-
- Butler, R. , & Muller‐Schwarze, D. (1977). Penguin census by aerial photographic analysis at cape crozier, ross Island. Antarctic Journal of the USA, 12, 25–27.
-
- Chabot, D. , & Bird, D. M. (2012). Evaluation of an off‐the‐shelf unmanned aircraft system for surveying flocks of geese.
Associated data
LinkOut - more resources
Full Text Sources
Other Literature Sources
