Calcitriol modifies tight junctions, improves barrier function, and reduces TNF-α-induced barrier leak in the human lung-derived epithelial cell culture model, 16HBE 14o
- PMID: 37038908
- PMCID: PMC10086678
- DOI: 10.14814/phy2.15592
Calcitriol modifies tight junctions, improves barrier function, and reduces TNF-α-induced barrier leak in the human lung-derived epithelial cell culture model, 16HBE 14o
Abstract
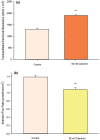
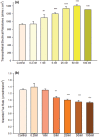
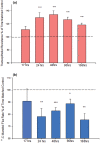
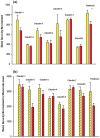
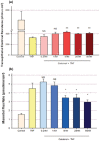
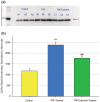
Using the 16HBE 14o- human airway epithelial cell culture model, calcitriol (Vitamin D) was shown to improve barrier function by two independent metrics - increased transepithelial electrical resistance (TER) and reduced transepithelial diffusion of 14 C-D-mannitol (Jm ). Both effects were concentration dependent and active out to 168 h post-treatment. Barrier improvement associated with changes in the abundance of specific tight junctional (TJ) proteins in detergent-soluble fractions, most notably decreased claudin-2. TNF-α-induced compromise of barrier function could be attenuated by calcitriol with a concentration dependence similar to that observed for improvement of control barrier function. TNF-α-induced increases in claudin-2 were partially reversed by calcitriol. The ERK 1,2 inhibitor, U0126, itself improved 16HBE barrier function indicating MAPK pathway regulation of 16HBE barrier function. Calcitriol's action was additive to the effect of U0126 in reducing TNF- α -induced barrier compromise, suggesting that calcitriol may be acting through a non-ERK pathway in its blunting of TNF- α - induced barrier compromise. This was supported by calcitriol being without effect on pERK levels elevated by the action of TNF-α. Lack of effect of TNF- α on the death marker, caspase-3, and the inability of calcitriol to decrease the elevated LC3B II level caused by TNF-α, suggest that calcitriol's barrier improvement does not involve a cell death pathway. Calcitriol's improvement of control barrier function was not additive to barrier improvement induced by retinoic acid (Vitamin A). Calcitriol improvement and protection of airway barrier function could in part explain Vitamin D's reported clinical efficacy in COVID-19 and other airway diseases.
Keywords: ERK; Sharpe-Strumia Research Foundation; calcitriol; claudin; lung; micronutrient; tight junction; tumor necrosis factor.
© 2023 The Authors. Physiological Reports published by Wiley Periodicals LLC on behalf of The Physiological Society and the American Physiological Society.
Figures



Similar articles
-
Micronutrients at Supplemental Levels, Tight Junctions and Epithelial Barrier Function: A Narrative Review.Int J Mol Sci. 2024 Mar 19;25(6):3452. doi: 10.3390/ijms25063452. Int J Mol Sci. 2024. PMID: 38542424 Free PMC article. Review.
-
The multiphasic TNF-α-induced compromise of Calu-3 airway epithelial barrier function.Exp Lung Res. 2023;49(1):72-85. doi: 10.1080/01902148.2023.2193637. Epub 2023 Mar 31. Exp Lung Res. 2023. PMID: 37000123
-
Retinoic acid improves baseline barrier function and attenuates TNF-α-induced barrier leak in human bronchial epithelial cell culture model, 16HBE 14o.PLoS One. 2020 Dec 10;15(12):e0242536. doi: 10.1371/journal.pone.0242536. eCollection 2020. PLoS One. 2020. PMID: 33301441 Free PMC article.
-
Inhibition of Autophagic Degradation Process Contributes to Claudin-2 Expression Increase and Epithelial Tight Junction Dysfunction in TNF-α Treated Cell Monolayers.Int J Mol Sci. 2017 Jan 17;18(1):157. doi: 10.3390/ijms18010157. Int J Mol Sci. 2017. PMID: 28106723 Free PMC article.
-
Micronutrient Improvement of Epithelial Barrier Function in Various Disease States: A Case for Adjuvant Therapy.Int J Mol Sci. 2022 Mar 10;23(6):2995. doi: 10.3390/ijms23062995. Int J Mol Sci. 2022. PMID: 35328419 Free PMC article. Review.
Cited by
-
Micronutrients at Supplemental Levels, Tight Junctions and Epithelial Barrier Function: A Narrative Review.Int J Mol Sci. 2024 Mar 19;25(6):3452. doi: 10.3390/ijms25063452. Int J Mol Sci. 2024. PMID: 38542424 Free PMC article. Review.
-
Pharmacological evaluation of vitamin D in COVID-19 and long COVID-19: recent studies confirm clinical validation and highlight metformin to improve VDR sensitivity and efficacy.Inflammopharmacology. 2024 Feb;32(1):249-271. doi: 10.1007/s10787-023-01383-x. Epub 2023 Nov 13. Inflammopharmacology. 2024. PMID: 37957515 Free PMC article. Review.
-
Prenatal vitamin D supplementation to prevent childhood asthma: 15-year results from the Vitamin D Antenatal Asthma Reduction Trial (VDAART).J Allergy Clin Immunol. 2024 Feb;153(2):378-388. doi: 10.1016/j.jaci.2023.10.003. Epub 2023 Oct 16. J Allergy Clin Immunol. 2024. PMID: 37852328 Free PMC article. Review.
-
Quercetin improves and protects Calu-3 airway epithelial barrier function.Front Cell Dev Biol. 2023 Nov 23;11:1271201. doi: 10.3389/fcell.2023.1271201. eCollection 2023. Front Cell Dev Biol. 2023. PMID: 38078004 Free PMC article.
-
Vitamin D: A Nutraceutical Supplement at the Crossroad Between Respiratory Infections and COVID-19.Int J Mol Sci. 2025 Mar 12;26(6):2550. doi: 10.3390/ijms26062550. Int J Mol Sci. 2025. PMID: 40141190 Free PMC article. Review.
References
-
- Amoozadeh, Y. , Dan, Q. , Xiao, J. , Waheed, F. , & Szászi, K. (2015). Tumor necrosis factor‐α induces a biphasic change in claudin‐2 expression in tubular epithelial cells: Role in barrier functions. American Journal of Physiology. Cell Physiology, 309(1), C38–C50. 10.1152/ajpcell.00388.2014 - DOI - PMC - PubMed
Publication types
MeSH terms
Substances
LinkOut - more resources
Full Text Sources
Medical
Research Materials
Miscellaneous

