. 2023 Apr 15;150(8):dev201644.
doi: 10.1242/dev.201644. Epub 2023 Apr 24.

Pten inhibition dedifferentiates long-distance axon-regenerating intrinsically photosensitive retinal ganglion cells and upregulates mitochondria-associated Dynlt1a and Lars2

Affiliations

Pten inhibition dedifferentiates long-distance axon-regenerating intrinsically photosensitive retinal ganglion cells and upregulates mitochondria-associated Dynlt1a and Lars2

Bruce A Rheaume et al. Development. .

Abstract

Central nervous system projection neurons fail to spontaneously regenerate injured axons. Targeting developmentally regulated genes in order to reactivate embryonic intrinsic axon growth capacity or targeting pro-growth tumor suppressor genes such as Pten promotes long-distance axon regeneration in only a small subset of injured retinal ganglion cells (RGCs), despite many RGCs regenerating short-distance axons. A recent study identified αRGCs as the primary type that regenerates short-distance axons in response to Pten inhibition, but the rare types which regenerate long-distance axons, and cellular features that enable such response, remained unknown. Here, we used a new method for capturing specifically the rare long-distance axon-regenerating RGCs, and also compared their transcriptomes with embryonic RGCs, in order to answer these questions. We found the existence of adult non-α intrinsically photosensitive M1 RGC subtypes that retained features of embryonic cell state, and showed that these subtypes partially dedifferentiated towards an embryonic state and regenerated long-distance axons in response to Pten inhibition. We also identified Pten inhibition-upregulated mitochondria-associated genes, Dynlt1a and Lars2, which promote axon regeneration on their own, and thus present novel therapeutic targets.

Keywords: Axon growth; Mouse; Optic nerve; Retinal ganglion cell; scRNA-seq.


Conflict of interest statement

Competing interests The authors declare no competing or financial interests.

Figures
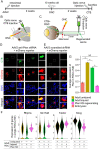
Fig. 1.
Fig. 1.
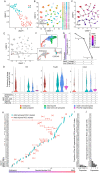
Isolation of RGCs which regenerated long-distance axons in response to Pten KD. (A-C) Experimental timeline (A; see Materials and Methods for details). Adult mice were pre-treated with intravitreally injected anti-Pten or scrambled shRNA (control) AAV2 viruses co-expressing mCherry reporter. Two weeks later, an ONC injury was performed. Two weeks after this, Alexa Fluor 488-conjugated CTB was injected into the end of optic nerve (3 mm distally from the ONC site) (B), and retrogradely transported via the regenerated axons into the RGC soma located in the retina (C). Twelve hours later, animals were sacrificed (A) either for histological analysis, or live RGCs were isolated by Thy1 immunopanning and FACS carried out for mCherry/CTB double-positive cells, which were immediately processed by droplet-based scRNA-seq. (D,E) Representative confocal images of the flat-mounted ganglion cell layer at 2 weeks after ONC, with CTB-488 injected into the end of the optic nerve 12 h before sacrifice, from the animals pre-treated with AAV2 anti-Pten shRNA (D) or AAV2 scrambled shRNA control (E). Only a small portion of anti-Pten shRNA AAV2-transduced RGCs expressing an mCherry reporter were also CTB+; examples of CTB+ and CTB RGCs expressing mCherry are shown (D). Examples of CTB (E) RGCs expressing mCherry reporter of transduction with scrambled shRNA control are also shown, but no CTB+ RGCs were found in the control condition. (F) Gene expression violin plots of pan-RGC marker genes in single cells, as marked, show that these markers are expressed in the Pten KD long-distance axon-regenerating RGCs in a similar range as in uninjured or injured (non-treated) adult RGCs. (G) Pten gene expression is substantially upregulated developmentally [from 0.18 normalized expression (NE) in embryonic to 0.54 NE in adult RGCs; P<0.001] but only modestly downregulated in RGCs after ONC (to 0.45 NE 2 weeks after injury; P<0.001). In the injured RGCs transduced with AAV2 anti-Pten shRNA (which regenerated long-distance axons after ONC), Pten gene expression is substantially knocked-down (to 0.12 NE; P<0.001) to below embryonic level (although not significantly different from embryonic; P=3.1). Data analyzed using one-way ANOVA, overall F=238.9, *P<0.001, with P-values of pairwise comparisons determined by posthoc LSD. Error bars represent s.e.m. NS, not significant. See Materials and Methods and Fig. 2 for more details on scRNA-seq analysis pipeline. Scale bars: 20 µm (D,E; main panels); 10 µm (D,E; insets).
Fig. 2.
Fig. 2.
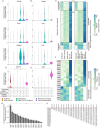
Adult RGC subtypes that are more similar to embryonic RGCs regenerate long-distance axons and dedifferentiate towards an embryonic state. (A) UMAP of Pten KD long-distance axon-regenerating RGCs shows segregation into two clusters (A and B, color-coded; see Materials and Methods for details). (B,C) UMAP of embryonic (gray; sub-clusters shown in inset F, upper panel) and adult RGC clusters (color-coded by cluster assignment per original publications; Tran et al., 2019; Rheaume and Trakhtenberg, 2022 preprint) (B), with a color-coded pseudo-timeline (C) indicating the relative transcriptomic changes progressing from embryonic into adult RGC state, and showing that within the adult RGC subtypes some remain more similar to embryonic whereas others change more during developmental maturation (i.e. localized further away from embryonic along the pseudo-timeline). Pseudo-timeline color-coded scale bar, in arbitrary units (AU), of relative distance along the pseudo-timeline is shown below panel C. (D) Gene expression violin plots of embryonic RGC marker genes in single cells, as marked, show that expression of these markers was retained in embryonic-like adult RGC subtypes C33/C40, as well as in the Pten KD long-distance axon-regenerating RGCs, but was downregulated in other RGC subtypes during maturation. (E,F) Pten KD long-distance axon-regenerating RGCs assignment to the UMAP of embryonic and adult atlas RGCs (from B,C; implementation of integration algorithm is detailed in the Materials and Methods) shows that almost all Pten KD long-distance axon-regenerating RGCs are similar to embryonic RGCs (i.e. bioinformatically mapped to embryonic RGCs and to clusters C33/C40, which are the closest to embryonic) (E). Magnified inset below (F, lower panel) shows that, long-distance regenerating RGCs cluster A (shown in A) mapped to the cluster C40 and embryonic RGCs, whereas long-distance regenerating RGCs cluster B (shown in A) mapped to cluster C33 (F). Assignments of Pten KD long-distance axon-regenerating RGCs by the integration algorithm only to the adult atlas RGC UMAP (without embryonic RGCs) results in almost all (96%) mapping only to the M1 ipRGC clusters C33/C40 (see H). (G) Averages of pseudo-timeline scores (from C and E) for individual RGCs comprising the adult atlas, injured and Pten KD long-distance axon-regenerating groups show that adult RGC transcriptomes partially revert towards an embryonic state after axonal injury, and that the long-distance regenerating RGC transcriptomes are significantly closer to the embryonic state than untreated injured RGC transcriptomes overall. Data are mean±s.e.m. Overall F=728.1, *P<0.0001 using one-way ANOVA, with pairwise comparisons by posthoc LSD. (H) Average pseudo-timeline scores (from C, per scale bar there) of the adult atlas RGC clusters (green), ranked lowest-to-highest on the embryonic-adult RGC pseudo-timeline (x-axis; the lower the score the closer to embryonic state the cluster is). Of the surviving RGC clusters (red), 19 shifted closer to the embryonic state by 2 weeks after injury (indicated by black asterisk, P<0.0001) based on their average pseudo-timeline scores (shown on the x-axis), but still not as close as uninjured ipRGC clusters C33/C40 (which regenerated long-distance axons in response to Pten KD treatment, see I). All RGC atlas Opn4+ clusters, which include all known ipRGC amongst other clusters, are the closest to the embryonic state on the pseudo-timeline, as indicated on the y-axis (see J). Data are mean±s.e.m. shown for clusters; overall F=190.8, P<0.0001 using two-way ANOVA, with pairwise comparisons by posthoc LSD at P<0.05 showing cluster means which shifted significantly closer to the embryonic state (indicated by black asterisk). Clusters C24, C38 and C39 did not survive for more than 2 weeks after injury (brown asterisk). (I) Compared with cluster proportion in the adult RGC atlas, the proportion of Pten KD long-distance axon-regenerating RGCs (which bioinformatically mapped to adult atlas RGC clusters) is significantly enriched in the adult RGC clusters that are the closest to the embryonic RGC state (on the embryonic-adult RGC state pseudo-timeline, x-axis in H; *P<0.05 by EdgeR, see Materials and Methods). (J) Opn4 expression is enriched in RGC atlas clusters C7, C8, C43, C22, C31, C40 and C33 (of which the last four are ipRGC clusters) consistent with the original publication (Tran et al., 2019). These Opn4+ clusters are the closest to the embryonic state on the pseudo-timeline, as indicated in panel H. Error bars represent s.e.m. NE, normalized expression.
Fig. 3.
Fig. 3.
Developmentally regulated and non-regulated DEGs in the Pten KD long-distance axon-regenerating RGCs. (A,B) Gene expression violin plots of clusters C33/C40 marker genes show that markers were upregulated during RGC maturation only in these, but not in other, adult RGC subtypes, and that these markers are expressed in the Pten KD long-distance axon-regenerating RGCs (A). Some of these developmentally upregulated C33/C40 marker genes were downregulated by injury in (non-treated) adult RGCs, as marked, but injury-induced downregulation of their expression was rescued in the Pten KD long-distance axon-regenerating RGCs (B). (C) Heatmap of genes which are differentially expressed between clusters C33/C40 of ONC RGCs and Pten KD long-distance axon-regenerating RGCs (upregulated: log2 fold change (FC) ≥1.5 and Pten KD RGC expression ≥0.5 NE; downregulated: log2 FC ≤−1.5 and ONC RGC expression ≥0.5 NE). The genes displayed in the top-most and bottom-most sections of the heatmap also demonstrate a developmentally regulated pattern. Developmentally upregulated genes are those which also have a log2 FC ≥0.5 between embryonic and adult clusters C33 and C40 and ≥0.01 NE in the adult C33 and C40 clusters. Developmentally downregulated genes: log2 FC ≤−1.5 and ≥0.01 NE in the embryonic timepoint. All gene FCs displayed in the heatmap are significantly differentially expressed (P<0.05; Mann–Whitney U-test). (D) Dynlt1a gene expression is substantially downregulated developmentally (from 0.4 NE in embryonic to 0.02 NE in adult RGCs; P<0.001) and does not change after ONC. However, in the Pten KD long-distance axon-regenerating RGCs, Dynlt1a gene expression is substantially upregulated (to 0.55 NE; P<0.001) to even above embryonic level. Data analyzed using one-way ANOVA, overall F=1756.3, P<0.0001, with P-values of pairwise comparisons determined by posthoc LSD. Significant differences (P<0.001) indicated by an asterisk. (E) Lars2 gene is expressed at a relatively low basal level and is not regulated developmentally or after ONC (ranging from 0.04-0.05 NE through development and after injury). However, in the Pten KD long-distance axon-regenerating RGCs, Lars2 gene expression is substantially upregulated (to 2.24 NE; P<0.001). Data analyzed using one-way ANOVA, overall F=2334.9, P<0.0001, with P-values of pairwise comparisons determined by posthoc LSD. Significant differences (P<0.001) indicated by an asterisk. (F) Heatmap of mt-tRNA-specific aaRSs genes, which are differentially expressed between clusters C33/C40 of ONC RGCs and Pten KD long-distance axon-regenerating RGCs (downregulated and upregulated, with Lars2 being the most highly upregulated, as marked). (G,H) Average percent of amino acids (AAs) in all mtDNA-encoded proteins, ranked from the highest (left) to lowest (right), showing that Lars2-aminoacylated L (outlined with dashed line) is significantly more enriched than any other AA in all mtDNA-encoded proteins. Error bars represent s.e.m. (G). Data analyzed using ANOVA, overall F=21.4, *P<0.001, with P-values for pairwise comparisons determined by posthoc LSD, showing that L is the only AA that is significantly (P<0.001) overrepresented in mitochondrial DNA-encoded proteins compared with every other AA (and not just compared with some AAs) (H). NE, normalized expression.
Fig. 4.
Fig. 4.
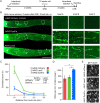
Dynlt1a and Lars2 promote axon regeneration and RGC survival. (A) Experimental timeline: 8-week-old mice were pre-treated with AAV2 vectors expressing Dynlt1a, Lars2 or mCherry control. ONC injury was performed 2 weeks later. Animals were sacrificed for histological analysis 2 weeks after ONC. Axonal tracer CTB was injected intravitreally before sacrifice. (B) Representative images of the optic nerve longitudinal sections with CTB-labeled axons at 2 weeks after ONC from the animals pre-treated with AAV2 expressing Dynlt1a, Lars2 or mCherry control, as marked. The edges of the tissue were optically trimmed (i.e. cropped-out) due to artefactual autofluorescence that is common at tissue edges. Insets show representative images of the optic nerve regions proximal and distal to the injury site, magnified for better visualization of the axons or their absence. The longest regenerating (by 2 weeks after ONC) axons in the Lars2-treated condition are indicated by arrows. (C) Quantitation of CTB-labeled regenerating axons at 2 weeks after ONC, at increasing distances from the injury site, after pre-treatment with AAV2 expressing Dynlt1a, Lars2 or mCherry control, as marked (mean±s.e.m.; n=4 cases per group). Data analyzed using repeated measures ANOVA, sphericity assumed, overall F=13.4, P<0.001, with P-values of pairwise comparisons determined by posthoc LSD shown in the inset table, and significant differences (P<0.03) indicated by an asterisk. (D,E) Quantitation of RGC survival in retinal flatmounts immunostained for an RGC marker βIII-Tubulin (Tuj1 antibody) at 2 weeks after ONC, pre-treated with AAV2 expressing Dynlt1a, Lars2 or mCherry control (mean±s.e.m.; n=4 cases per group). Data analyzed using ANOVA, overall F=5.6, P<0.04, with P-values of pairwise comparisons determined by posthoc LSD. Significant differences (P<0.03) indicated by an asterisk (D). Corresponding representative images are shown (E). Scale bars: 500 µm (B, main panels); 50 µm (B, insets; E).
Fig. 5.
Fig. 5.
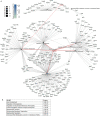
Convergence of mitochondrial and axonal growth biological processes in the gene network upregulated in Pten KD long-distance axon-regenerating RGCs. (A) Gene-Concept Network Plot of a subset of genes co-upregulated in response to Pten KD in long-distance axon-regenerating RGCs, shows association between the gene-ontology biological processes (GO:BP) of mitochondria, axonal growth and neurodevelopment, which involve Lars2 and Dynlt1a (red lines). The finding that Lars2, which belongs to the GO:BP ‘mitochondrial translation’, promotes axon regeneration, which belongs to the GO:BP ‘positive regulation of neuronal axonal projection’, has linked (red dashed line) these biological processes. Bubble size scale indicate GO:BP node size based on the number of upregulated genes within that node. Color scale bar indicates the fold change (FC) of each gene in Pten KD long-distance axon-regenerating RGCs relative to injured untreated RGCs (see Materials and Methods for more details). (B) Functional enrichment analysis P-values of the GO:BP terms shown in Gene-Concept Network Plot. Terms are ordered by the decreasing number of DEGs in Pten KD long-distance axon-regenerating RGCs for respective GO:BP term.

Similar articles

Cited by

References

    1. Apara, A., Galvao, J., Wang, Y., Blackmore, M., Trillo, A., Iwao, K., Brown, D. P., Fernandes, K. A., Huang, A., Nguyen, T.et al. (2017). KLF9 and JNK3 interact to suppress axon regeneration in the adult CNS. J. Neurosci. 37, 9632-9644. 10.1523/JNEUROSCI.0643-16.2017 - DOI - PMC - PubMed
    1. Barter, R. L. and Yu, B. (2018). Superheat: An R package for creating beautiful and extendable heatmaps for visualizing complex data. J. Comput. Graph. Stat. 27, 910-922. 10.1080/10618600.2018.1473780 - DOI - PMC - PubMed
    1. Benowitz, L. I., He, Z. and Goldberg, J. L. (2017). Reaching the brain: Advances in optic nerve regeneration. Exp. Neurol. 287, 365-373. 10.1016/j.expneurol.2015.12.015 - DOI - PubMed
    1. Bhansali, P., Rayport, I., Rebsam, A. and Mason, C. (2014). Delayed neurogenesis leads to altered specification of ventrotemporal retinal ganglion cells in albino mice. Neural Dev. 9, 11. 10.1186/1749-8104-9-11 - DOI - PMC - PubMed
    1. Blackmore, M. G., Wang, Z., Lerch, J. K., Motti, D., Zhang, Y. P., Shields, C. B., Lee, J. K., Goldberg, J. L., Lemmon, V. P. and Bixby, J. L. (2012). Krüppel-like Factor 7 engineered for transcriptional activation promotes axon regeneration in the adult corticospinal tract. Proc. Natl. Acad. Sci. USA 109, 7517-7522. 10.1073/pnas.1120684109 - DOI - PMC - PubMed

Publication types

MeSH terms

Substances