Comment
. 2023 Jul 5;29(13):2501-2512.
doi: 10.1158/1078-0432.CCR-22-3496.

Increased Nerve Density Adversely Affects Outcome in Oral Cancer

Affiliations
Comment

Increased Nerve Density Adversely Affects Outcome in Oral Cancer

Cindy Perez-Pacheco et al. Clin Cancer Res. .

Abstract

Purpose: Perineural invasion (PNI) in oral cavity squamous cell carcinoma (OSCC) is associated with poor survival. Because of the risk of recurrence, patients with PNI receive additional therapies after surgical resection. Mechanistic studies have shown that nerves in the tumor microenvironment promote aggressive tumor growth. Therefore, in this study, we evaluated whether nerve density (ND) influences tumor growth and patient survival. Moreover, we assessed the reliability of artificial intelligence (AI) in evaluating ND.

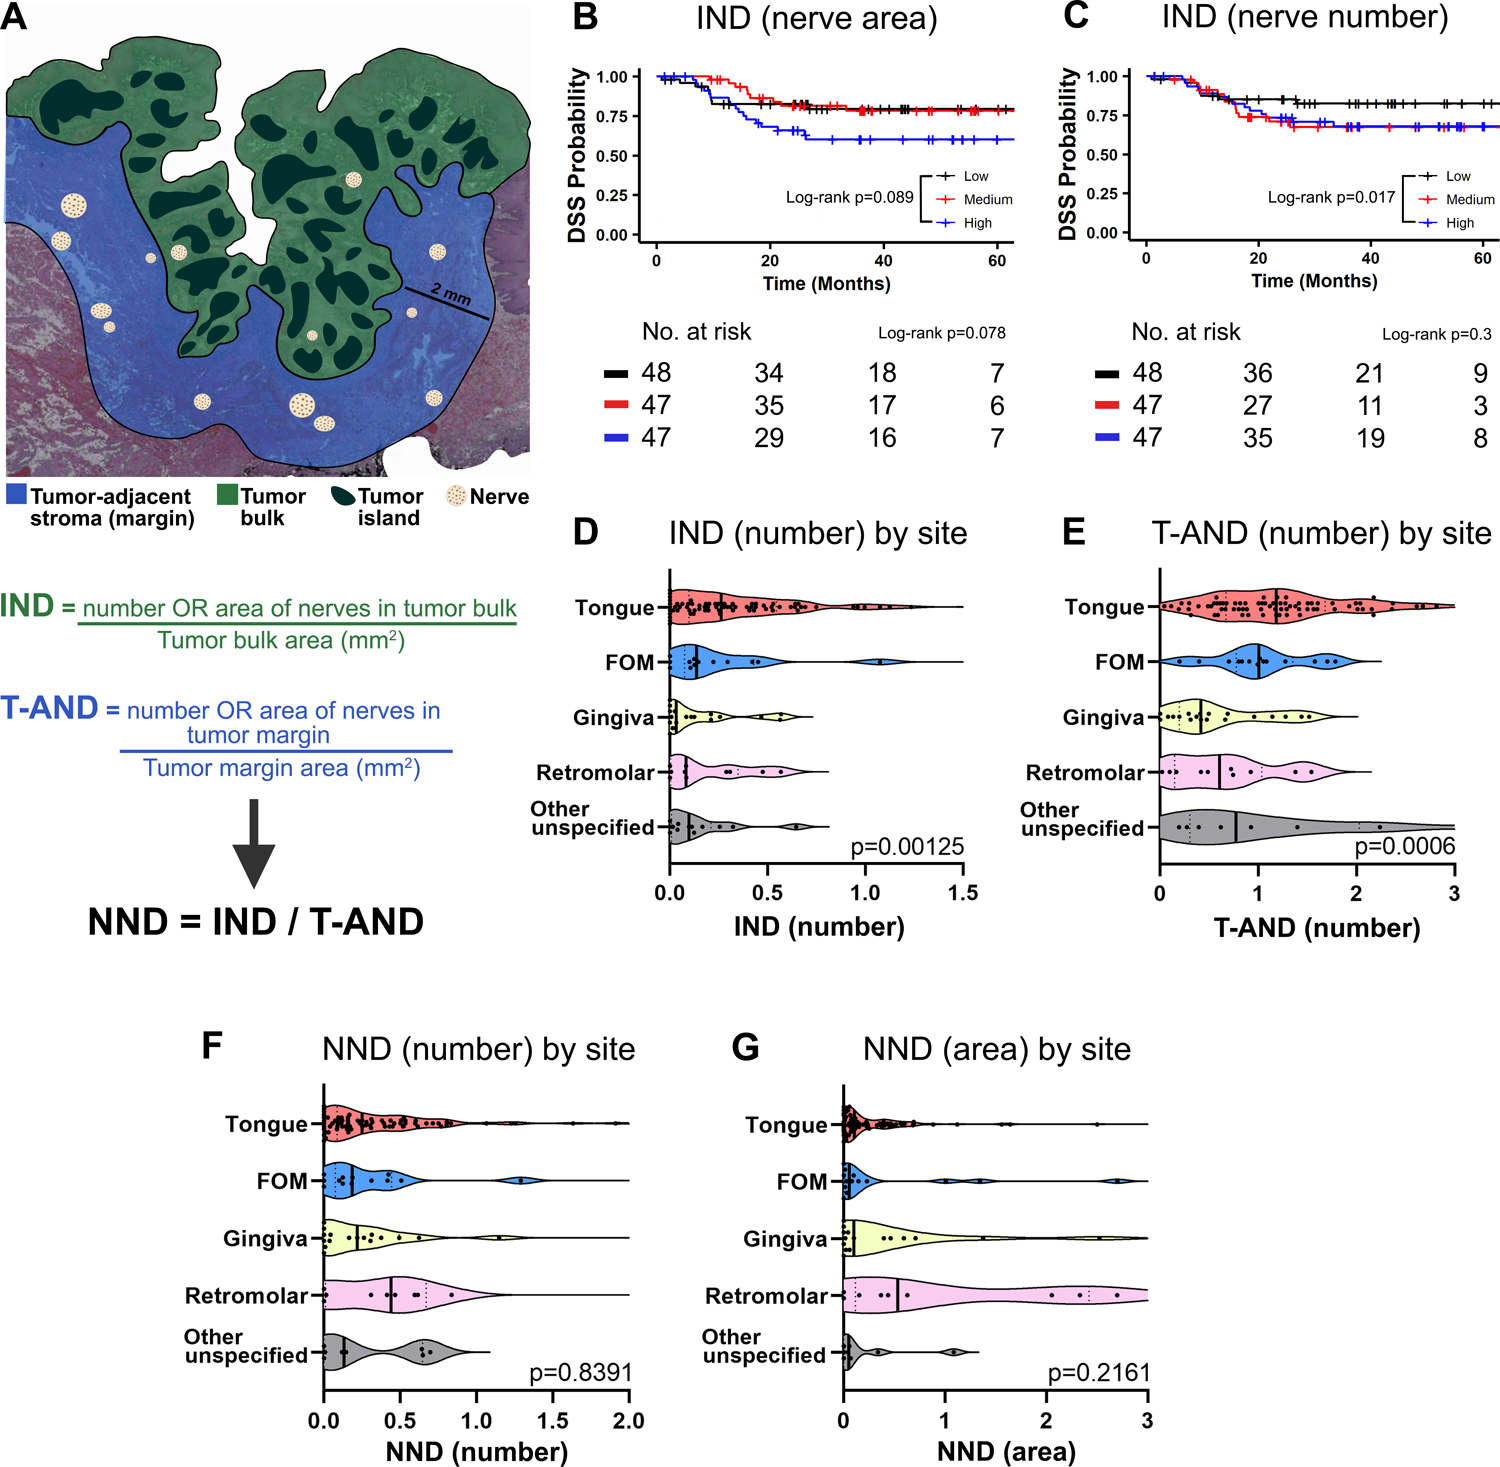
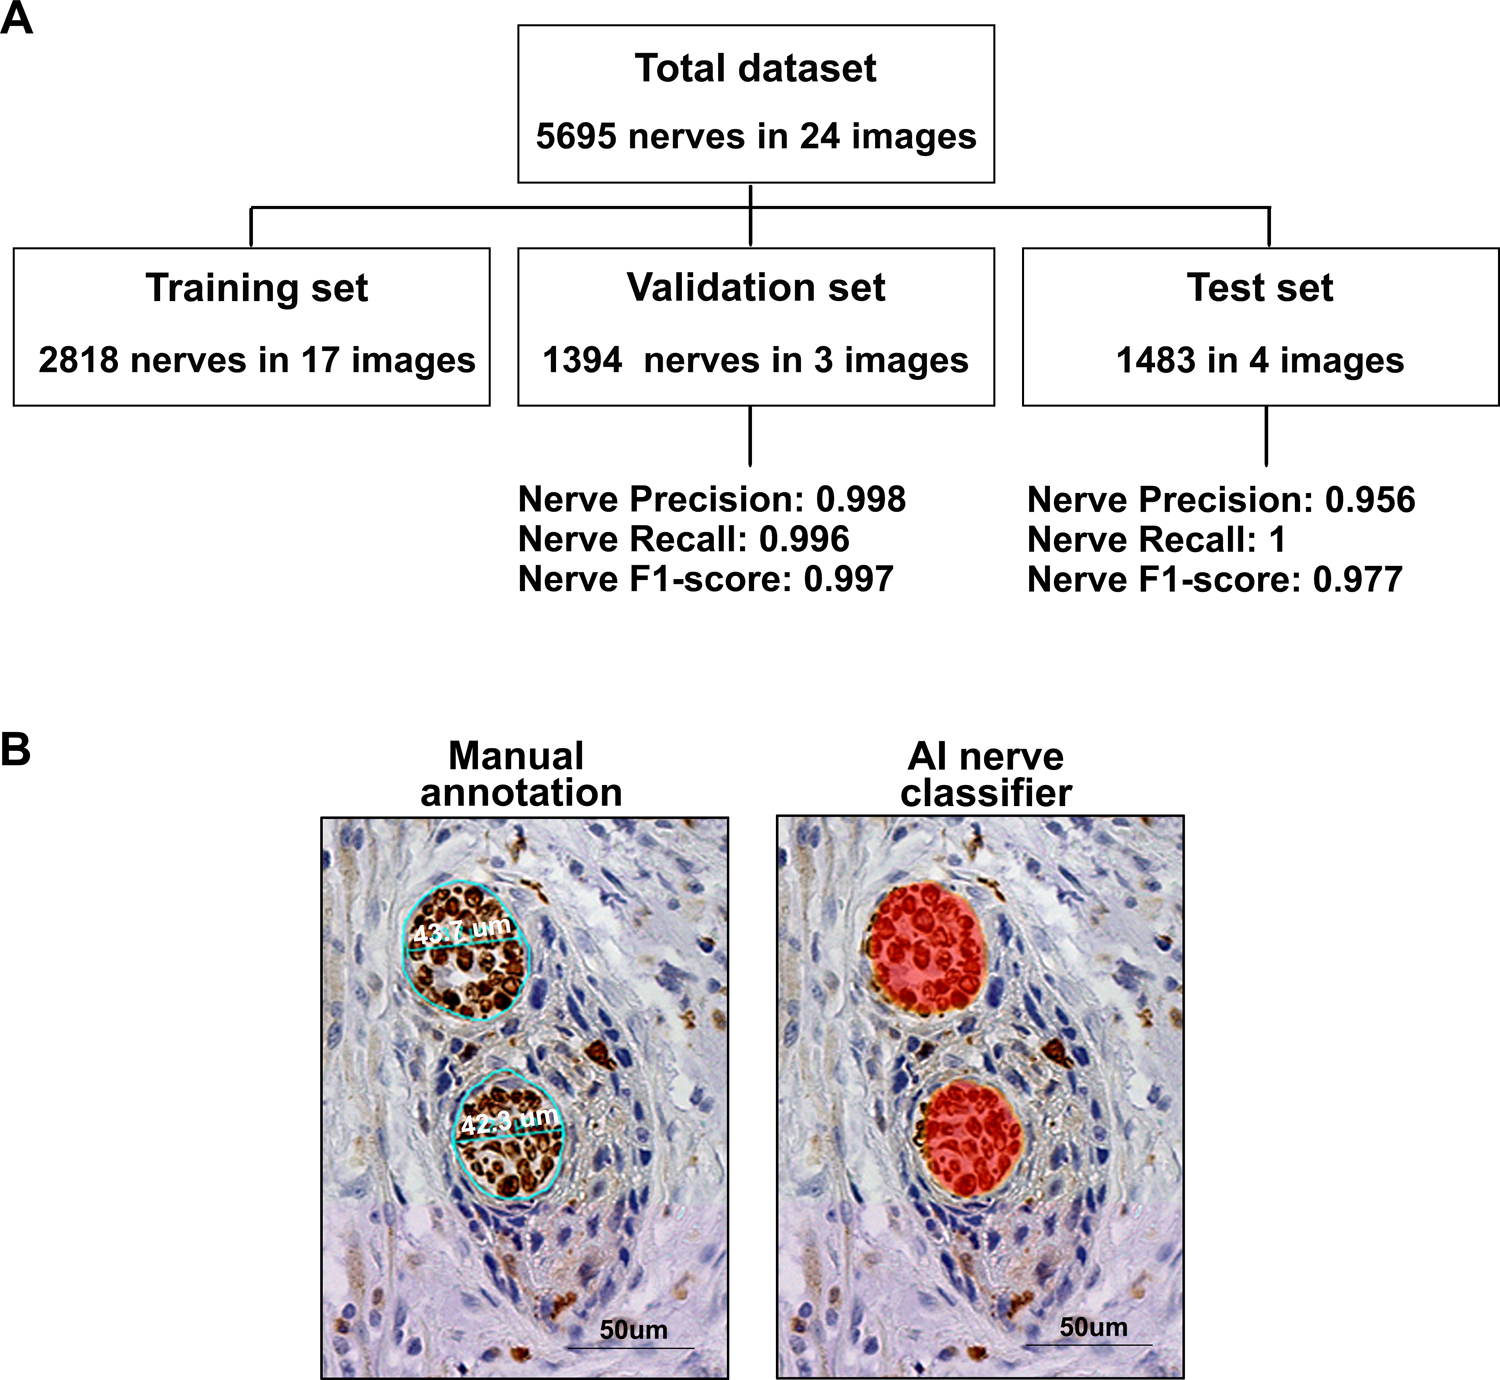
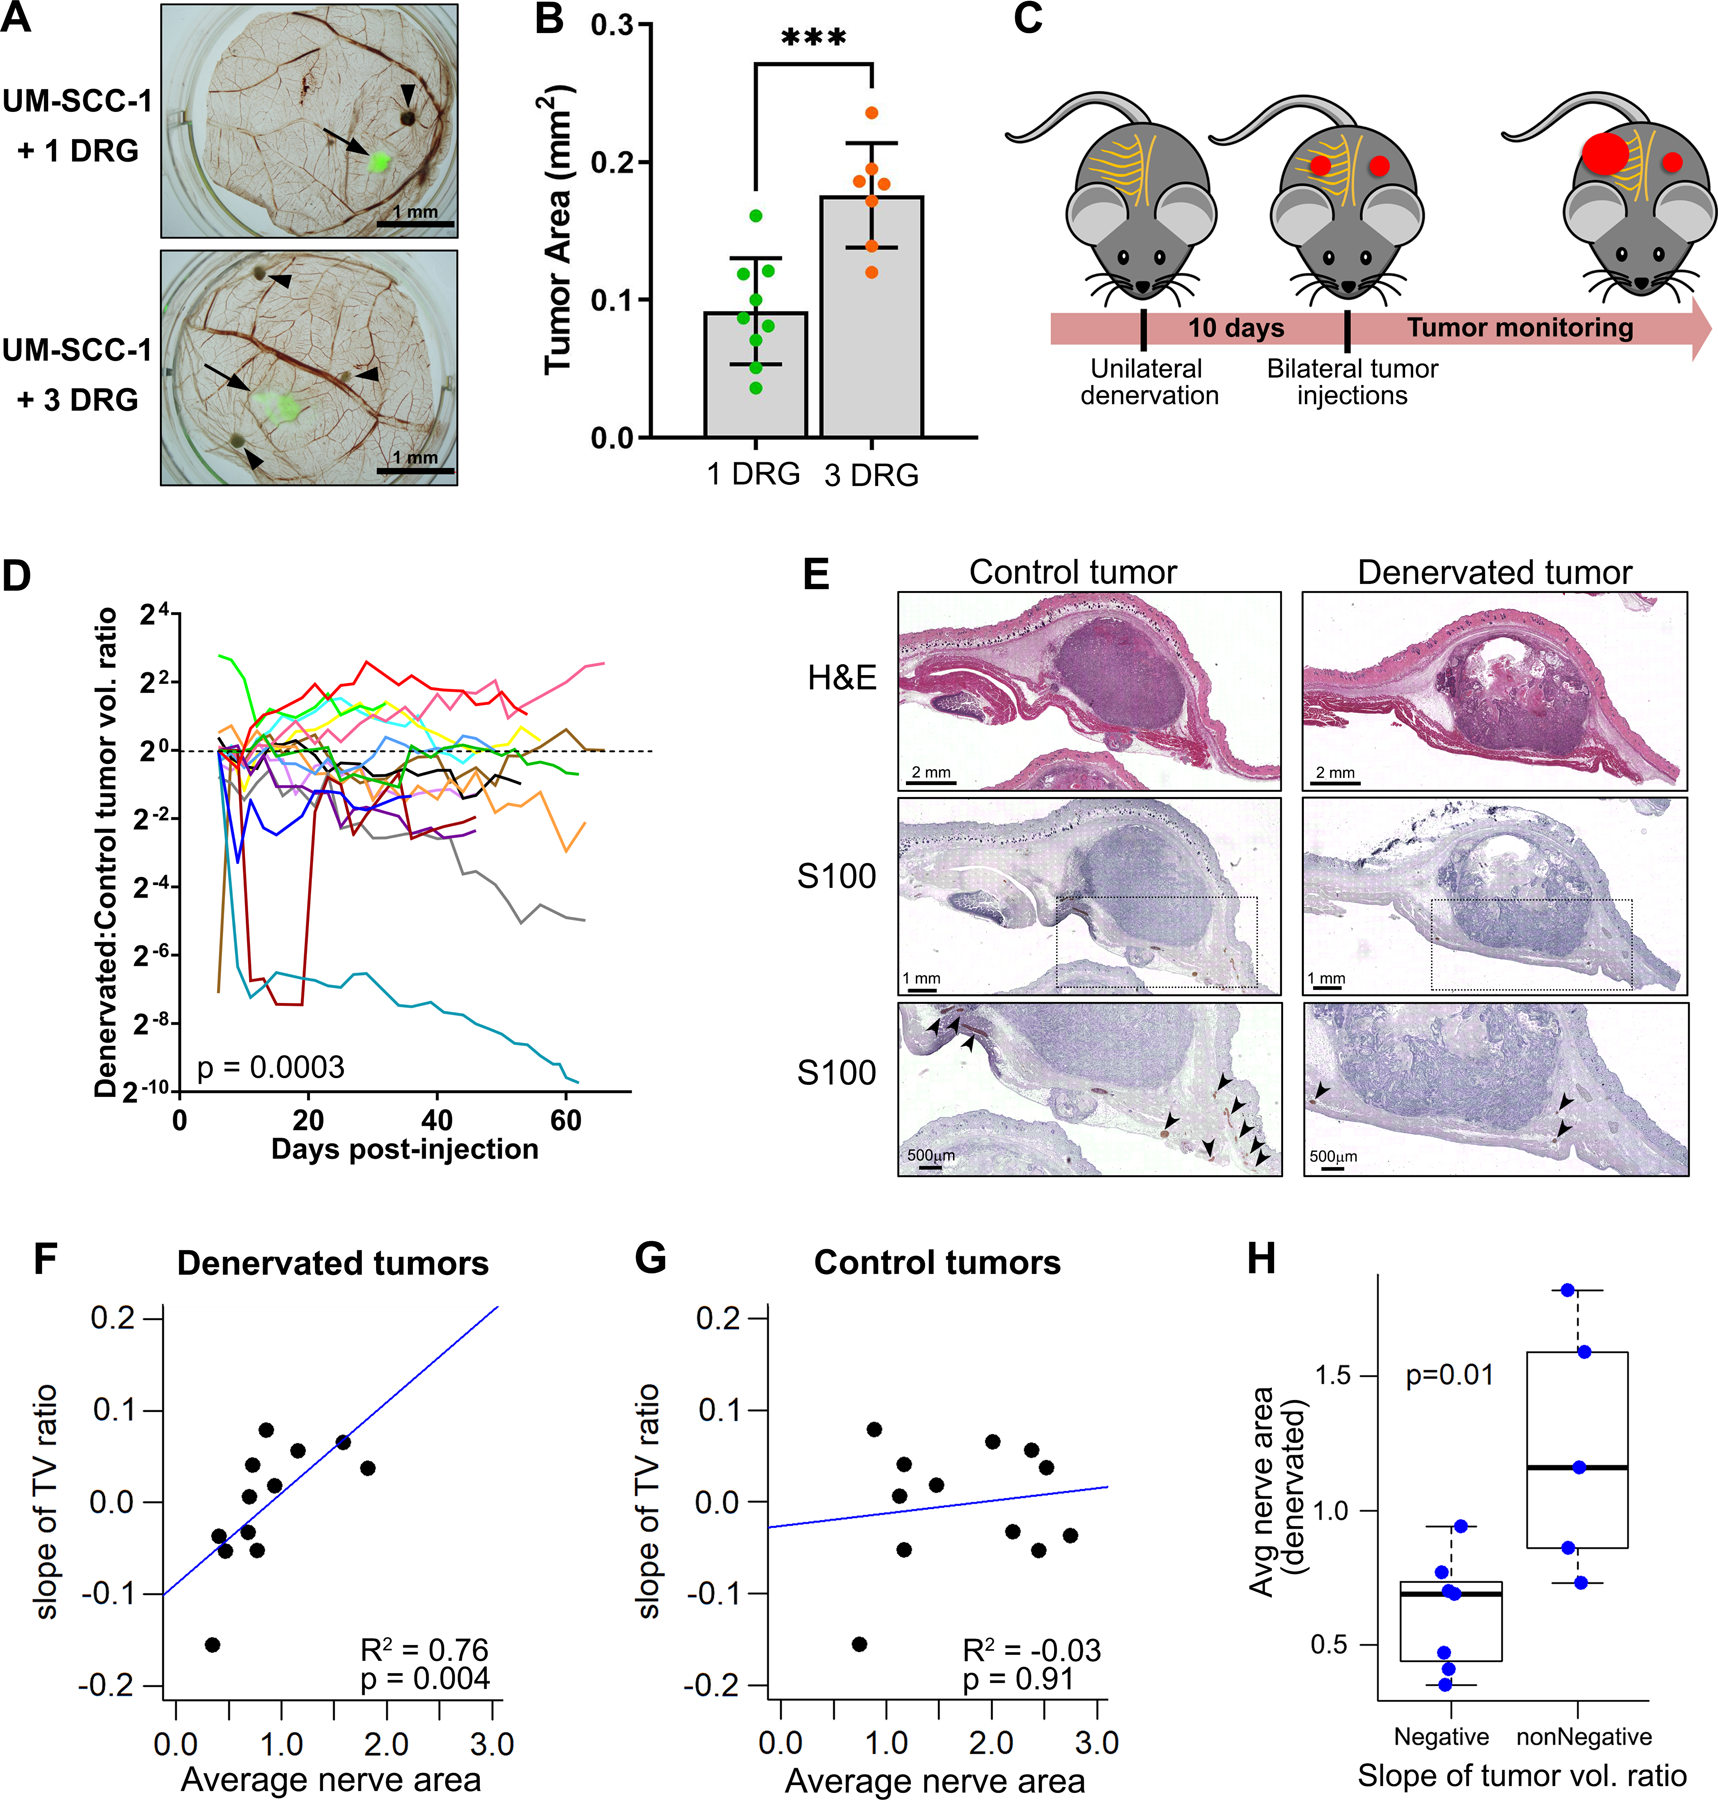
Experimental design: To investigate whether increased ND in OSCC influences patient outcome, we performed survival analyses. Tissue sections of OSCC from 142 patients were stained with hematoxylin and eosin and IHC stains to detect nerves and tumor. ND within the tumor bulk and in the adjacent 2 mm was quantified; normalized ND (NND; bulk ND/adjacent ND) was calculated. The impact of ND on tumor growth was evaluated in chick chorioallantoic-dorsal root ganglia (CAM-DRG) and murine surgical denervation models. Cancer cells were grafted and tumor size quantified. Automated nerve detection, applying the Halo AI platform, was compared with manual assessment.

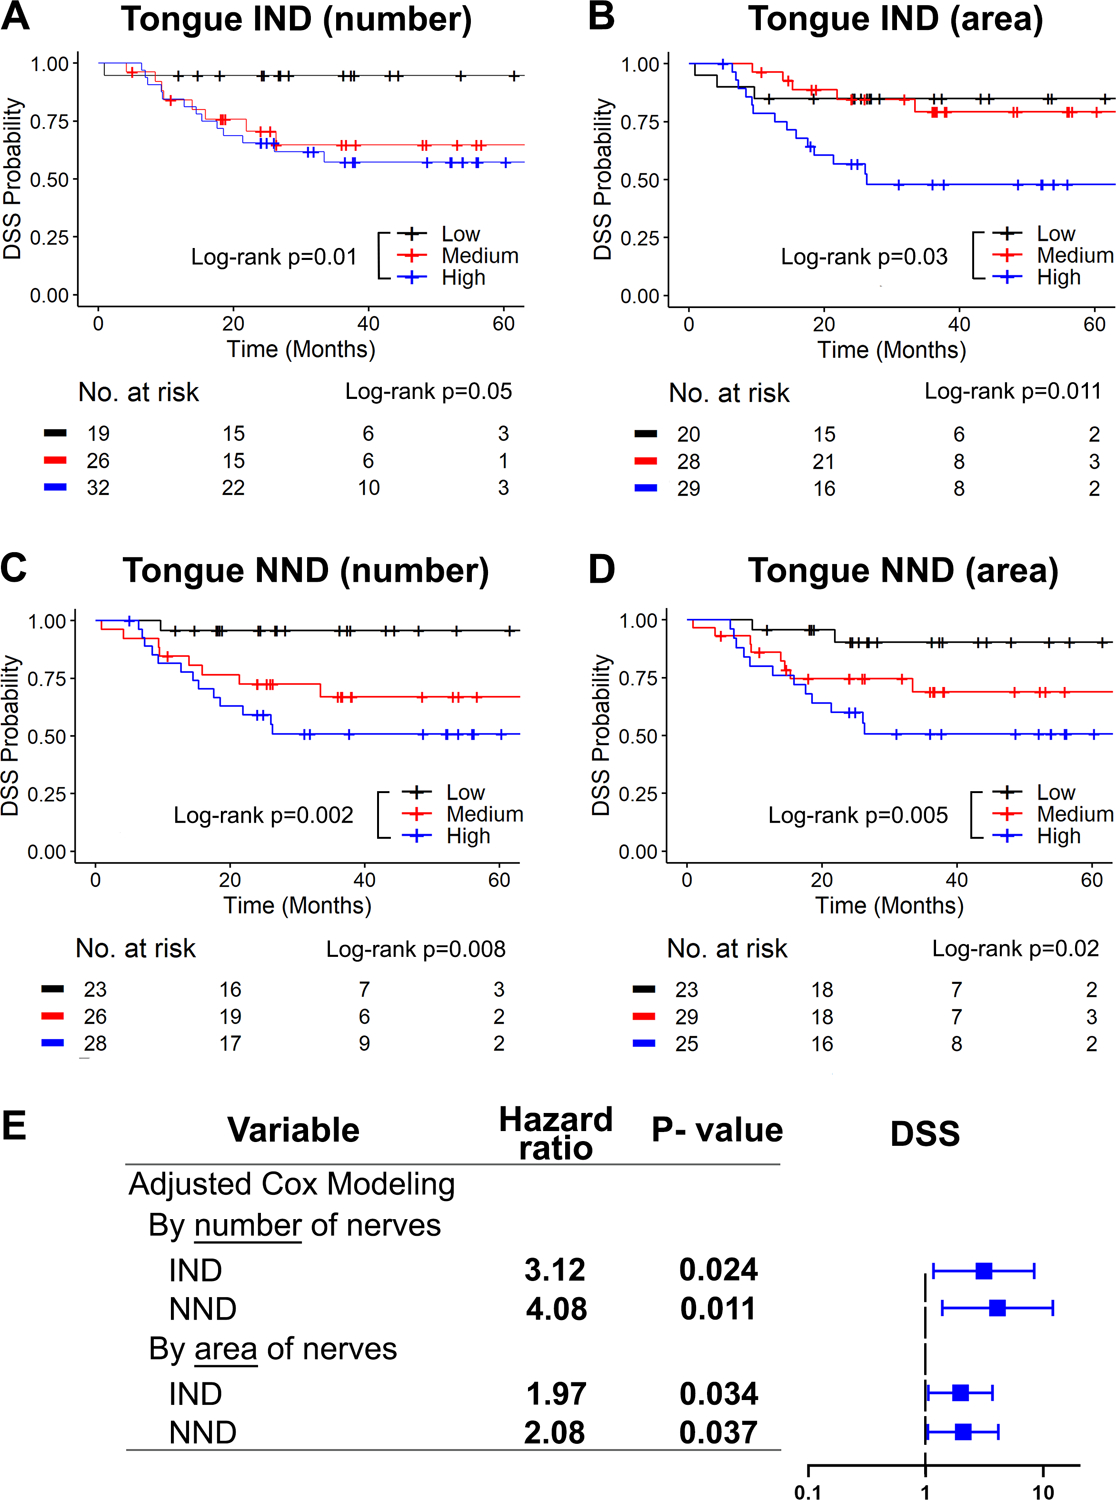
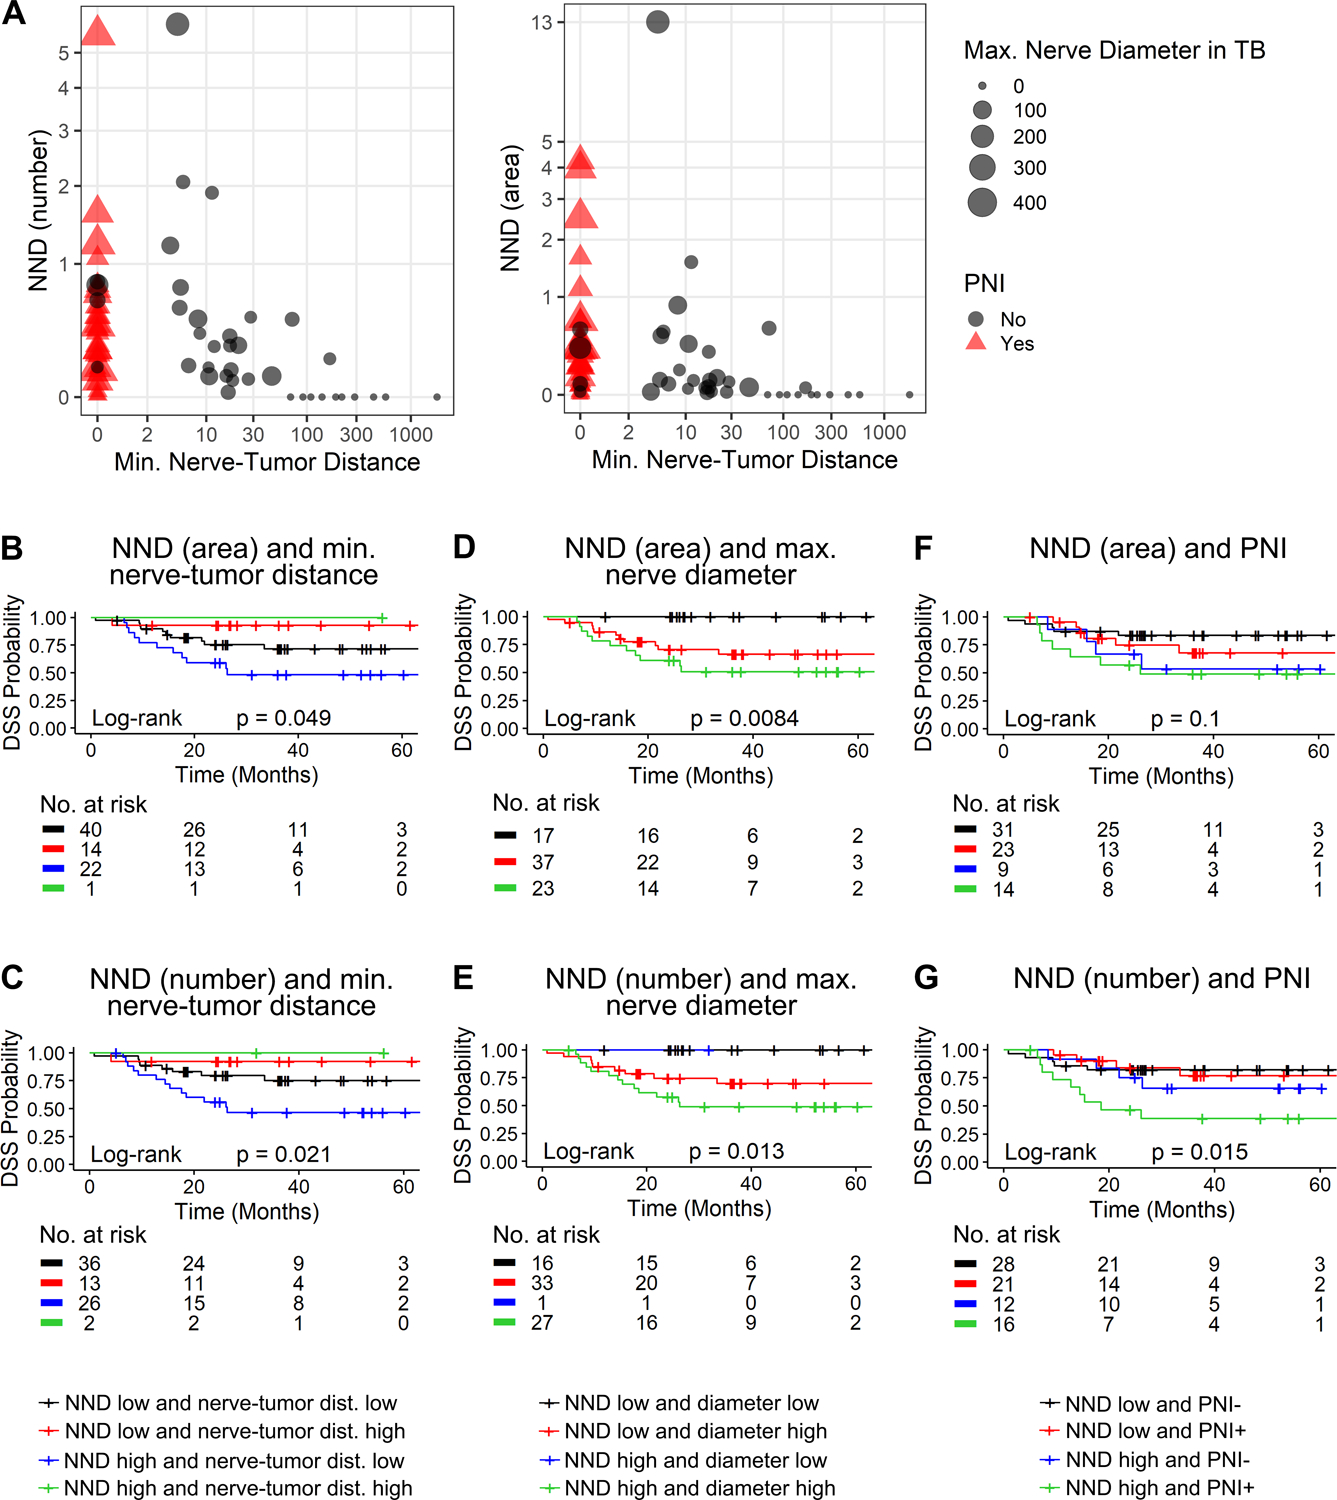
Results: Disease-specific survival decreased with higher intratumoral ND and NND in tongue SCC. Moreover, NND was associated with worst pattern-of-invasion and PNI. Increasing the number of DRG, in the CAM-DRG model, increased tumor size. Reduction of ND by denervation in a murine model decreased tumor growth. Automated and manual detection of nerves showed high concordance, with an F1 score of 0.977.

Conclusions: High ND enhances tumor growth, and NND is an important prognostic factor that could influence treatment selection for aggressive OSCC. See related commentary by Hondermarck and Jiang, p. 2342.


Conflict of interest statement

Conflict of interest: The authors have declared that no conflict of interest exists.

Figures

Figure 1:
Figure 1:. Intratumoral nerve density associates with poor survival in OSCC.
A, Schematic representation of zones for nerve density analysis. B and C, High intratumoral nerve density (IND) calculated using area (B) and number (C) of nerves associate with poor DSS. D, IND measured by number of nerves with patients grouped by tumor location. E, T-AND measured by number of nerves with patients grouped by tumor location. Note high IND and T-AND in tongue SCC in D and E. F, Normalized nerve density (NND) measured by number of nerves with patients grouped by tumor location. G, NND measured by area of nerves, and tumor location. B and C show Kaplan-Meier survival curves with log-rank statistics; patients are split by tertiles of IND using area (B), and number (C) of nerves. The number of patients at risk for each time point is shown below each plot. Kruskal-Wallis test was used in D through G, a few datapoints were excluded/cut from D-G plots for better visualization but all data was considered for analysis; FOM = floor-of-mouth.
Figure 2:
Figure 2:. High normalized nerve density (IND/T-AND) independently associates with poor survival in tongue SCC.
A and B, High IND in the tongue associates with poor DSS, for both number (A) and area (B) of nerves. C and D, High NND in the tongue associates with poor DSS when calculated using number (C) and area (D) of nerves. Kaplan-Meier survival curves with log-rank statistics are shown in A through D; patients are split by tertiles of IND or NND and the number of patients at risk for each time point is shown below each plot. (E) Adjusted Cox modeling of DDS. Data is adjusted for tumor clinical stage (AJCC 7th edition), differentiation and comorbidities. Significant HRs at p<0.05 are shown in bold and depicted in blue. IND and NND values were log-transformed to fit the model. HR= Hazard ratio.
Figure 3:
Figure 3:. NND helps predict survival in association with other nerve-related parameters.
A, Multidimensional plots of NND versus minimum nerve-tumor distance, classifying patients by maximum nerve diameter in the tumor bulk and PNI status; NND measured with number (left plot) and area (right plot) of nerves. Kaplan-Meier curves of NND and other nerve-related parameters; minimum nerve-tumor distance (B and C), maximum nerve diameter in the tumor bulk, (D and E), and PNI (F and G). Overall log-rank statistics are shown within each plot in B through G; patients are split by cut-offs obtained by regression-tree analyses for nerve-tumor distance (27.63 μm) and diameter (26.39 μm). NND cut-off is defined as the high tertile of NND (0.42). The number of patients at risk for each time point is shown below each plot.
Figure 4:
Figure 4:. Artificial intelligence-based detection of nerve density replicates manual detection.
A, Flowchart of datasets. The total dataset was composed of 5695 nerves drawn in 24 images, and it was split in training, validation and test sets. Precision, recall and F1-score for detecting nerves are presented for the validation and test set. B, Comparison between manual annotations of nerves (Diameters of upper and lower nerves were 43.7 μm and 42.3 μm, respectively) and AI classifier mask identifying the same nerves (red overlay on the right). Bar = 50 μm
Figure 5:
Figure 5:. High nerve density increases tumor growth.
A, In vivo assessment of nerve density using the CAM-DRG model. DRGs were grafted on day 8 and fluorescently labeled UM-SCC-1 cells on day 10; upper CAMs were harvested on day 14. Arrows show labeled UM-SCC-1 cells, arrowheads show DRG locations. B, Tumor area quantification based on fluorescence; unpaired t-test p-value: *** <0.01. C, Schematic representation of surgical denervation. Subcutaneous dorsal nerves were removed unilaterally from C57BL6/J mice with sham surgery on the contralateral side. MOC1 cells were injected bilaterally after 10 days. D, Denervated/ control tumor volume ratio; each mouse is represented by a different color (n = 16; linear mixed model p-value = 0.0003). E, Histologic sections of control and denervated tumors. S100 stain facilitated nerve assessment in tissue sections. Arrows show nerve segments. F and G, Correlation between slope of tumor volume ratio and average nerve area on denervated (F) and control tumors (G). Strong positive correlation on the denervated side; Spearman correlation coefficients p-values are shown. H, Average nerve area in denervated tumors versus denervated:control slope of tumor volume ratio over time. Negative slope refers to mice where denervated tumors were smaller than control; non-negative slope has opposite behavior or no differences between denervated and control (t test p-value is shown).

Comment in

Comment on

References

    1. Scanlon CS, Banerjee R, Inglehart RC, Liu M, Russo N, Hariharan A, et al. Galanin modulates the neural niche to favour perineural invasion in head and neck cancer. Nat Commun. 2015;6:6885. - PMC - PubMed
    1. Renz BW, Takahashi R, Tanaka T, Macchini M, Hayakawa Y, Dantes Z, et al. β2 Adrenergic-Neurotrophin Feedforward Loop Promotes Pancreatic Cancer. Cancer Cell. 2018;33(1):75–90.e7. - PMC - PubMed
    1. Sarrouilhe D, Clarhaut J, Defamie N, Mesnil M. Serotonin and cancer: what is the link? Curr Mol Med. 2015;15(1):62–77. - PubMed
    1. Lang K, Bastian P. Neurotransmitter effects on tumor cells and leukocytes. Prog Exp Tumor Res. 2007;39:99–121. - PubMed
    1. Amit M, Takahashi H, Dragomir MP, Lindemann A, Gleber-Netto FO, Pickering CR, et al. Loss of p53 drives neuron reprogramming in head and neck cancer. Nature. 2020;578(7795):449–54. - PMC - PubMed

Publication types