. 2023 Jul 11;46(7):zsad112.
doi: 10.1093/sleep/zsad112.

Quiet wakefulness: the influence of intraperitoneal and intranasal oxytocin on sleep-wake behavior and neurophysiology in rats

Affiliations

Quiet wakefulness: the influence of intraperitoneal and intranasal oxytocin on sleep-wake behavior and neurophysiology in rats

Joel S Raymond et al. Sleep. .

Abstract

Study objectives: Exogenous administration of the neuropeptide oxytocin exerts diverse effects on various neurobehavioral processes, including sleep and wakefulness. Since oxytocin can enhance attention to social and fear-related environmental cues, it should promote arousal and wakefulness. However, as oxytocin can attenuate stress, reduce activity, and elicit anxiolysis, oxytocin might also prime the brain for rest, and promote sleep. At present, little research has comprehensively characterized the neuropsychopharmacology of oxytocin-induced effects on sleep-wake behavior and no reconciliation of these two competing hypotheses has been proposed.

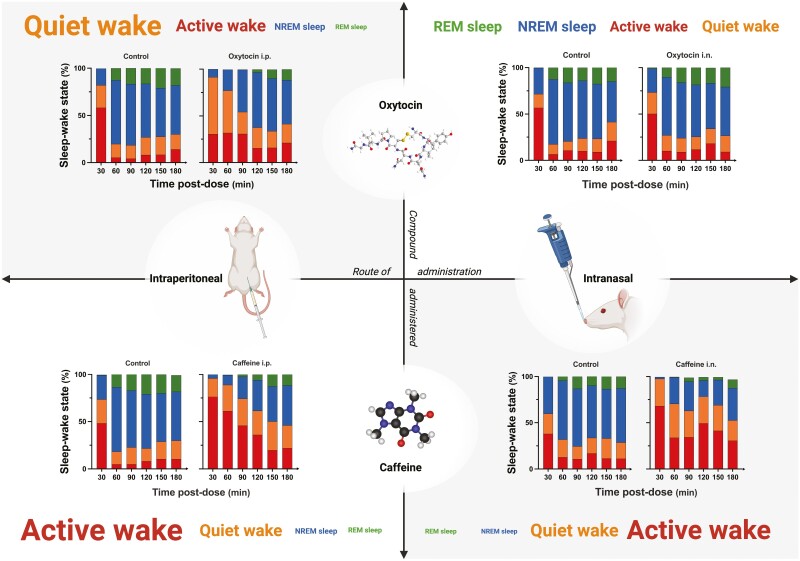
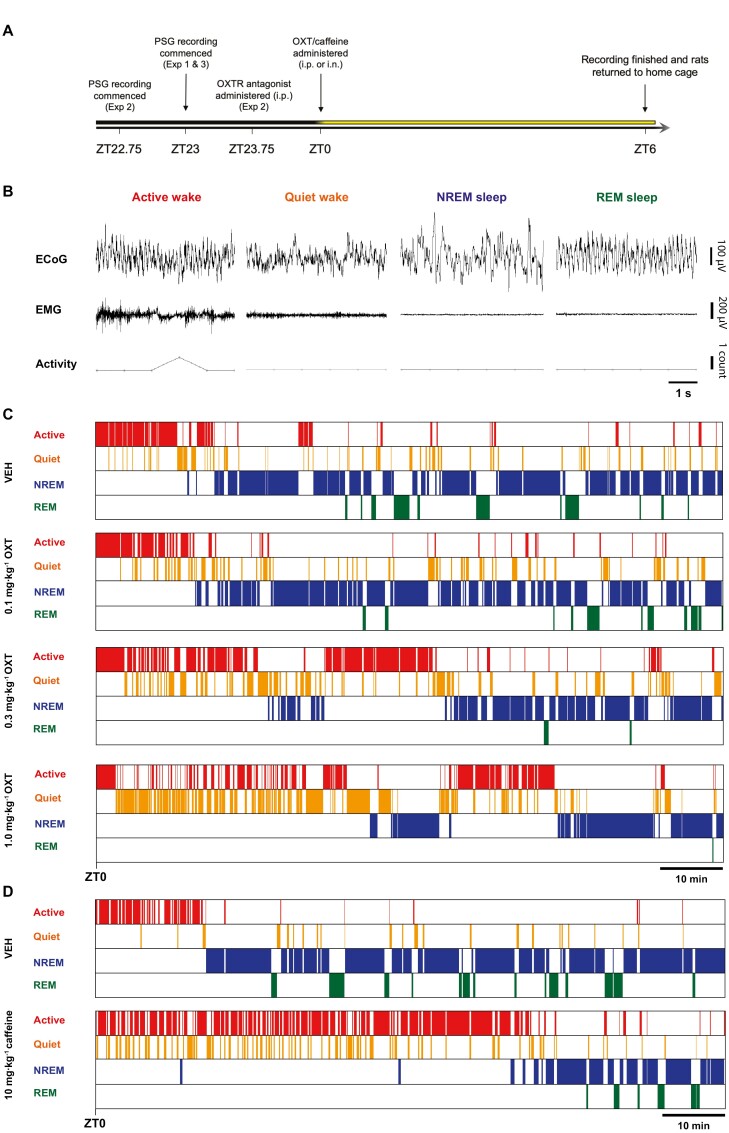
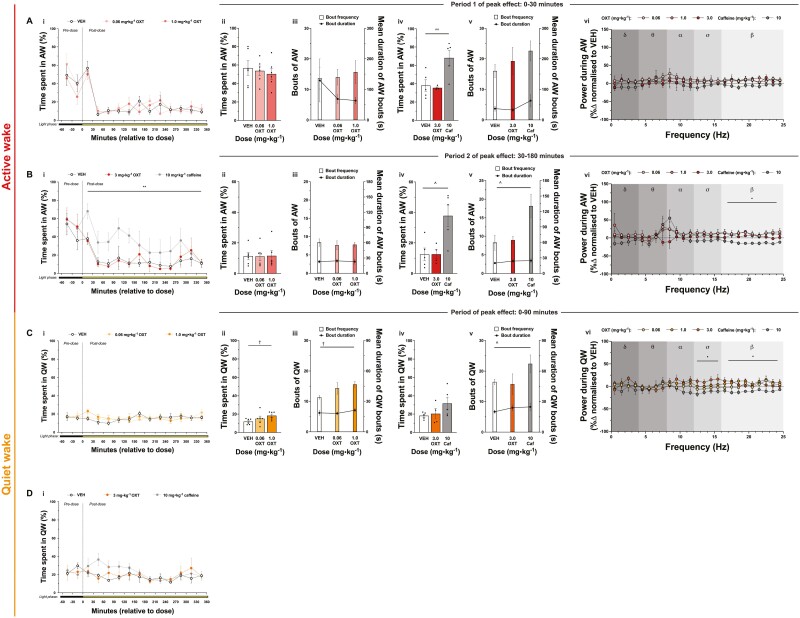
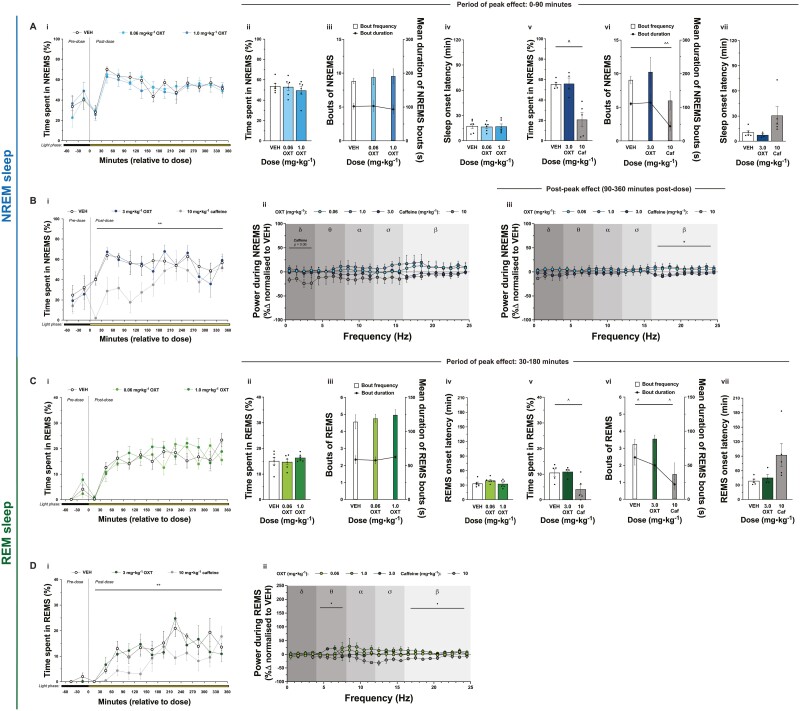
Methods: This study explored the effects of oxytocin on sleep-wake outcomes using radiotelemetry-based polysomnography in adult male and female Wistar rats. Oxytocin was administered via intraperitoneal (i.p.; 0.1, 0.3 and 1 mg·kg-1) and intranasal (i.n.; 0.06, 1, 3 mg·kg-1) routes. Caffeine (i.p. and i.n.; 10 mg·kg-1) was administered as a wake-promoting positive control. To ascertain mechanism of action, pretreatment experiments with the oxytocin receptor (OXTR) antagonist L-368,899 (i.p.; 5 mg·kg-1) followed by oxytocin (i.p.; 1 mg·kg-1) were also conducted.

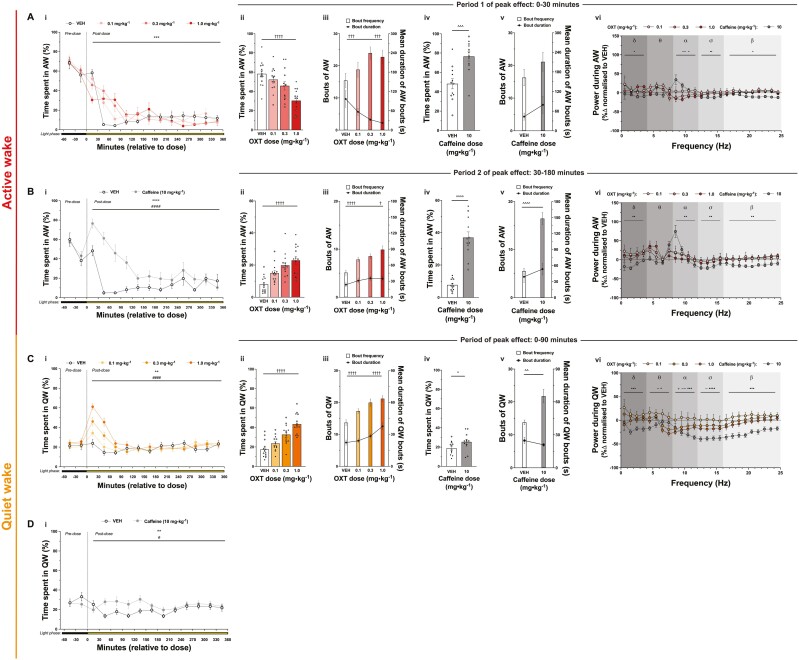
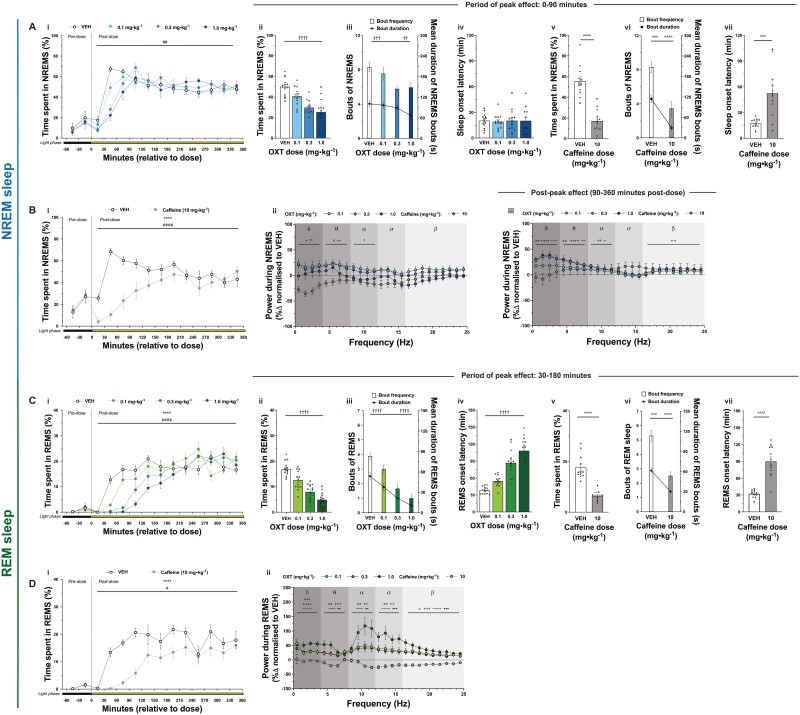
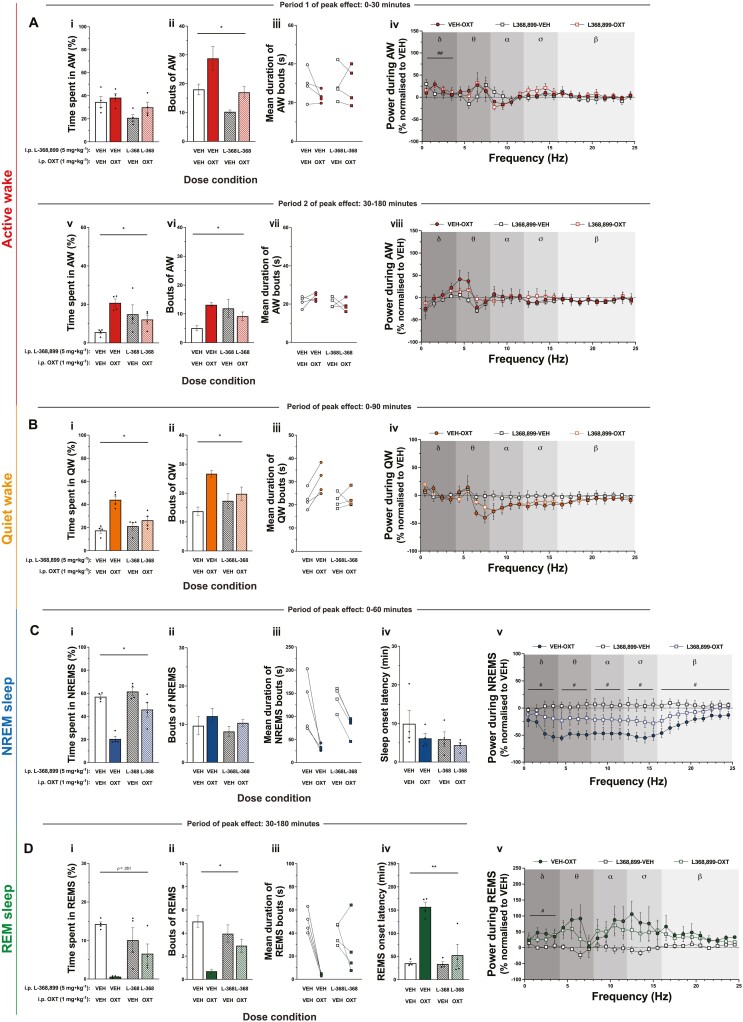
Results: In both male and female rats, i.p. oxytocin promoted quiet wakefulness at the cost of suppressing active wakefulness, non-rapid eye movement (NREM) and rapid eye movement (REM) sleep. Several i.p. oxytocin-induced sleep-wake effects were mediated by OXTR binding. In contrast, i.n. oxytocin did not alter most sleep-wake outcomes at any dose tested. Both i.p. and i.n. caffeine demonstrated wake-promoting effects.

Conclusions: These findings help reconcile competing hypotheses of oxytocin-induced effects on sleep-wake behavior: i.p. oxytocin promotes quiet wakefulness-a state of restful environmental awareness compatible with both oxytocin's anxiolytic effects and its enhancement of processing complex stimuli.

Keywords: caffeine; intranasal; intraperitoneal; oxytocin; oxytocin receptor; quiet wakefulness; rat; rodent; sleep; wake.


Figures

Graphical Abstract
Graphical Abstract
Figure 1.
Figure 1.
Overview of polysomnographic session timeline, sleep–wake scoring procedure, and representative hypnograms from experiment 1. (A) Experimental schedule outlining the timing of procedures undertaken during recording sessions. The gradient and color of the bar represent the circadian phase and intensity of light conditions during the shift from the dark phase to the light phase. i.n.: intranasal; i.p.: intraperitoneal; OXT: oxytocin; OXTR: oxytocin receptor; PSG: polysomnography; ZT: zeitgeber, timing relative to light onset (ZT0). (B) Representative polysomnography traces (5-second duration) of each sleep–wake state category used for scoring. ECoG: electrocorticography; EMG: electromyography. (C) Representative hypnograms depicting sleep–wake state across 0–120 minutes of recording (starting at ZT0) for each dose of i.p. oxytocin administered (0, 0.1, 0.3, and 1 mg·kg−1). (D) Representative hypnograms depicting sleep–wake state across 0–120 minutes of recording (starting at ZT0) for i.p. caffeine (0, 10 mg·kg−1). Hypnograms for (C) and (D) were constructed using data from the subject with the median effect size of i.p. oxytocin 1 mg·kg−1 on %QW 0–90 minutes.
Figure 2.
Figure 2.
Effects of i.p. oxytocin and i.p. caffeine on wake outcomes. Oxytocin effects. Influence of i.p. oxytocin (0, 0.1, 0.3, and 1 mg·kg−1) on %AW across entire 7-hour recording session (Ai), %AW during first period of peak effect (0–30 minutes) (Aii), AW bout frequency and mean AW bout duration during first period of peak effect (0–30 minutes) (Aiii), %AW during second period of peak effect (30–180 minutes) (Bii), AW bout frequency and mean AW bout duration during second period of peak effect (30–180 minutes) (Biii), %QW across entire 7-hour recording session (Ci), %QW during first period of peak effect (0–90 minutes) (Cii), and QW bout frequency and mean QW bout duration during first period of peak effect (0–90 minutes) (Ciii). Caffeine effects. Influence of i.p. caffeine (0 and 10 mg·kg−1) on %AW across entire 7-hour recording session (Bi), %AW during first period of peak effect (0–30 minutes) (Aiv), AW bout frequency and mean AW bout duration during first period of peak effect (0–30 min) (Av), %AW during second period of peak effect (30–180 minutes) (Biv), AW bout frequency and mean AW bout duration during second period of peak effect (30–180 minutes) (Bv), %QW across entire 7-hour recording session (Di), %QW during period of peak effect (0–90 minutes) (Civ), and QW bout frequency and mean QW bout duration during period of peak effect (0–90 minutes) (Cv). PSD effects. Influence of i.p. oxytocin and caffeine on ECoG PSD from 0 to 30 minutes (Avi) and 30–180 minutes (Bvi) during AW, and from 0 to 90 minutes during QW (Cvi). Sample sizes for oxytocin dose–response are n = 6 males (for all doses) and n = 8 females for all doses except 0.1 mg·kg−1 which is n = 7. Sample sizes for caffeine-positive control are n = 6 males and n = 6 females for all doses. Data represent mean values ± S.E.M., individual data points represent individual subject data (open circles—males; closed circles—females). For % time spent in sleep–wake state graphs, data points represent values for 30-minute bins; values pertain to the bin of time defined by the x-axis timepoints to the immediate left and right of the data point. Dose was administered at ZT0 and color of bar below x-axis signifies light cycle phase at each time point: black—dark (active) phase; yellow—light (rest) phase. For ECoG PSD figures, data represent mean percentage change in ECoG PSD (0.1–25 Hz) ± S.E.M. Statistical significance is indicated by the following symbols: * – dose main effect; # – dose × time interaction effect; † – linear trend contrast; ^ pairwise comparison; × – 0.1 mg·kg−1 oxytocin versus VEH; + – 0.3 mg·kg−1 oxytocin versus VEH; ~ – 1 mg·kg−1 oxytocin versus VEH; • – 10 mg·kg−1 caffeine versus VEH. For graphs with two y-axes, the alignment of the significance symbol represents which outcome the significance refers to: left—bout frequency; right—mean bout duration. Level of statistical significance is indicated by the number of symbols: one—p < .05, two—p < .01, three—p < .001, four—p < .0001.
Figure 3.
Figure 3.
Effects of i.p. oxytocin and i.p. caffeine on sleep outcomes. Oxytocin effects. Influence of i.p. oxytocin (0, 0.1, 0.3, and 1 mg·kg−1) on %NREMS sleep across entire 7-hour recording session (Ai), %NREMS during period of peak effect (0–90 minutes) (Aii), NREMS bout frequency and mean NREMS bout duration during period of peak effect (0–90 minutes) (Aiii), sleep onset latency (Aiv), %REMS across entire 7-hour recording session (Ci), %REM sleep during period of peak effect (30–180 minutes) (Cii), REMS bout frequency and mean REMS bout duration during period of peak effect (30–180 minutes) (Ciii), and REMS onset latency (Civ). Caffeine effects. Influence of i.p. caffeine (0 and 10 mg·kg−1) on %NREMS across entire 7-hour recording session (Bi), %NREMS during period of peak effect (0–90 minutes) (Av), NREMS bout frequency and mean bout duration during period of peak effect (0–90 minutes) (Avi), sleep onset latency (Avii), %REM sleep across entire 7-hour recording session (Di), %REM sleep during period of peak effect (30–180 minutes) (Cv), REMS bout frequency and mean bout duration during period of peak effect (30–180 minutes) (Cvi), and REMS onset latency (Cvii). PSD effects. Influence of i.p. oxytocin dose range and caffeine on ECoG PSD from 0 to 90 minutes and 90–360 minutes during NREMS (Bii and Biii, respectively) and 30–180 minutes during REMS (Dii). Sample sizes for oxytocin dose–response are n = 6 males (for all doses) and n = 8 females for all doses except 0.1 mg·kg−1 which is n = 7. Sample sizes for caffeine-positive control are n = 6 for males and females for all doses. Data represent mean values ± S.E.M., individual data points represent individual subject data (open circles—males; closed circles—females). For % time spent in sleep–wake state graphs, data points represent values for 30-minute bins; values pertain to the bin of time defined by the x-axis timepoints to the immediate left and right of the data point. Dose was administered at ZT0 and color of bar below x-axis signifies light cycle phase at each time point: black—dark (active) phase; yellow—light (rest) phase. For ECoG PSD figures, data represent mean percentage change in ECoG PSD (0.1–25 Hz) ± S.E.M. Statistical significance is indicated by the following symbols: * – dose main effect; # – dose × time interaction effect; † – linear trend contrast; ^ pairwise comparison; × – 0.1 mg·kg−1 oxytocin versus VEH; + – 0.3 mg·kg−1 oxytocin versus VEH; ~ – 1 mg·kg−1 oxytocin versus VEH; • – 10 mg·kg−1 caffeine versus VEH. For graphs with two y-axes, the alignment of the significance symbol represents which outcome the significance refers to: left—bout frequency; right—mean bout duration. Level of statistical significance is indicated by the number of symbols: one—p < .05, two—p < .01, three—p < .001, four—p < .0001.
Figure 4.
Figure 4.
Influence of OXTR antagonism on oxytocin-induced effects on sleep–wake outcomes. Influence of pre-administration of the OXTR antagonist L-368 899 (i.p.; 5 mg·kg−1) on oxytocin-induced (i.p.; 1 mg·kg−1) effects on: %AW (Ai), AW bouts (Aii), mean duration of AW bouts (Aiii), and ECoG PSD during AW (Aiv) during first period of AW peak effect (0–30 minutes); %AW (Av), AW bouts (Avi), mean duration of AW bouts (Avii), and ECoG PSD during AW (Aviii) during the second period of AW peak effect (30–180 minutes); %QW (Bi), QW bouts (Bii), mean duration of QW bouts (Biii), and ECoG PSD during QW (Biv) during the period of QW peak effects (0–90 minutes); %NREMS (Ci), NREMS bouts (Cii), mean duration of NREMS bouts (Ciii), sleep onset latency (Civ), and ECoG PSD during NREMS (Cv) during the period of NREM peak effects (0–60 minutes); %REMS (Di), REMS bouts (Dii), mean duration of REMS bouts (Diii), REMS onset latency (Div), and ECoG PSD (Dv) during period of peak REMS effect (30–180 minutes). Sample size for all dose conditions is n = 4 females. Data represent mean values ± S.E.M., individual data points represent individual subject data (closed circles—females). For Aiii, Avii, Biii, Ciii, and Diii, data points represent individual subject data with lines connecting same subject data. OXTR antagonist was administered at ZT23.75 and oxytocin was administered at ZT0. For ECoG PSD figures, data represent mean percentage change in ECoG PSD (0.1–25 Hz) ± S.E.M. Statistical significance is indicated by the following symbols: * – dose × antagonist interaction effect; # – VEH-oxytocin versus VEH-VEH (baseline) comparison. For graphs with two y-axes, the alignment of the significance symbol represents which outcome the significance refers to: left—bout frequency; right—mean bout duration. Level of statistical significance is indicated by the number of symbols: one—p < .05, two—p < .01, three—p < .001, four—p < .0001.
Figure 5.
Figure 5.
Effects of i.n. oxytocin and i.n. caffeine on wake outcomes. Low and mid-dose oxytocin effects. Influence of i.n. oxytocin (0, 0.06, and 1 mg·kg−1) on %AW across entire 7-hour recording session (Ai), %AW during first period of peak effect (0–30 minutes) (Aii), AW bout frequency and mean AW bout duration during first period of peak effect (0–30 minutes) (Aiii), %AW during second period of peak effect (30–180 min) (Bii), AW bout frequency and mean AW bout duration during second period of peak effect (30–180 minutes) (Biii), %QW across entire 7-hour recording session (Ci), %QW during first period of peak effect (0–90 minutes) (Cii), and QW bout frequency and mean QW bout duration during first period of peak effect (0–90 minutes) (Ciii). High-dose oxytocin and caffeine effects. Influence of i.n. oxytocin (3 mg·kg-1) and i.n. caffeine (10 mg·kg−1) on %AW across entire 7-hour recording session (Bi), %AW during first period of peak effect (0–30 minutes) (Aiv), AW bout frequency and mean AW bout duration during first period of peak effect (0–30 minutes) (Av), %AW during second period of peak effect (30–180 minutes) (Biv), AW bout frequency and mean AW bout duration during second period of peak effect (30–180 minutes) (Bv), %QW across entire 7-hour recording session (Di), %QW during period of peak effect (0–90 minutes) (Civ), and QW bout frequency and mean QW bout duration during period of peak effect (0–90 minutes) (Cv). PSD effects. Influence of i.n. oxytocin and caffeine on ECoG PSD from 0 to 30 minutes (Avi) and 30–180 minutes (Bvi) during AW, and from 0 to 30 minutes during QW (Cvi). Sample size for Experiment 3a was n = 6 females for all doses. Sample size for Experiment 3b was n = 5 females (for all doses) except for the 3 mg·kg−1 oxytocin dose (n = 4). Data represent mean values ± S.E.M., individual data points represent individual subject data (closed circles—females). For % time spent in sleep–wake state graphs, data points represent values for 30-minute bins; values pertain to the bin of time defined by the x-axis timepoints to the immediate left and right of the data point. Dose was administered at ZT0 and color of bar below x-axis signifies light cycle phase at each time point: black—dark (active) phase; yellow—light (rest) phase. For ECoG PSD figures, data represent mean percentage change in ECoG PSD (0.1–25 Hz) ± S.E.M. Data represent mean percentage change in ECoG PSD (0–25 Hz) ± S.E.M. Statistical significance is indicated by the following symbols: * – dose main effect; † – linear trend contrast; ^ pairwise comparison; • – 10 mg·kg−1 caffeine versus VEH. For graphs with two y-axes, the alignment of the significance symbol represents which outcome the significance refers to: left—bout frequency; right—mean bout duration. Level of statistical significance is indicated by the number of symbols: one—p < .05, two—p < .01, three—p < .001, four—p < .0001.
Figure 6.
Figure 6.
Effects of i.n. oxytocin and i.n. caffeine on sleep outcomes. Low and mid oxytocin dose effects. Influence of i.n. oxytocin dose range (0, 0.06, 1 mg·kg−1) on %NREMS across entire 7-hour recording session (Ai), %NREM during period of peak effect (0–90 minutes) (Aii), NREMS bout frequency and mean NREMS bout duration during period of peak effect (0–90 minutes) (Aiii), sleep onset latency (Aiv), %REM sleep across entire 7-hour recording session (Ci), %REM sleep during period of peak effect (30–180 minutes) (Cii), and REMS bout frequency and mean REMS bout duration during period of peak effect (30–180 minutes) (Ciii), and REMS onset latency (Civ). High oxytocin dose and caffeine effects. Influence of i.n. oxytocin (3 mg·kg−1) and i.n. caffeine (10 mg·kg−1) on %NREMS across entire 7-hour recording session (Bi), %NREMS during period of peak effect (0–90 minutes) (Av), NREMS bout frequency and mean NREMS bout duration during period of peak effect (0–90 minutes) (Aii), sleep onset latency (Cvii), %REM sleep across entire 7-hour recording session (Di), %REM sleep during period of peak effect (30–180 minutes) (Cv), REMS bout frequency and mean REMS bout duration during period of peak effect (30–180 minutes) (Cvi), and REMS onset latency (Cvii). PSD effects. Influence of i.n. oxytocin dose range and caffeine on ECoG PSD from 0 to 90 minutes (Bii) and 90–360 minutes (Biii) during NREMS, and 30–180 minutes during REMS (Dii). Sample size for experiment 3a was n = 6 females for all doses. Sample size for experiment 3b was n = 5 females (for all doses) except for 3 mg·kg−1 oxytocin which was n = 4. Data represent mean values ± S.E.M., individual data points represent individual subject data (closed circles—females). For % time spent in sleep–wake state graphs, data points represent values for 30-minute bins; values pertain to the bin of time defined by the x-axis timepoints to the immediate left and right of the data point. Dose was administered at ZT0 and color of bar below x-axis signifies light cycle phase at each time point: black—dark (active) phase; yellow—light (rest) phase. For ECoG PSD figures, data represent mean percentage change in ECoG PSD (0.1-25 Hz) ± S.E.M. Data represent mean percentage change in ECoG PSD (0-25 Hz) ± S.E.M. Statistical significance is indicated by the following symbols: * – dose main effect; ^ pairwise comparison; ⋇ – 3 mg·kg−1 oxytocin versus VEH; • – 10 mg·kg−1 caffeine versus VEH. For graphs with two y-axes, the alignment of the significance symbol represents which outcome the significance refers to: left—bout frequency; right—mean bout duration. Level of statistical significance is indicated by the number of symbols: one—p < .05, two—p < .01, three—p < .001, four—p < .0001.

Similar articles

Cited by

References

    1. Jurek B, Neumann ID.. The oxytocin receptor: from intracellular signaling to behavior. Physiol Rev. 2018;98(3):1805–1908. doi: 10.1152/physrev.00031.2017 - DOI - PubMed
    1. Raymond JS, Rehn S, Hoyos CM, Bowen MT.. The influence of oxytocin-based interventions on sleep-wake and sleep-related behaviour and neurobiology: a systematic review of preclinical and clinical studies. Neurosci Biobehav Rev. 2021;131:1005-1026. doi:10.1016/j.neubiorev.2021.10.016 - DOI - PubMed
    1. Grinevich V, Ludwig M.. The multiple faces of the oxytocin and vasopressin systems in the brain. J Neuroendocrinol. 2021;33(11):e13004. - PubMed
    1. Son S, Manjila SB, Newmaster KT, et al. . Whole-brain wiring diagram of oxytocin system in adult mice. J Neurosci. 2022;42(25):5021–5033. doi: 10.1523/jneurosci.0307-22.2022 - DOI - PMC - PubMed
    1. Quintana DS, Guastella AJ.. An allostatic theory of oxytocin. Trends Cogn Sci. 2020;24(7):515–528. doi: 10.1016/j.tics.2020.03.008 - DOI - PubMed

Publication types